| Param | Original file | Final file |
|---|---|---|
| Filename | modeM0/AS1A04_022T06_9000002182_14773cztM0_level2.evt | modeM0/AS1A04_022T06_9000002182_14773cztM0_level2_quad_clean.evt |
| Size (bytes) | 37,517,760 | 11,761,920 |
| Size | 35.8 MB | 11.2 MB |
| Events in quadrant A | 281,198 | 77,612 |
| Events in quadrant B | 271,861 | 80,107 |
| Events in quadrant C | 281,939 | 72,982 |
| Events in quadrant D | 255,884 | 74,414 |
| Mode SS | |||
|---|---|---|---|
| Quadrant | BADHDUFLAG | Total packets | Discarded packets |
| A | 0 | 18 | 8 |
| B | 0 | 18 | 4 |
| C | 0 | 18 | 6 |
| D | 0 | 18 | 4 |
| Mode M0 | |||
|---|---|---|---|
| Quadrant | BADHDUFLAG | Total packets | Discarded packets |
| A | 0 | 1756 | 499 |
| B | 0 | 1693 | 442 |
| C | 0 | 1701 | 514 |
| D | 0 | 1707 | 477 |
| Quadrant | Total seconds | Saturated seconds | Saturation percentage |
|---|---|---|---|
| A | 621 | 0 | 0.000000% |
| B | 625 | 1 | 0.160000% |
| C | 590 | 0 | 0.000000% |
| D | 609 | 0 | 0.000000% |
Noise dominated data is calculated using 1-second bins in cleaned event files. If a bin has >2000 counts, and if more than 50% of those come from <1% of pixels, then it is considered to be noise-dominated and hence unusable.
| Quadrant | # 1 sec bins | Bins with >0 counts | Bins with >2000 counts | High rate bins dominated by noise | Noise dominated (total time) | Noise dominated (detector-on time) | Marked lightcurve |
|---|---|---|---|---|---|---|---|
| A | 837 | 705 | 0 | 0 | 0.00% | 0.00% | 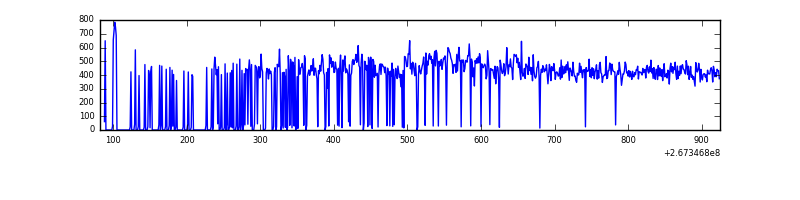 |
| B | 844 | 711 | 0 | 0 | 0.00% | 0.00% | 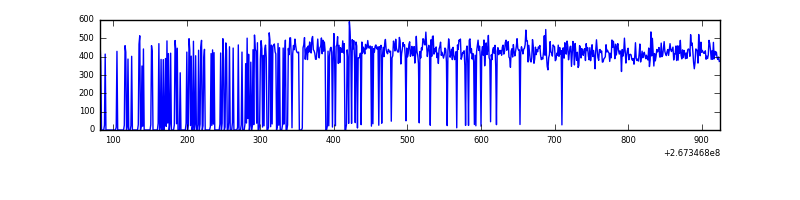 |
| C | 843 | 681 | 0 | 0 | 0.00% | 0.00% | 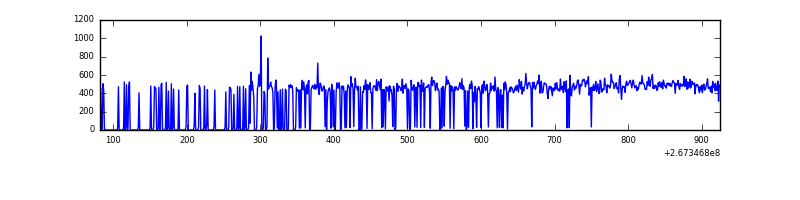 |
| D | 839 | 691 | 0 | 0 | 0.00% | 0.00% | 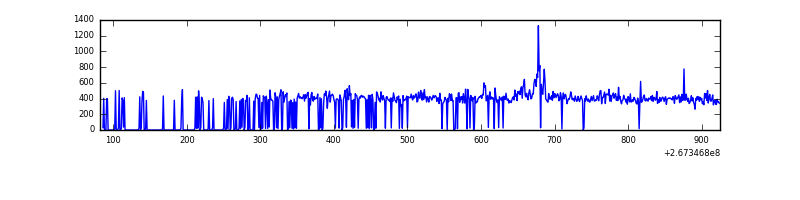 |
Top three noisy pixels from each quadrant. If the there are fewer than three noisy pixels in the level2.evt file, extra rows are filled as -1
| Pixel properties | Quadrant properties | ||||||
|---|---|---|---|---|---|---|---|
| Quadrant | DetID | PixID | Counts | Sigma | Mean | Median | Sigma |
| A | 12 | 189 | 13938 | 856.3 | 69 | 67 | 16.2 |
| A | 0 | 226 | 606 | 33.27 | 69 | 67 | 16.2 |
| A | 12 | 194 | 499 | 26.67 | 69 | 67 | 16.2 |
| B | 12 | 111 | 1577 | 95.82 | 69 | 68 | 15.7 |
| B | 11 | 111 | 1236 | 74.17 | 69 | 68 | 15.7 |
| B | 14 | 111 | 1077 | 64.07 | 69 | 68 | 15.7 |
| C | 3 | 233 | 35581 | 2160.29 | 62 | 62 | 16.4 |
| C | 4 | 254 | 1930 | 113.61 | 62 | 62 | 16.4 |
| C | 13 | 61 | 465 | 24.51 | 62 | 62 | 16.4 |
| D | 9 | 1 | 8327 | 446.5 | 64 | 62 | 18.5 |
| D | 2 | 234 | 1825 | 95.24 | 64 | 62 | 18.5 |
| D | 15 | 0 | 1451 | 75.04 | 64 | 62 | 18.5 |
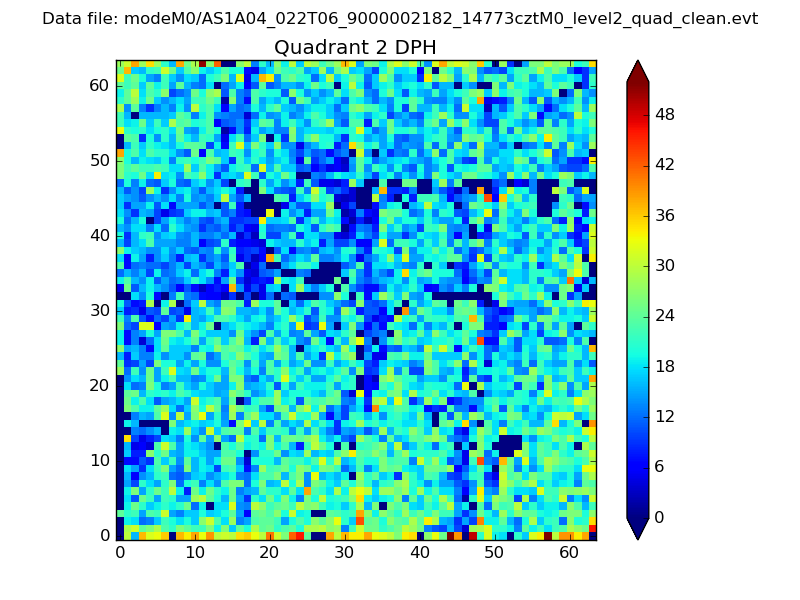
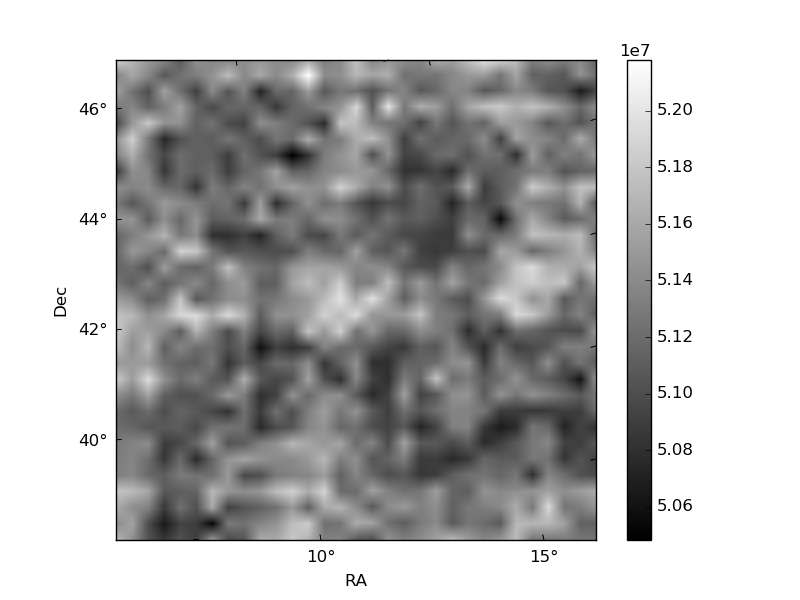
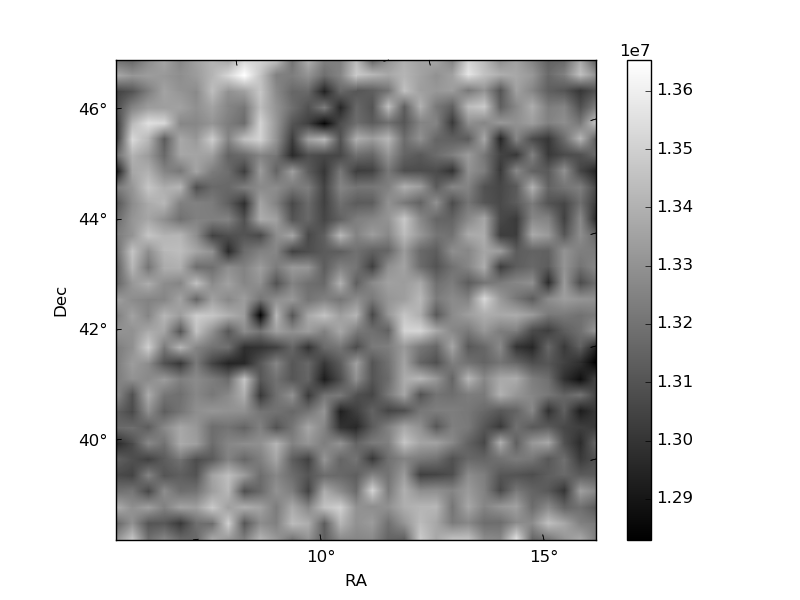
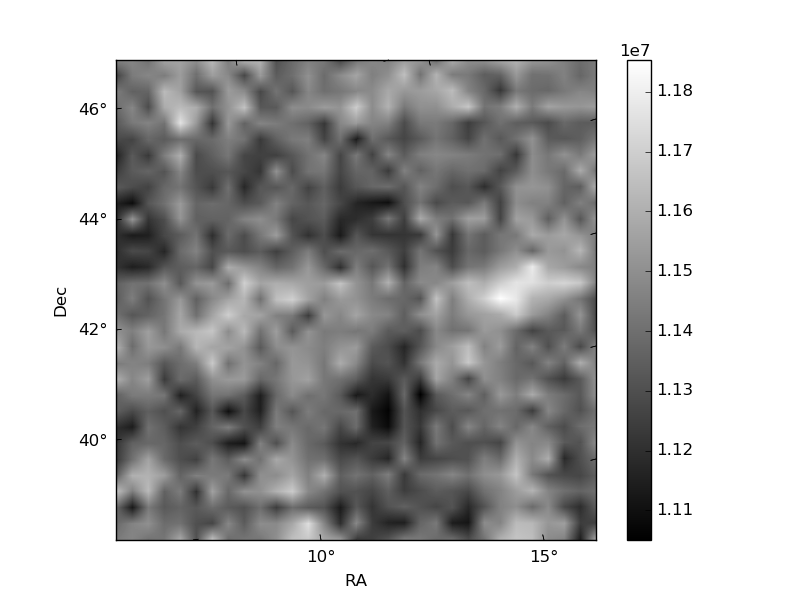
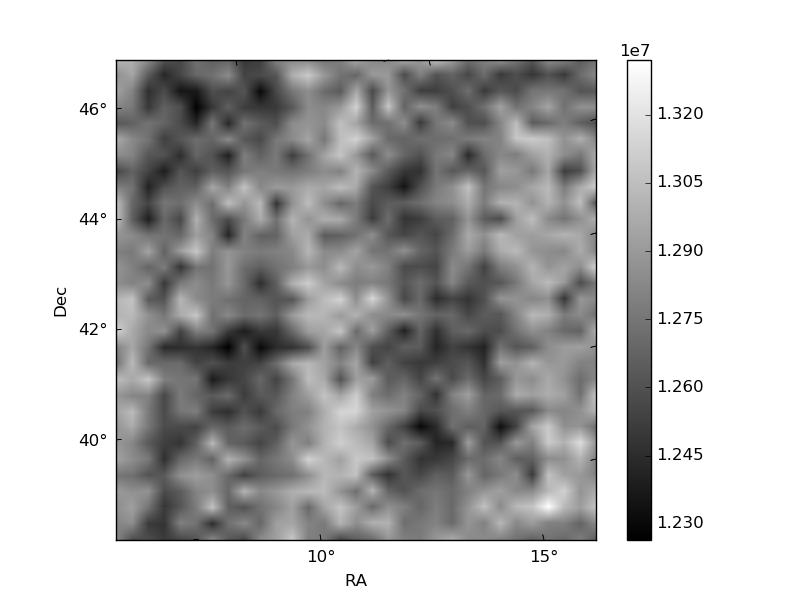
Histogram calculated using DETX and DETY for each event in the final _common_clean file
| Quadrant A | 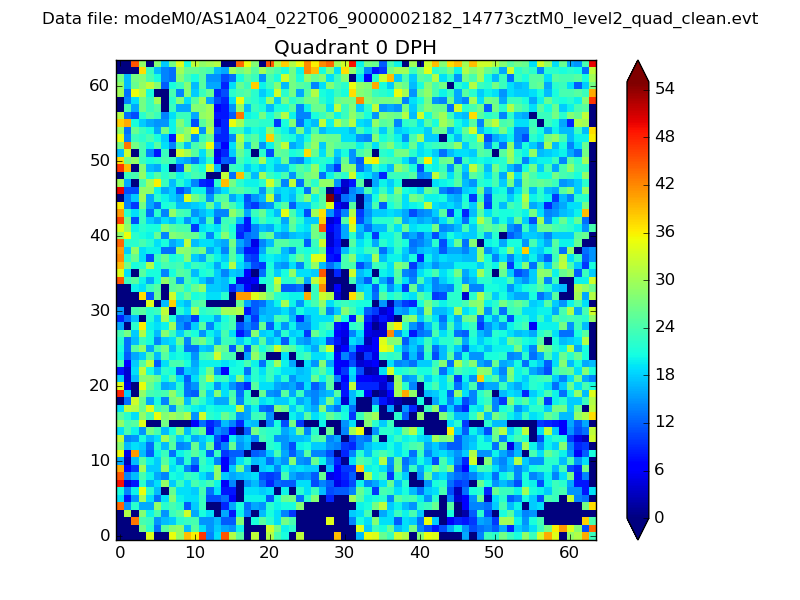 |
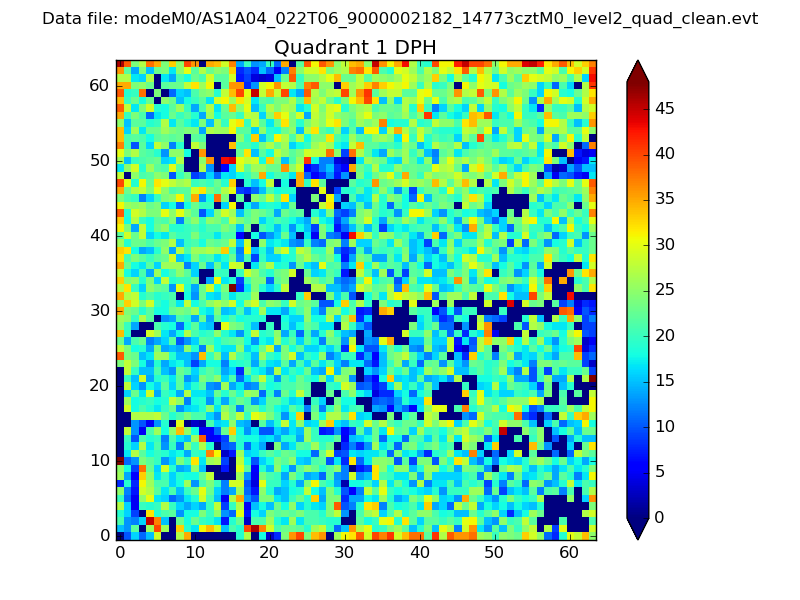 |
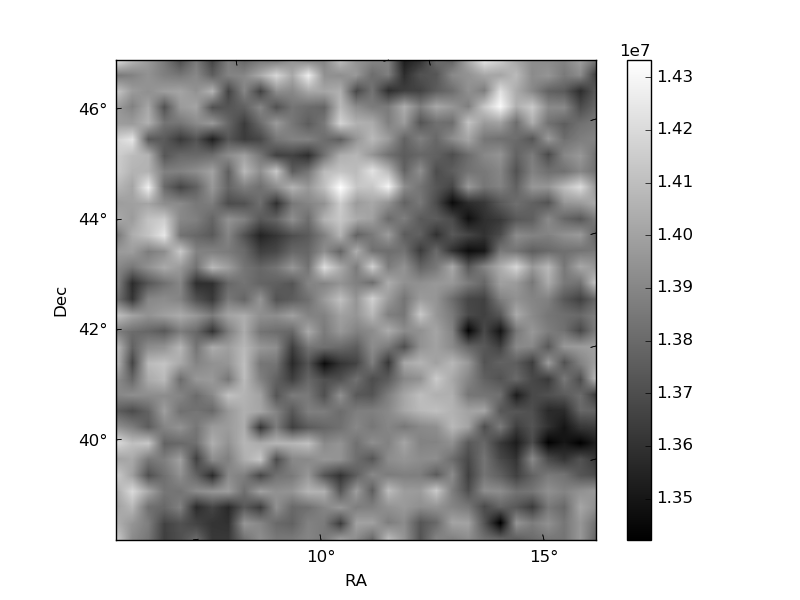
Quadrant B |
|---|---|---|---|
| Quadrant D | 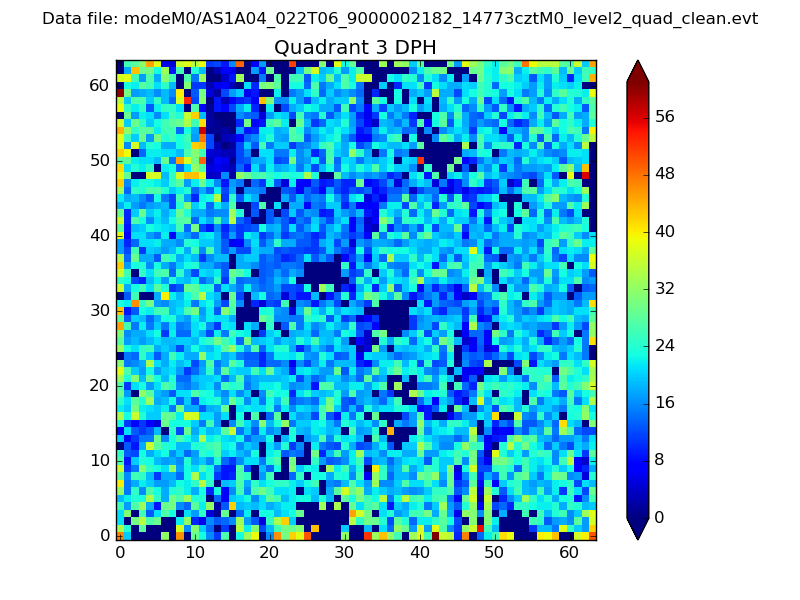 |
 |
Quadrant C |
| Plot type | Count rate plots | Images |
|---|---|---|
| Comparison with Poisson distribution Blue bars denote a histogram of data divided into 1 sec bins. Red curve is a Poisson curve with rate = median count rate of data. |
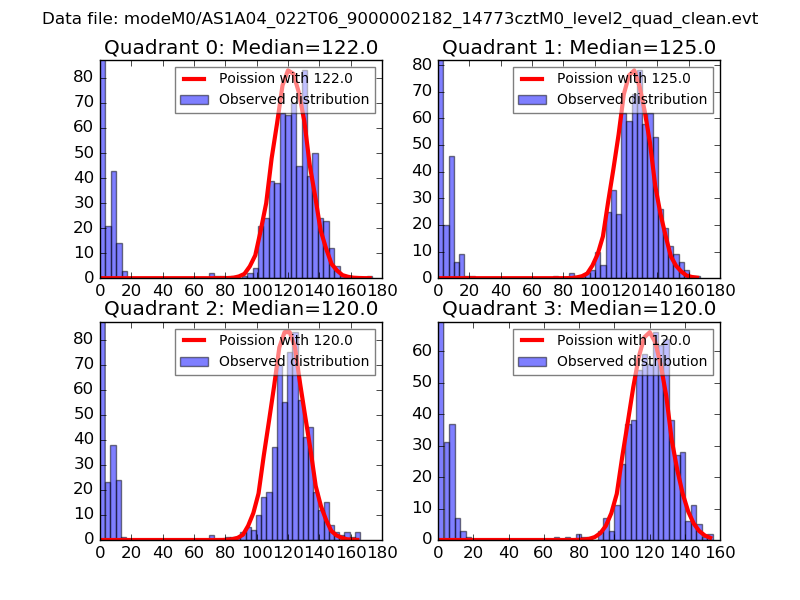 |
 |
| Quadrant-wise count rates Data is divided into 100 sec bins |
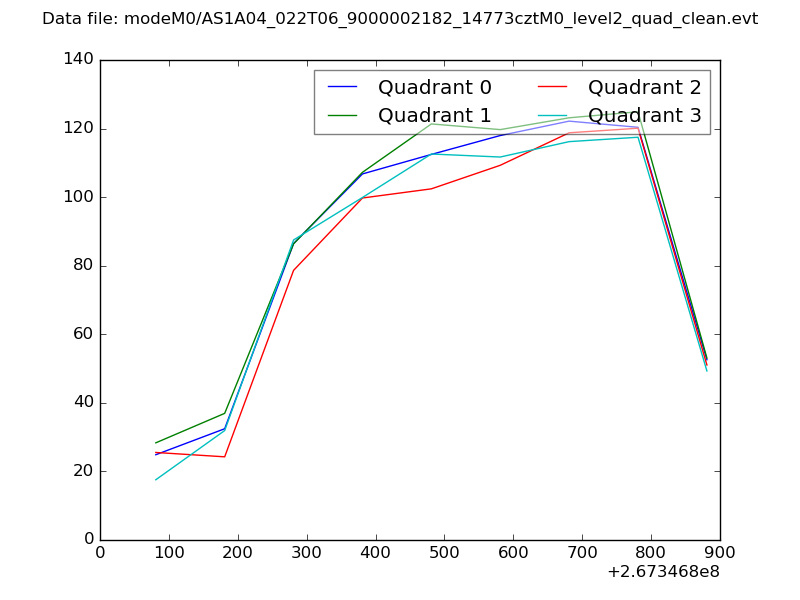 |
|
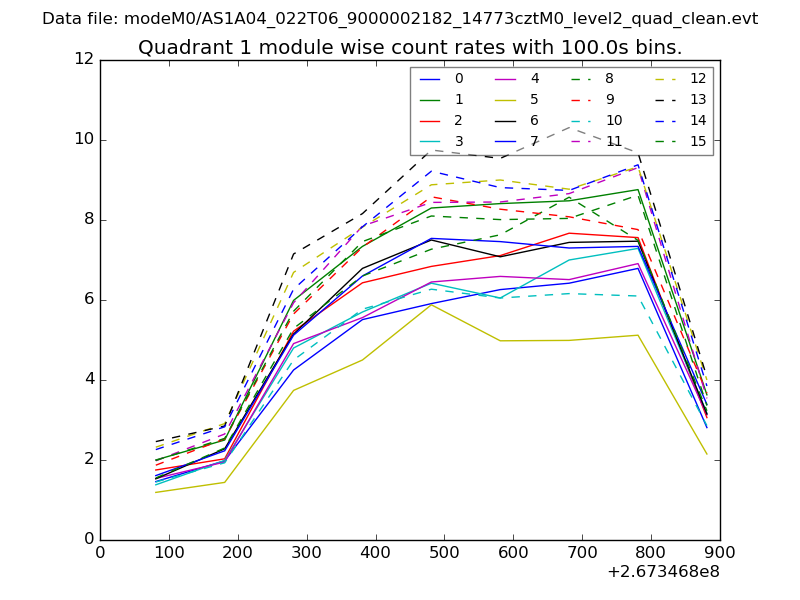
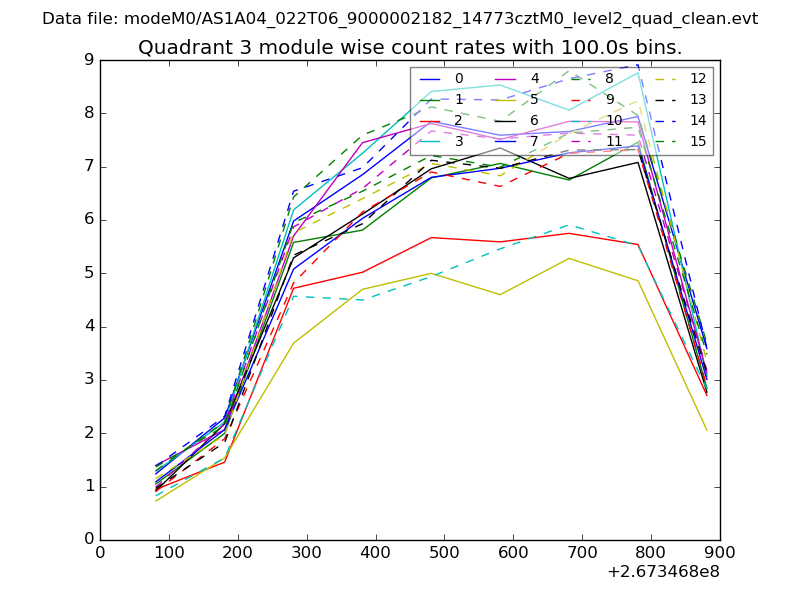
| Module-wise count rates for Quadrant A Data is divided into 100 sec bins |
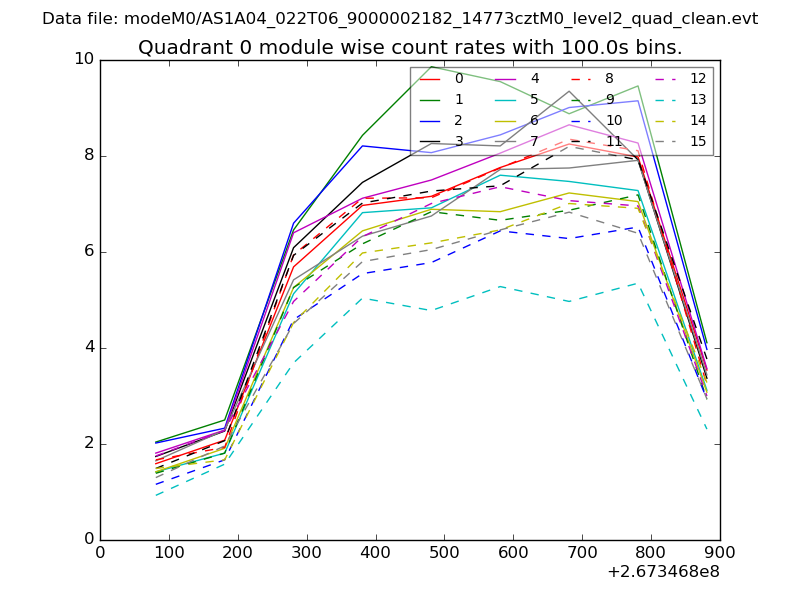 |
 |
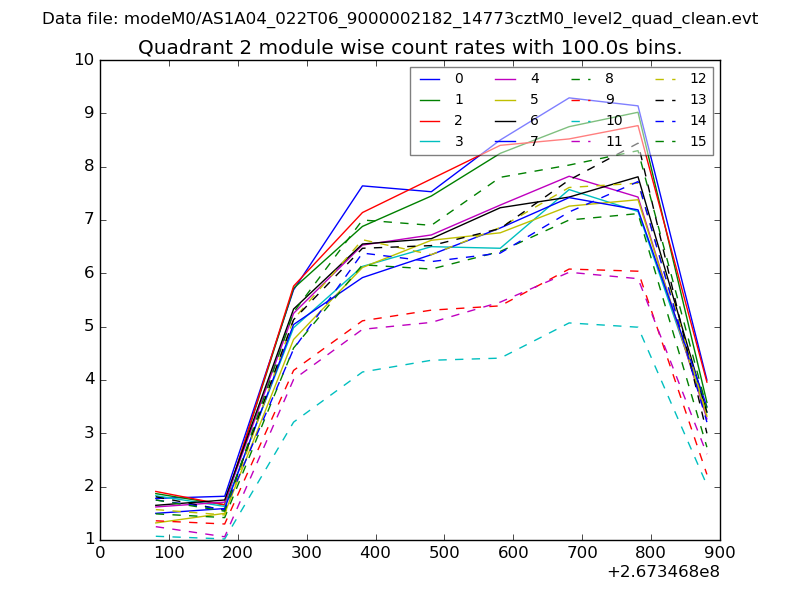
| Module-wise count rates for Quadrant B Data is divided into 100 sec bins |
 |
 |
| Module-wise count rates for Quadrant C Data is divided into 100 sec bins |
 |
 |
| Module-wise count rates for Quadrant D Data is divided into 100 sec bins |
 |
 |
| Parameter | Plot |
|---|---|
| CZT HV Monitor | 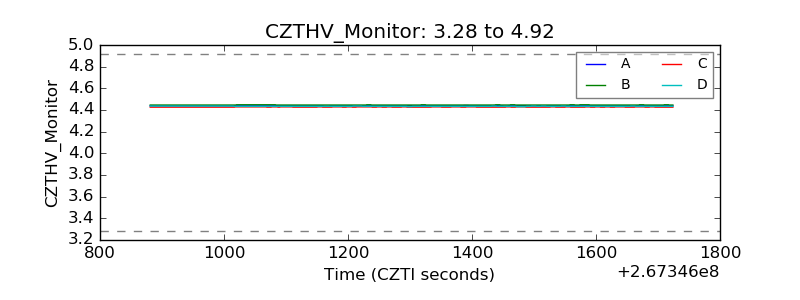 |
| D_VDD | 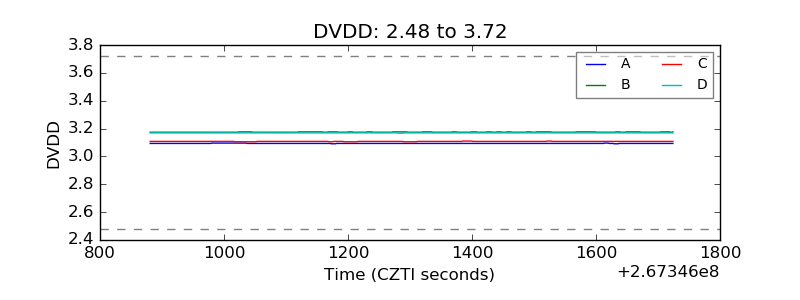 |
| Temperature 1 | 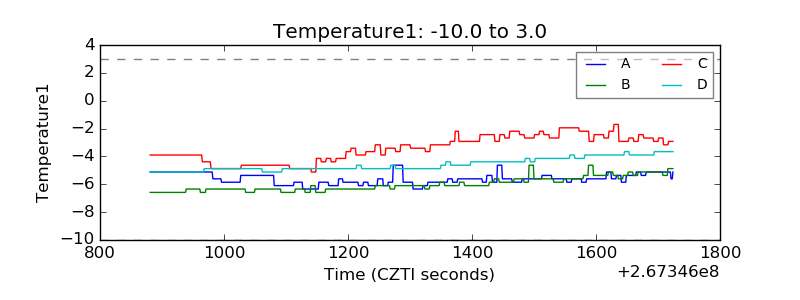 |
| Veto HV Monitor | 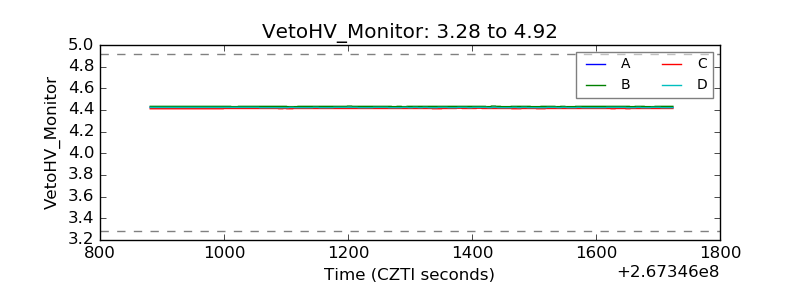 |
| Veto LLD | 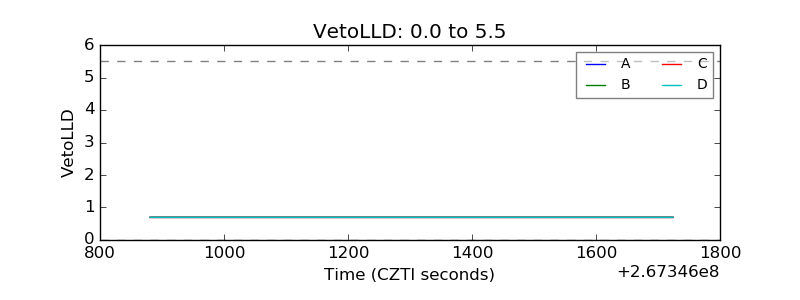 |
| Alpha Counter | 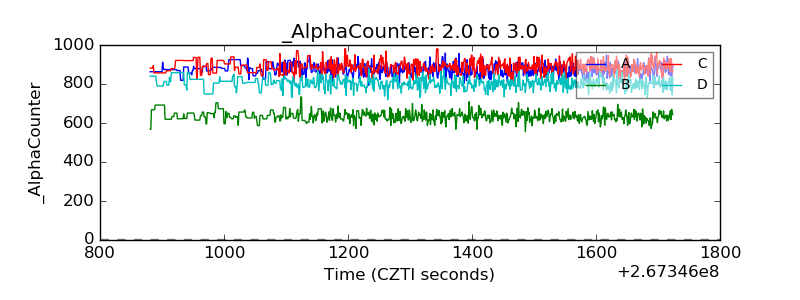 |
| _CPM_Rate | 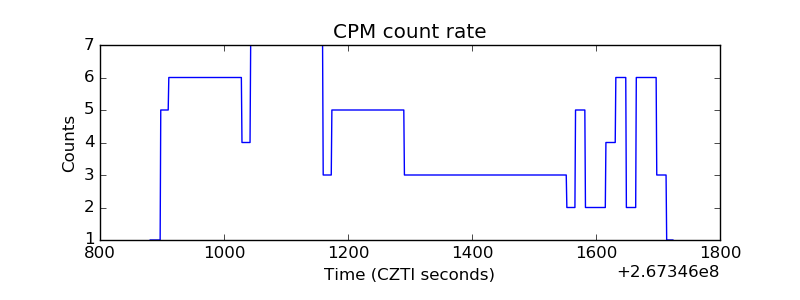 |
| CZT Counter | 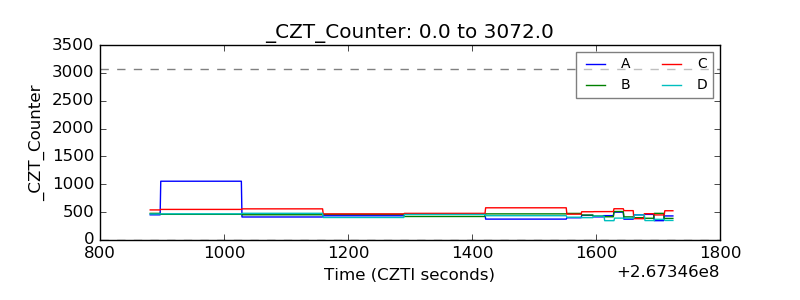 |
| +2.5 Volts monitor | 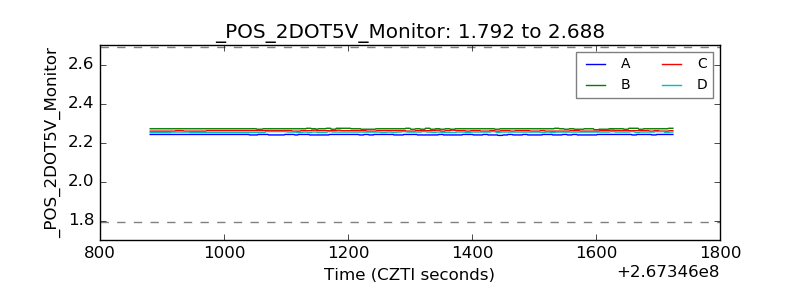 |
| +5 Volts monitor |  |
| _ROLL_ROT | 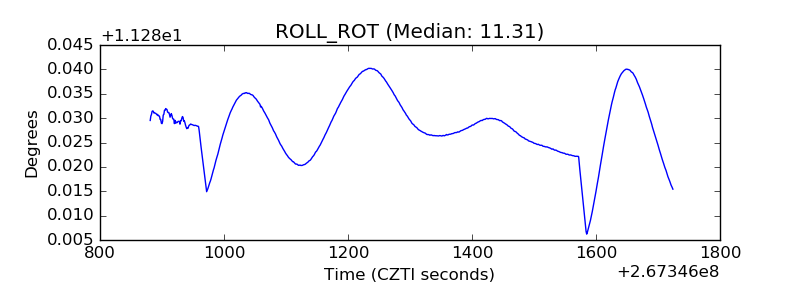 |
| _Roll_DEC | 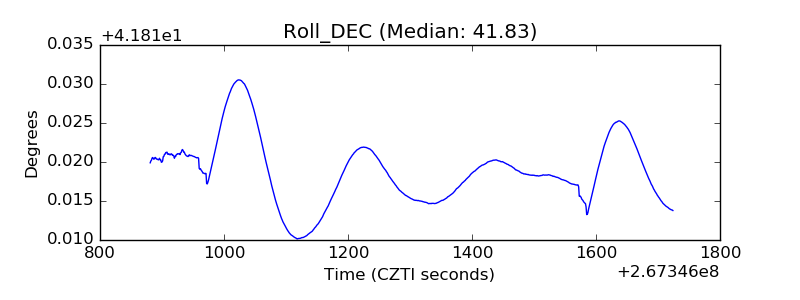 |
| _Roll_RA | 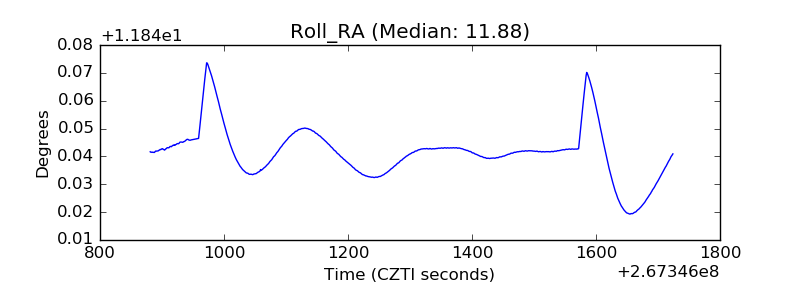 |
| Veto Counter | 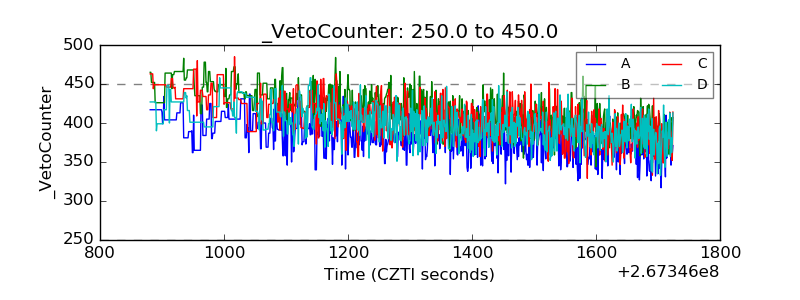 |