| Param | Original file | Final file |
|---|---|---|
| Filename | modeM0/AS1A04_022T06_9000002182_14774cztM0_level2.evt | modeM0/AS1A04_022T06_9000002182_14774cztM0_level2_quad_clean.evt |
| Size (bytes) | 378,063,360 | 69,373,440 |
| Size | 360.5 MB | 66.2 MB |
| Events in quadrant A | 2,534,224 | 443,040 |
| Events in quadrant B | 2,645,586 | 445,133 |
| Events in quadrant C | 2,734,633 | 432,751 |
| Events in quadrant D | 3,179,451 | 414,072 |
| Mode SS | |||
|---|---|---|---|
| Quadrant | BADHDUFLAG | Total packets | Discarded packets |
| A | 0 | 118 | 14 |
| B | 0 | 118 | 12 |
| C | 0 | 118 | 16 |
| D | 0 | 118 | 12 |
| Mode M0 | |||
|---|---|---|---|
| Quadrant | BADHDUFLAG | Total packets | Discarded packets |
| A | 0 | 12221 | 1405 |
| B | 0 | 12706 | 1538 |
| C | 0 | 12518 | 1467 |
| D | 0 | 14865 | 1779 |
| Mode M9 | |||
|---|---|---|---|
| Quadrant | BADHDUFLAG | Total packets | Discarded packets |
| A | 0 | 12 | 0 |
| B | 0 | 12 | 0 |
| C | 0 | 13 | 1 |
| D | 0 | 12 | 2 |
| Quadrant | Total seconds | Saturated seconds | Saturation percentage |
|---|---|---|---|
| A | 5239 | 31 | 0.591716% |
| B | 5218 | 52 | 0.996550% |
| C | 5223 | 23 | 0.440360% |
| D | 5189 | 265 | 5.106957% |
Noise dominated data is calculated using 1-second bins in cleaned event files. If a bin has >2000 counts, and if more than 50% of those come from <1% of pixels, then it is considered to be noise-dominated and hence unusable.
| Quadrant | # 1 sec bins | Bins with >0 counts | Bins with >2000 counts | High rate bins dominated by noise | Noise dominated (total time) | Noise dominated (detector-on time) | Marked lightcurve |
|---|---|---|---|---|---|---|---|
| A | 6899 | 5544 | 0 | 0 | 0.00% | 0.00% | 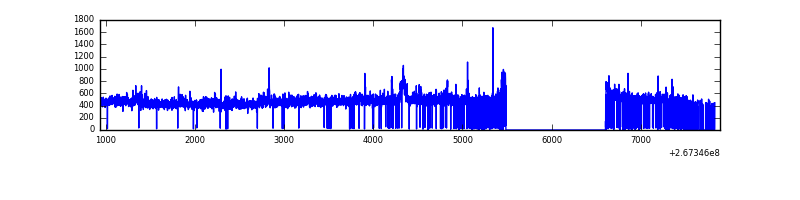 |
| B | 6934 | 5534 | 5 | 5 | 0.07% | 0.09% | 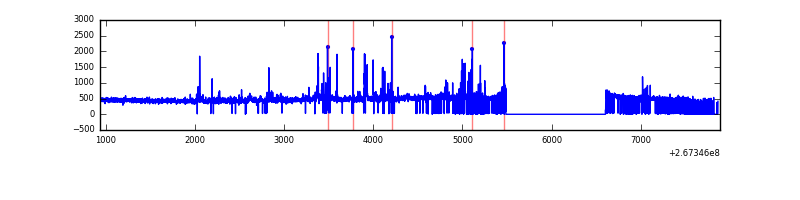 |
| C | 6956 | 5538 | 0 | 0 | 0.00% | 0.00% | 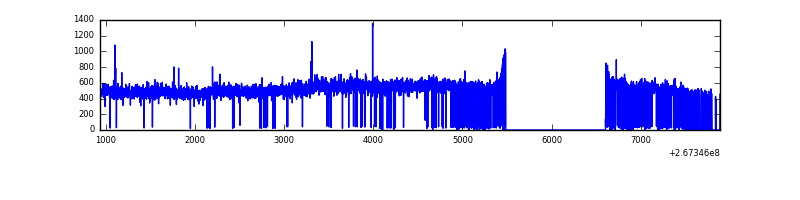 |
| D | 6929 | 5532 | 213 | 213 | 3.07% | 3.85% | 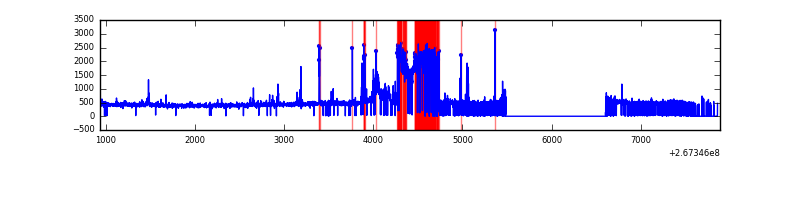 |
Top three noisy pixels from each quadrant. If the there are fewer than three noisy pixels in the level2.evt file, extra rows are filled as -1
| Pixel properties | Quadrant properties | ||||||
|---|---|---|---|---|---|---|---|
| Quadrant | DetID | PixID | Counts | Sigma | Mean | Median | Sigma |
| A | 12 | 189 | 93804 | 730.75 | 631 | 618 | 127.5 |
| A | 9 | 143 | 8583 | 62.46 | 631 | 618 | 127.5 |
| A | 0 | 226 | 5722 | 40.02 | 631 | 618 | 127.5 |
| B | 0 | 228 | 81285 | 674.6 | 623 | 607 | 119.6 |
| B | 0 | 197 | 36963 | 304.0 | 623 | 607 | 119.6 |
| B | 0 | 190 | 23437 | 190.9 | 623 | 607 | 119.6 |
| C | 3 | 233 | 394124 | 2831.64 | 599 | 602 | 139.0 |
| C | 4 | 254 | 4515 | 28.16 | 599 | 602 | 139.0 |
| C | 13 | 61 | 4372 | 27.13 | 599 | 602 | 139.0 |
| D | 5 | 222 | 812599 | 5115.97 | 591 | 576 | 158.7 |
| D | 15 | 0 | 48486 | 301.85 | 591 | 576 | 158.7 |
| D | 10 | 70 | 24107 | 148.25 | 591 | 576 | 158.7 |
Histogram calculated using DETX and DETY for each event in the final _common_clean file
| Quadrant A | 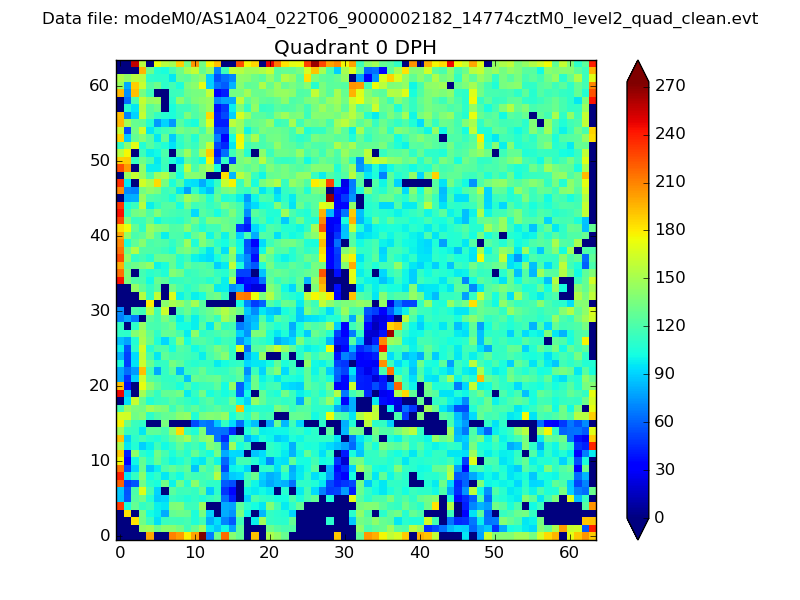 |
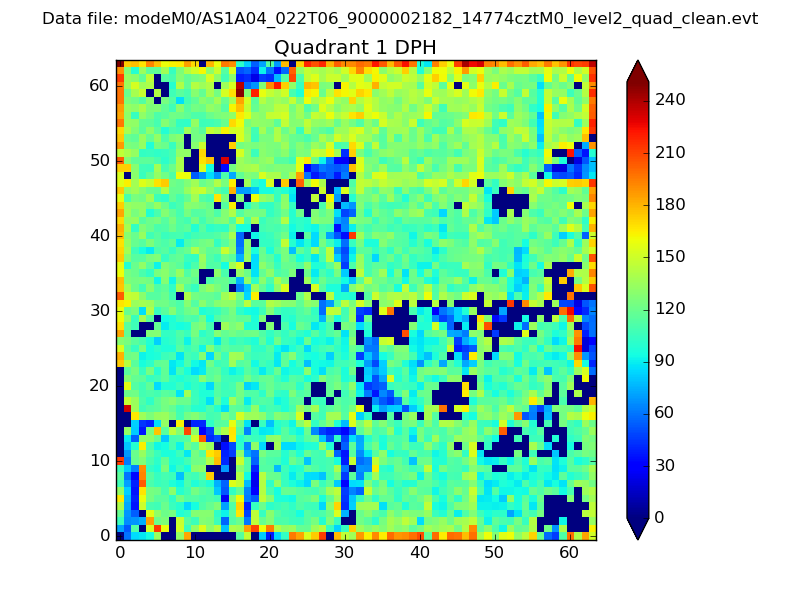 |
Quadrant B |
|---|---|---|---|
| Quadrant D | 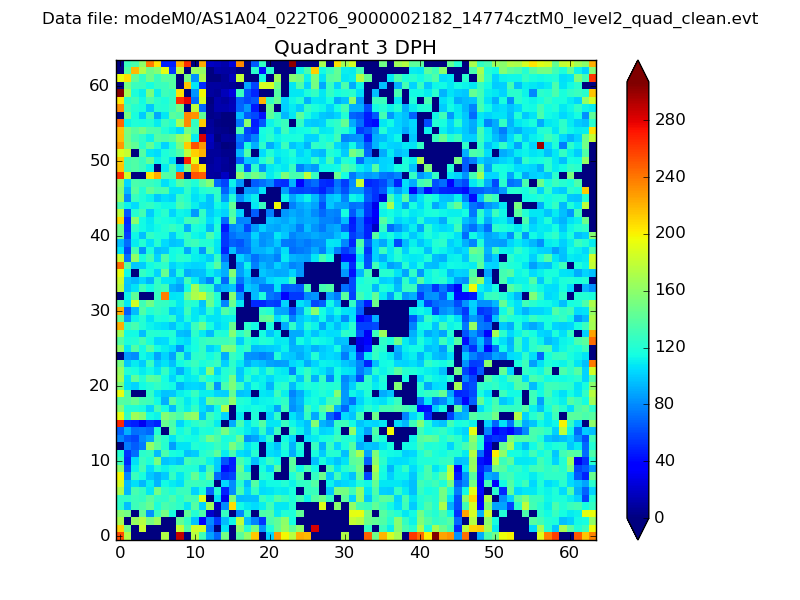 |
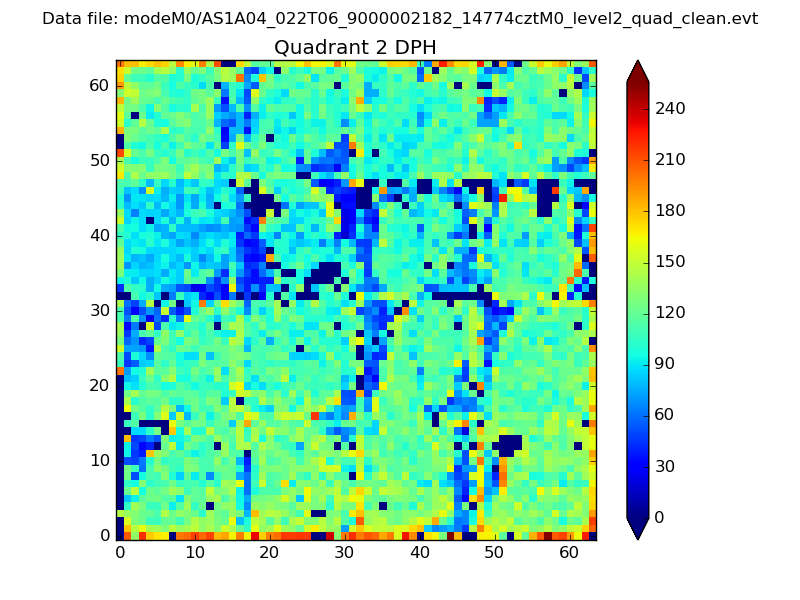 |
Quadrant C |
| Plot type | Count rate plots | Images |
|---|---|---|
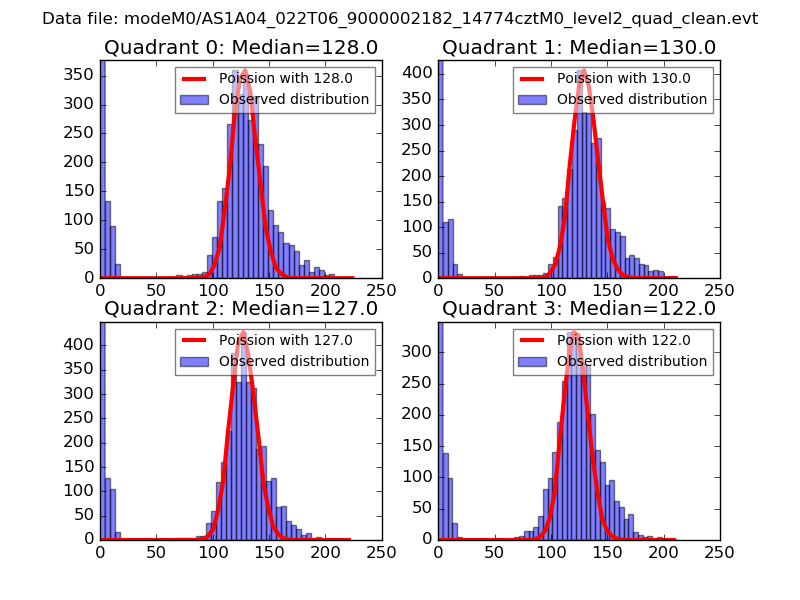
| Comparison with Poisson distribution Blue bars denote a histogram of data divided into 1 sec bins. Red curve is a Poisson curve with rate = median count rate of data. |
 |
 |
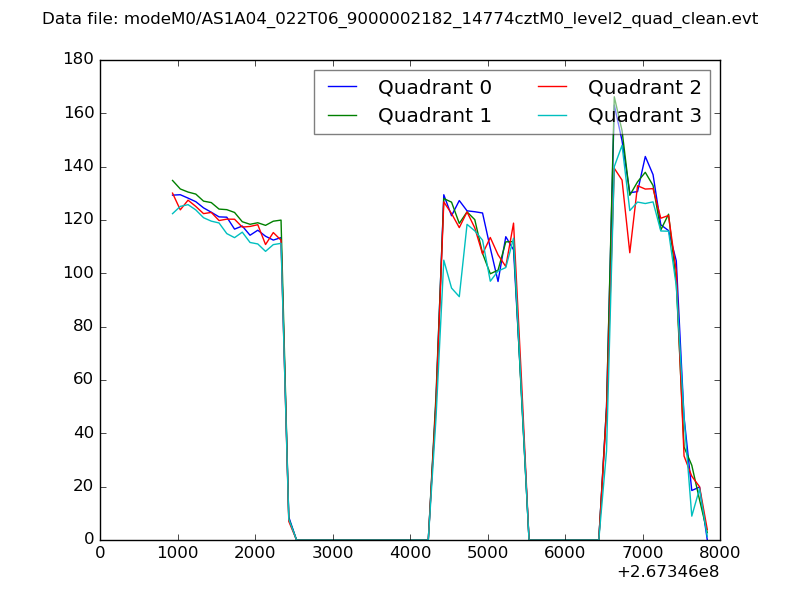
| Quadrant-wise count rates Data is divided into 100 sec bins |
 |
|
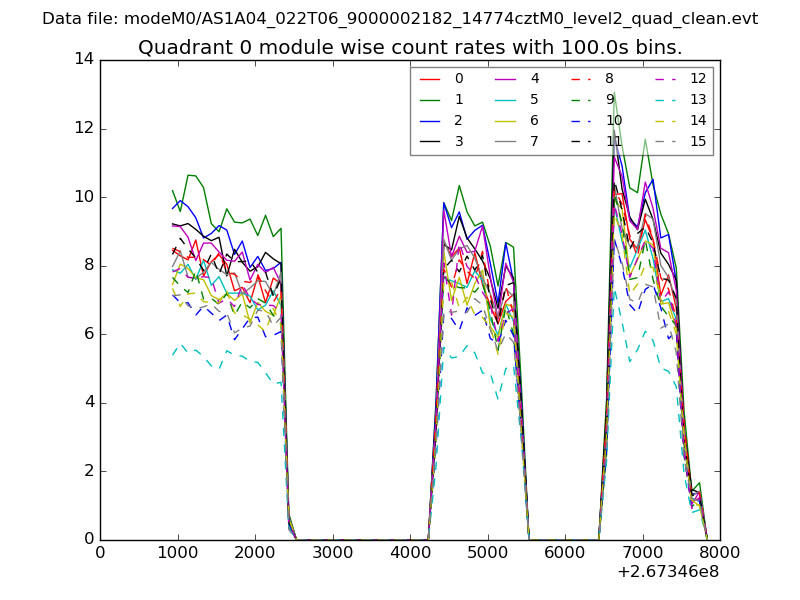
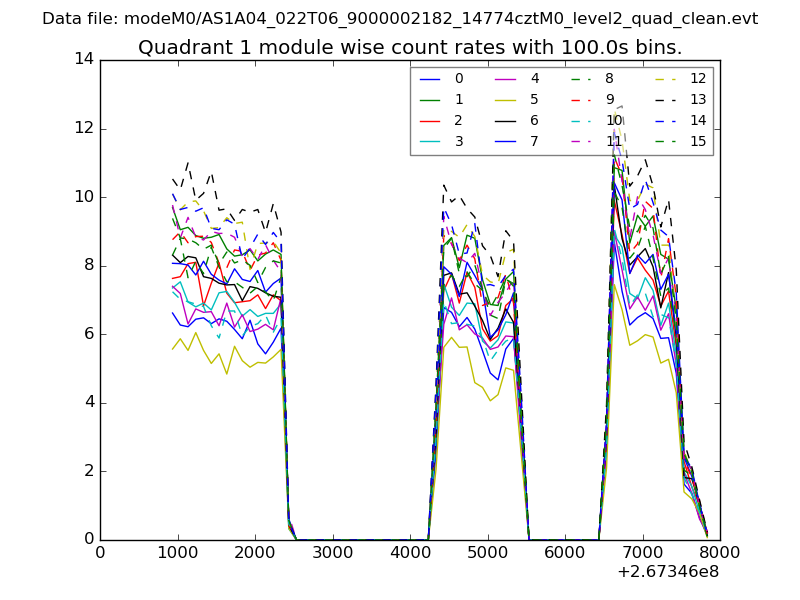
| Module-wise count rates for Quadrant A Data is divided into 100 sec bins |
 |
 |
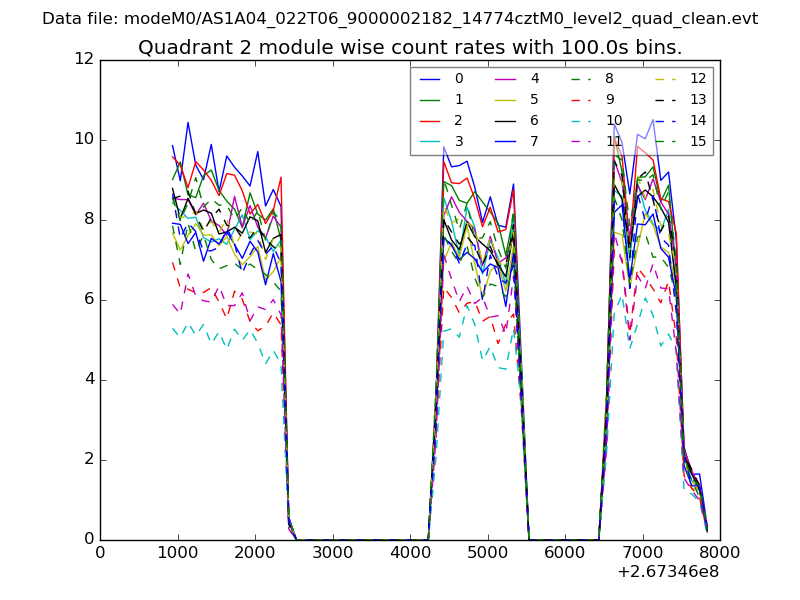
| Module-wise count rates for Quadrant B Data is divided into 100 sec bins |
 |
 |
| Module-wise count rates for Quadrant C Data is divided into 100 sec bins |
 |
 |
| Module-wise count rates for Quadrant D Data is divided into 100 sec bins |
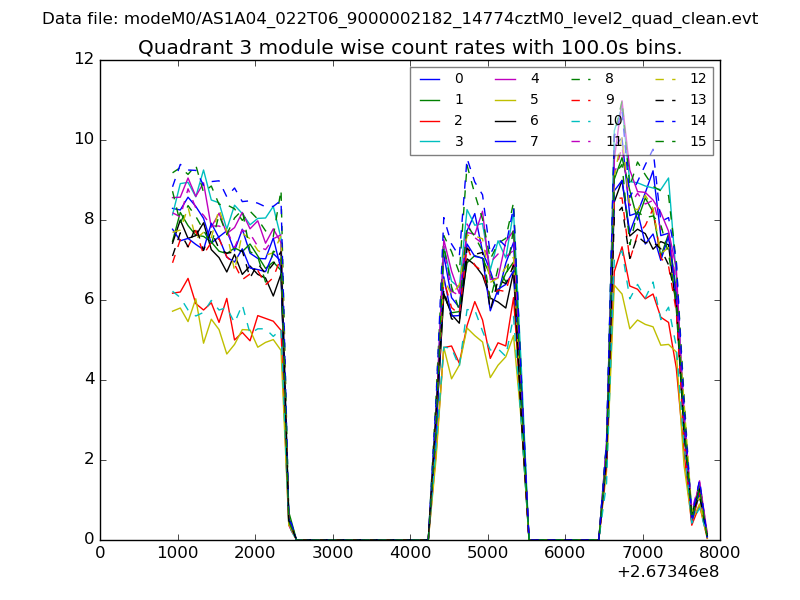 |
 |
| Parameter | Plot |
|---|---|
| CZT HV Monitor | 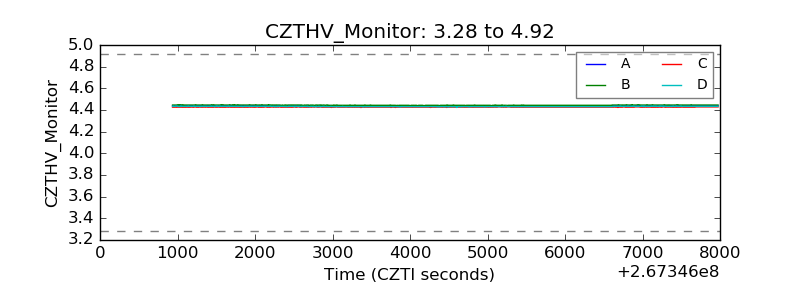 |
| D_VDD | 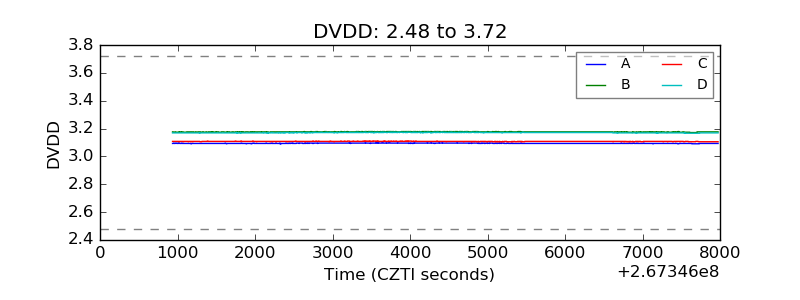 |
| Temperature 1 | 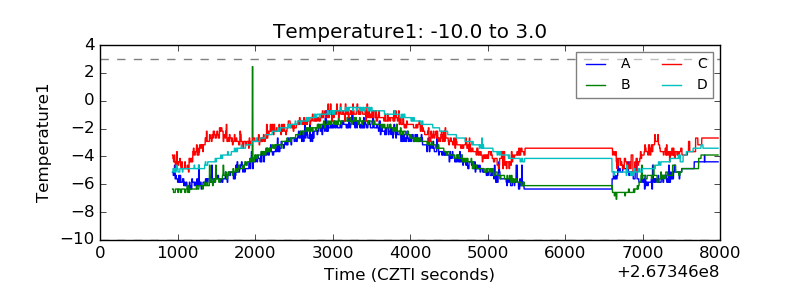 |
| Veto HV Monitor |  |
| Veto LLD | 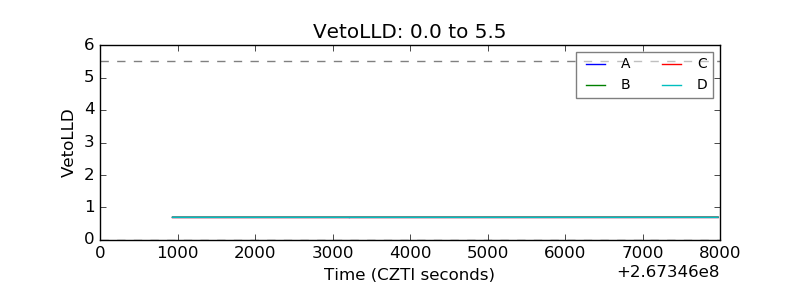 |
| Alpha Counter |  |
| _CPM_Rate | 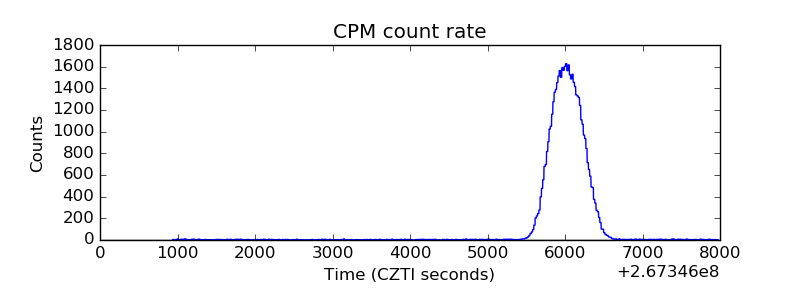 |
| CZT Counter | 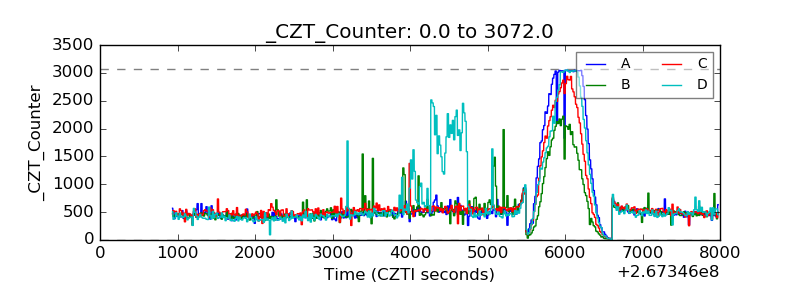 |
| +2.5 Volts monitor | 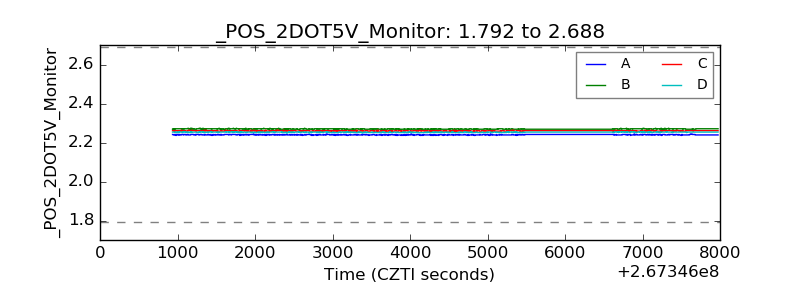 |
| +5 Volts monitor |  |
| _ROLL_ROT | 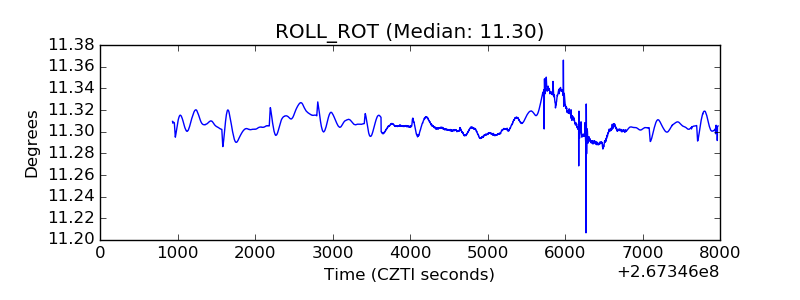 |
| _Roll_DEC | 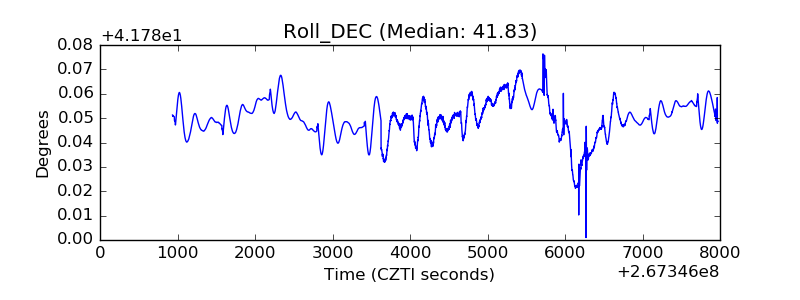 |
| _Roll_RA | 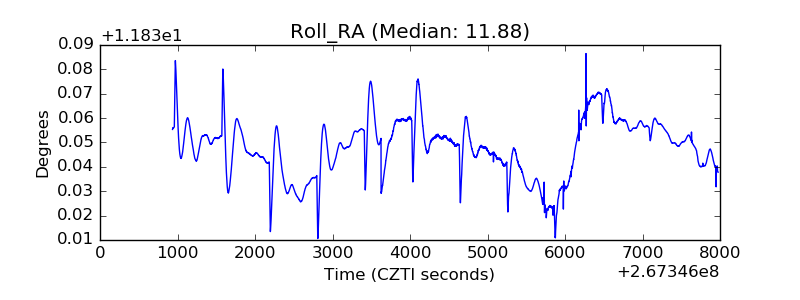 |
| Veto Counter | 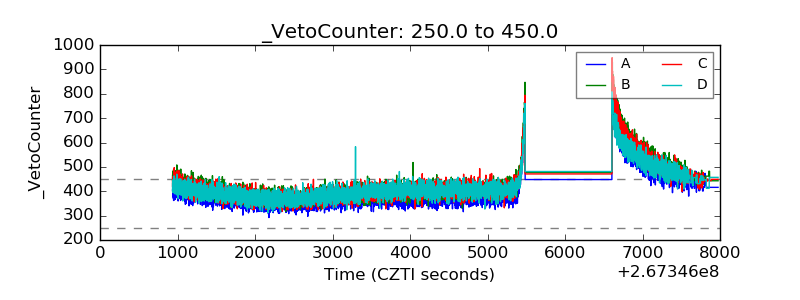 |