| Param | Original file | Final file |
|---|---|---|
| Filename | modeM0/AS1A04_022T06_9000002182_14777cztM0_level2.evt | modeM0/AS1A04_022T06_9000002182_14777cztM0_level2_quad_clean.evt |
| Size (bytes) | 480,000,960 | 88,928,640 |
| Size | 457.8 MB | 84.8 MB |
| Events in quadrant A | 3,192,019 | 579,333 |
| Events in quadrant B | 3,705,554 | 575,045 |
| Events in quadrant C | 3,472,163 | 562,213 |
| Events in quadrant D | 3,753,603 | 550,702 |
| Mode SS | |||
|---|---|---|---|
| Quadrant | BADHDUFLAG | Total packets | Discarded packets |
| A | 0 | 124 | 0 |
| B | 0 | 124 | 0 |
| C | 0 | 124 | 0 |
| D | 0 | 124 | 0 |
| Mode M0 | |||
|---|---|---|---|
| Quadrant | BADHDUFLAG | Total packets | Discarded packets |
| A | 0 | 13028 | 2 |
| B | 0 | 14825 | 1 |
| C | 0 | 13795 | 1 |
| D | 0 | 14849 | 1 |
| Mode M9 | |||
|---|---|---|---|
| Quadrant | BADHDUFLAG | Total packets | Discarded packets |
| A | 0 | 13 | 0 |
| B | 0 | 13 | 0 |
| C | 0 | 13 | 0 |
| D | 0 | 13 | 0 |
| Quadrant | Total seconds | Saturated seconds | Saturation percentage |
|---|---|---|---|
| A | 6096 | 51 | 0.836614% |
| B | 6096 | 90 | 1.476378% |
| C | 6096 | 25 | 0.410105% |
| D | 6096 | 101 | 1.656824% |
Noise dominated data is calculated using 1-second bins in cleaned event files. If a bin has >2000 counts, and if more than 50% of those come from <1% of pixels, then it is considered to be noise-dominated and hence unusable.
| Quadrant | # 1 sec bins | Bins with >0 counts | Bins with >2000 counts | High rate bins dominated by noise | Noise dominated (total time) | Noise dominated (detector-on time) | Marked lightcurve |
|---|---|---|---|---|---|---|---|
| A | 7417 | 6098 | 0 | 0 | 0.00% | 0.00% | 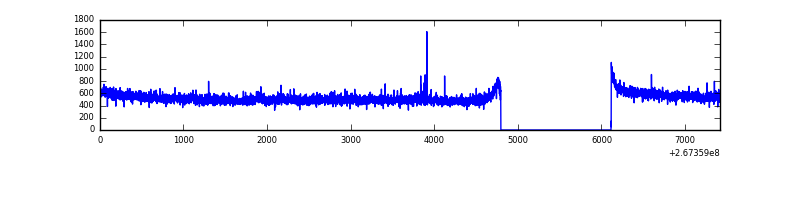 |
| B | 7417 | 6098 | 17 | 17 | 0.23% | 0.28% | 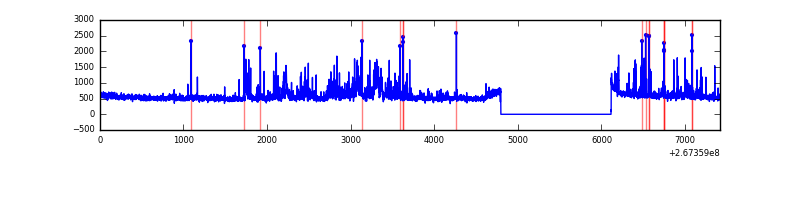 |
| C | 7417 | 6098 | 0 | 0 | 0.00% | 0.00% | 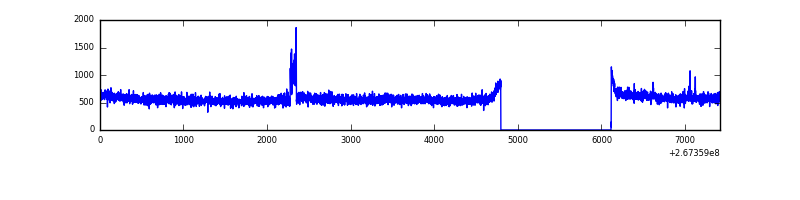 |
| D | 7417 | 6098 | 86 | 86 | 1.16% | 1.41% | 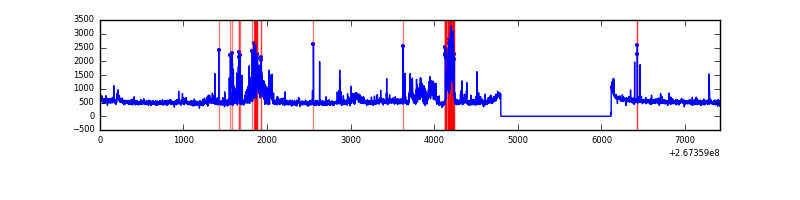 |
Top three noisy pixels from each quadrant. If the there are fewer than three noisy pixels in the level2.evt file, extra rows are filled as -1
| Pixel properties | Quadrant properties | ||||||
|---|---|---|---|---|---|---|---|
| Quadrant | DetID | PixID | Counts | Sigma | Mean | Median | Sigma |
| A | 12 | 189 | 34511 | 205.93 | 818 | 802 | 163.7 |
| A | 11 | 47 | 7548 | 41.21 | 818 | 802 | 163.7 |
| A | 0 | 226 | 7402 | 40.32 | 818 | 802 | 163.7 |
| B | 0 | 219 | 316994 | 2113.32 | 801 | 784 | 149.6 |
| B | 3 | 64 | 89640 | 593.85 | 801 | 784 | 149.6 |
| B | 0 | 229 | 40680 | 266.64 | 801 | 784 | 149.6 |
| C | 3 | 233 | 457472 | 2599.31 | 772 | 779 | 175.7 |
| C | 13 | 61 | 5672 | 27.85 | 772 | 779 | 175.7 |
| C | 0 | 207 | 4425 | 20.75 | 772 | 779 | 175.7 |
| D | 5 | 222 | 650775 | 3223.62 | 780 | 763 | 201.6 |
| D | 2 | 120 | 43757 | 213.22 | 780 | 763 | 201.6 |
| D | 15 | 0 | 28189 | 136.01 | 780 | 763 | 201.6 |
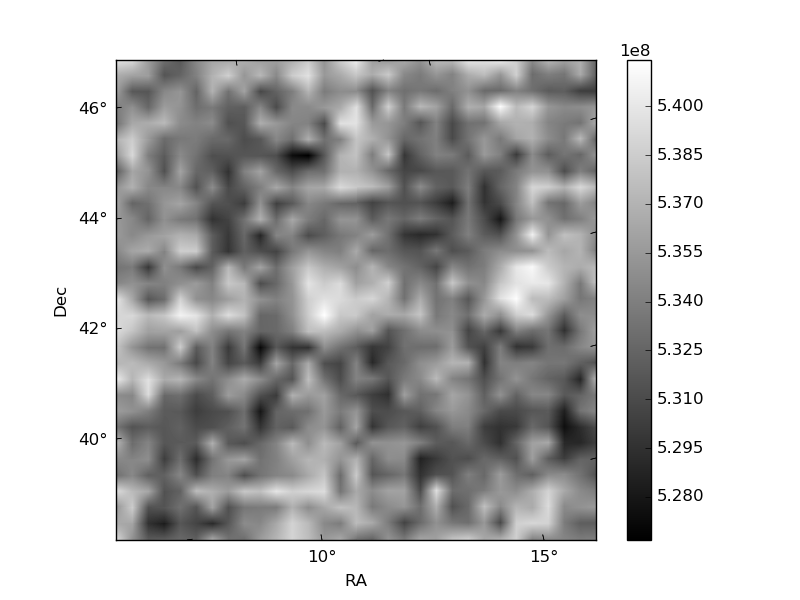
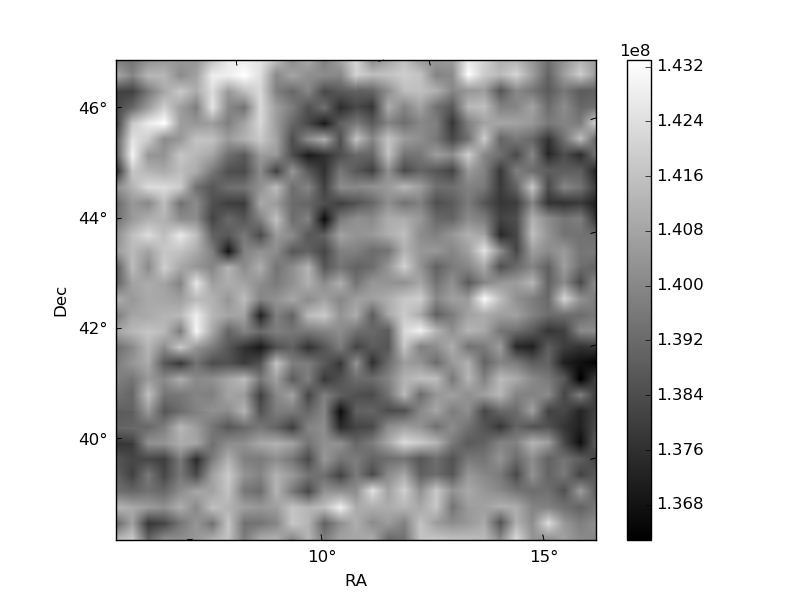
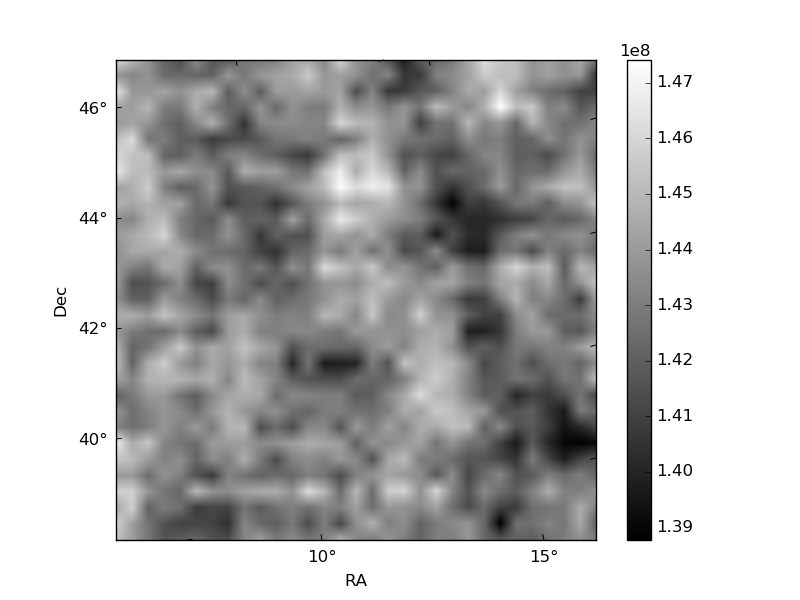
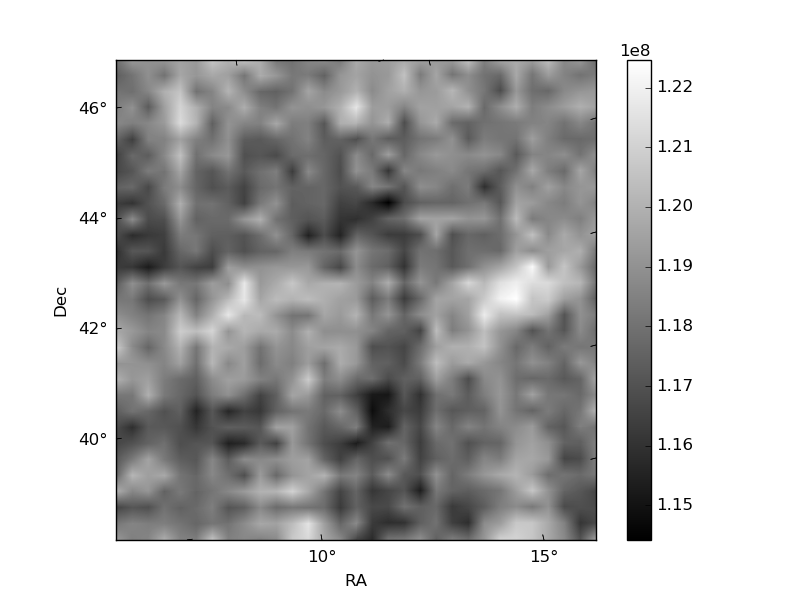
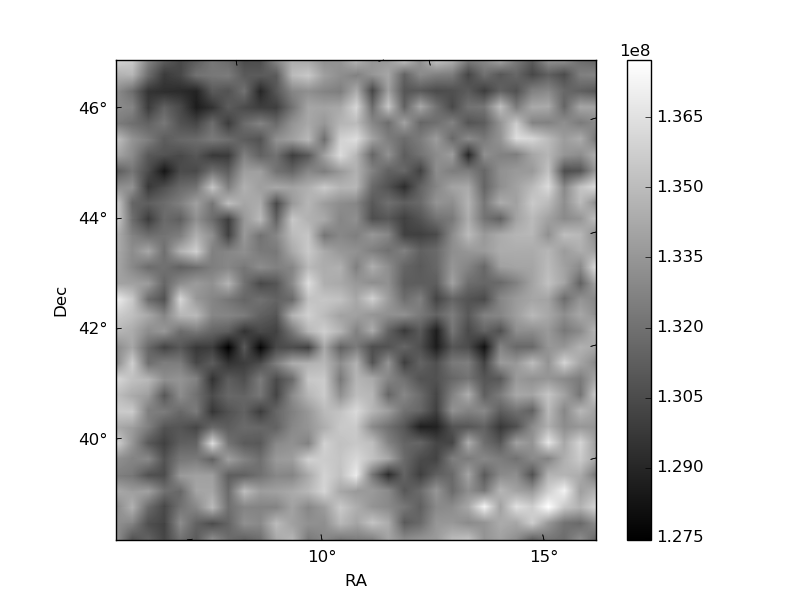
Histogram calculated using DETX and DETY for each event in the final _common_clean file
| Quadrant A | 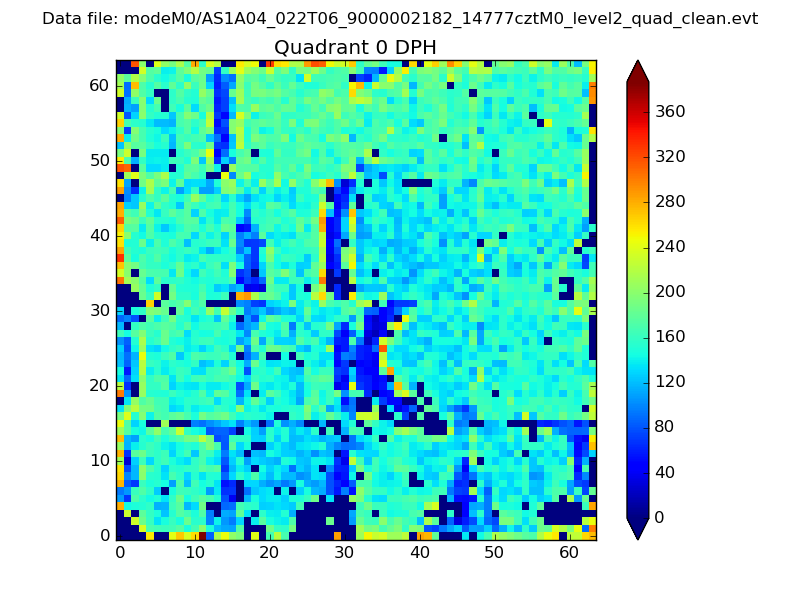 |
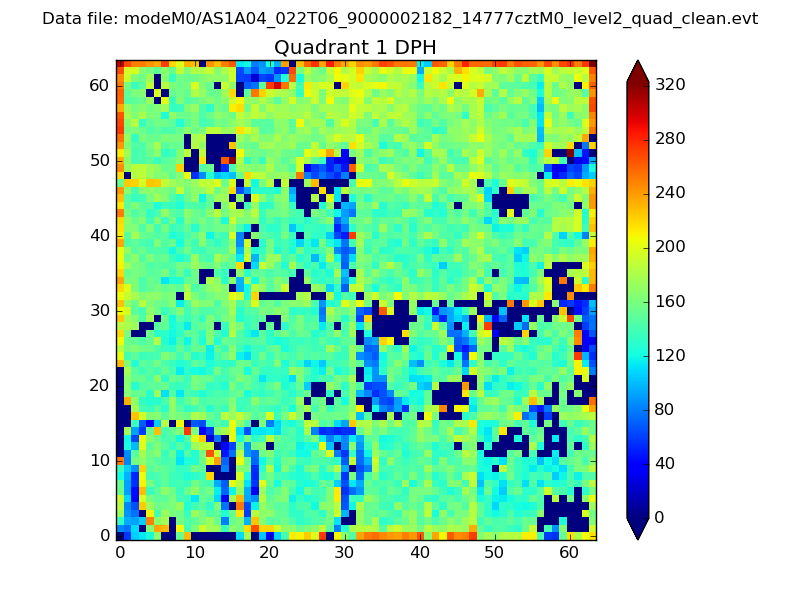 |
Quadrant B |
|---|---|---|---|
| Quadrant D | 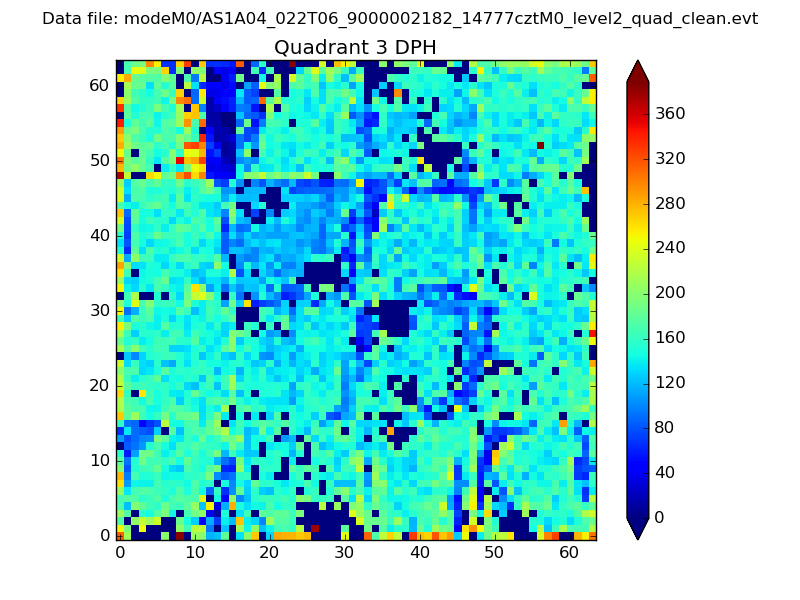 |
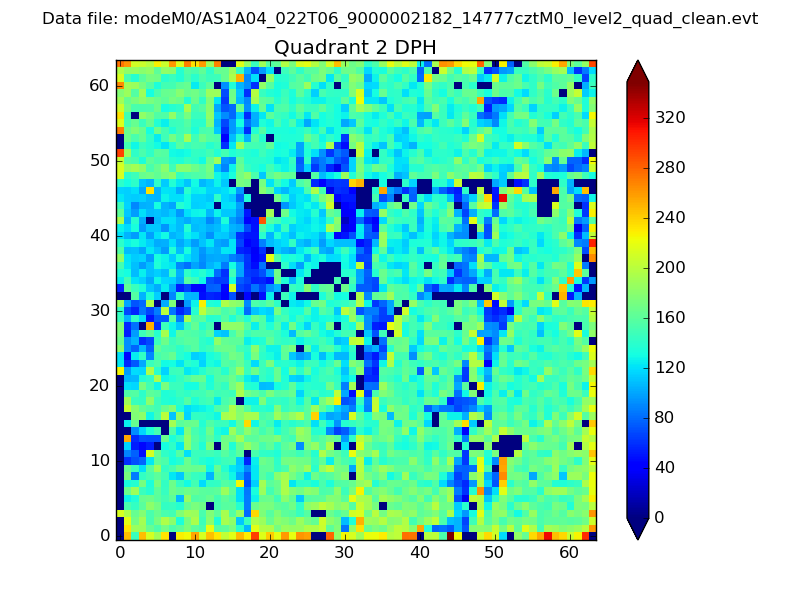 |
Quadrant C |
| Plot type | Count rate plots | Images |
|---|---|---|
| Comparison with Poisson distribution Blue bars denote a histogram of data divided into 1 sec bins. Red curve is a Poisson curve with rate = median count rate of data. |
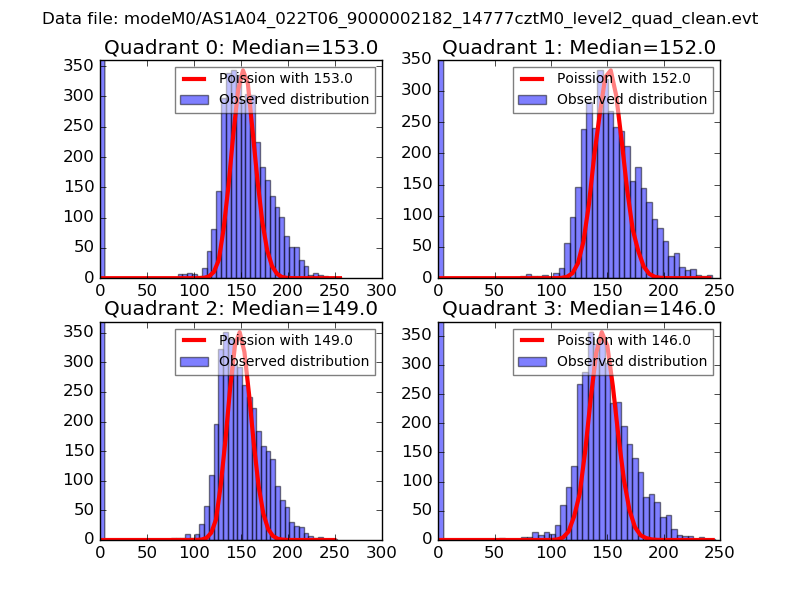 |
 |
| Quadrant-wise count rates Data is divided into 100 sec bins |
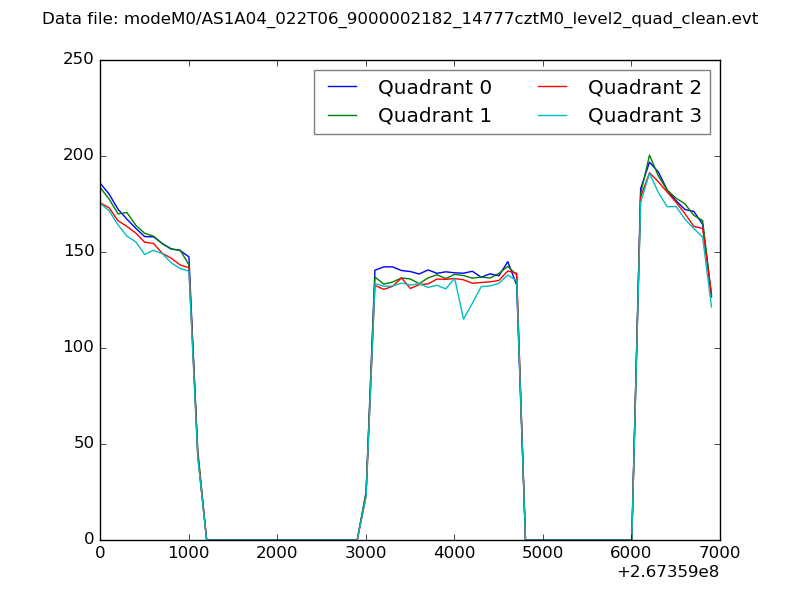 |
|
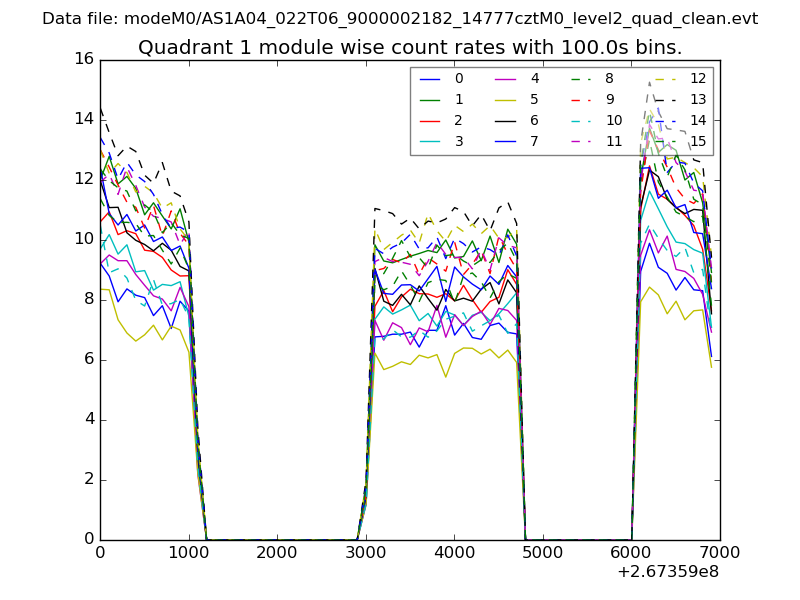
| Module-wise count rates for Quadrant A Data is divided into 100 sec bins |
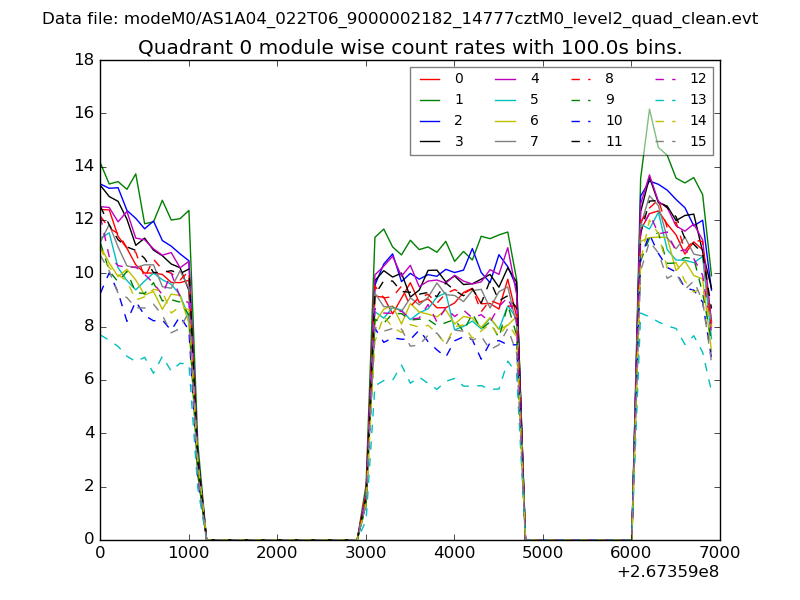 |
 |
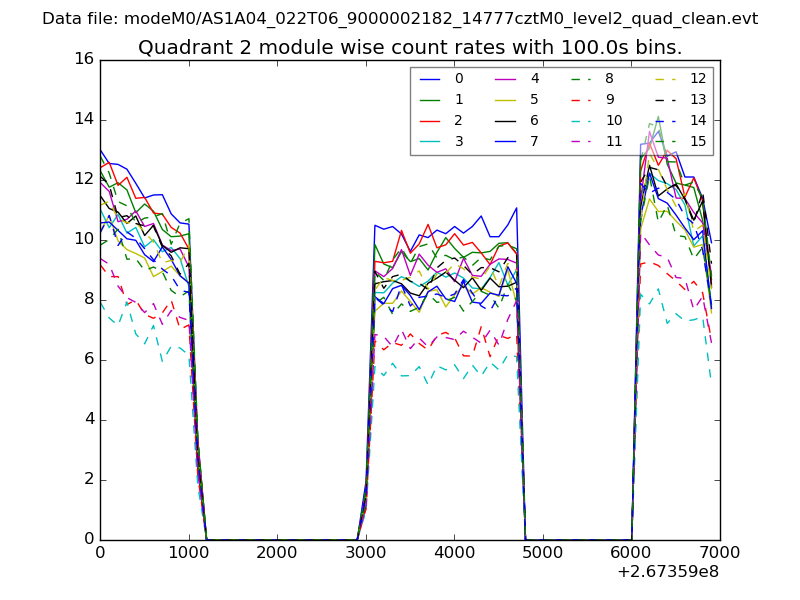
| Module-wise count rates for Quadrant B Data is divided into 100 sec bins |
 |
 |
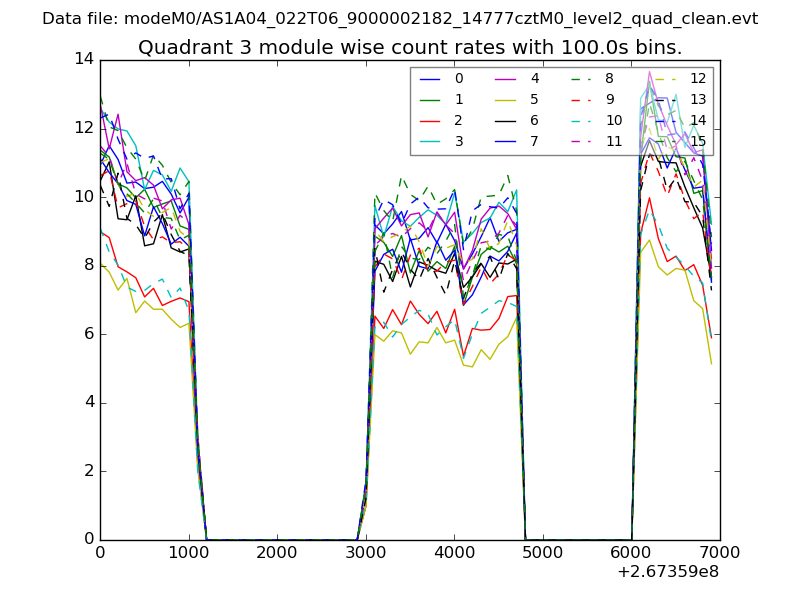
| Module-wise count rates for Quadrant C Data is divided into 100 sec bins |
 |
 |
| Module-wise count rates for Quadrant D Data is divided into 100 sec bins |
 |
 |
| Parameter | Plot |
|---|---|
| CZT HV Monitor | 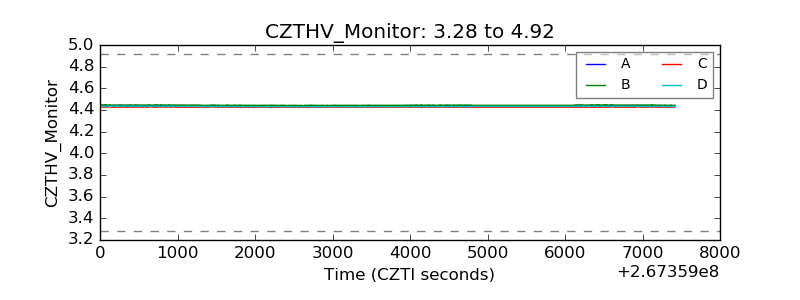 |
| D_VDD | 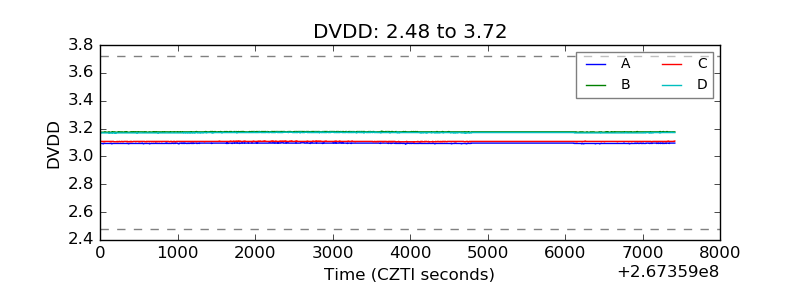 |
| Temperature 1 | 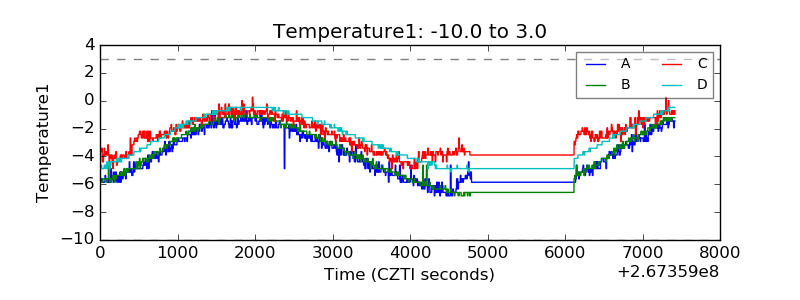 |
| Veto HV Monitor | 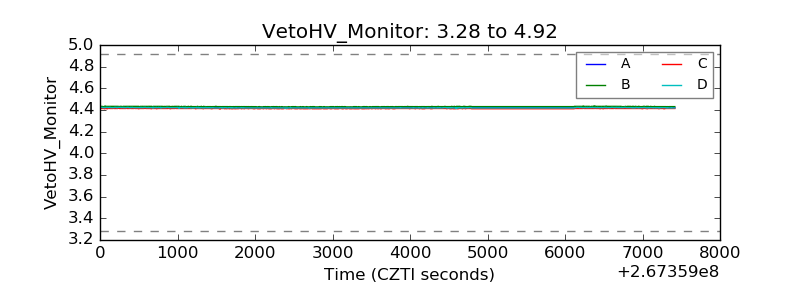 |
| Veto LLD | 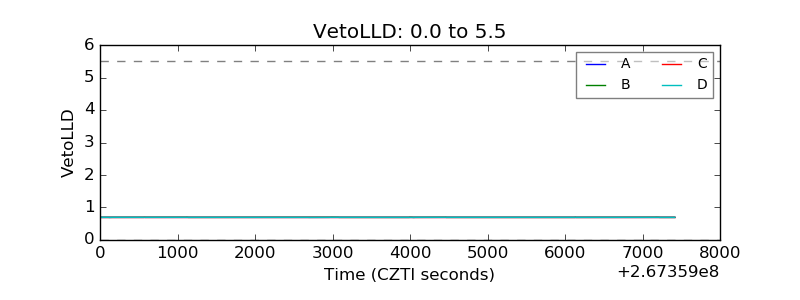 |
| Alpha Counter | 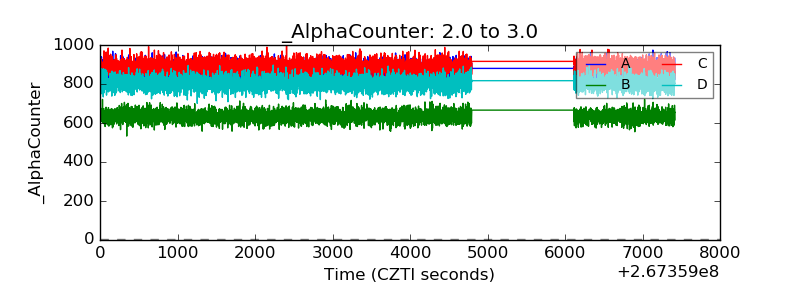 |
| _CPM_Rate | 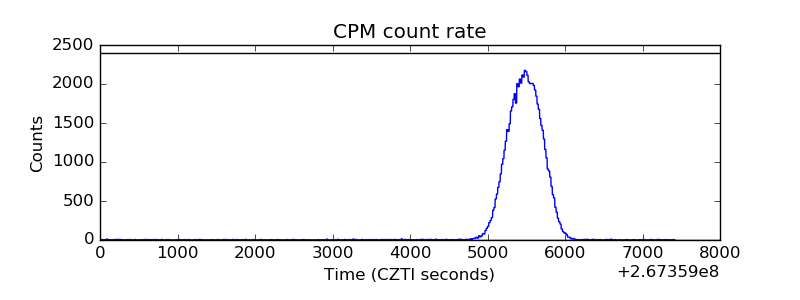 |
| CZT Counter | 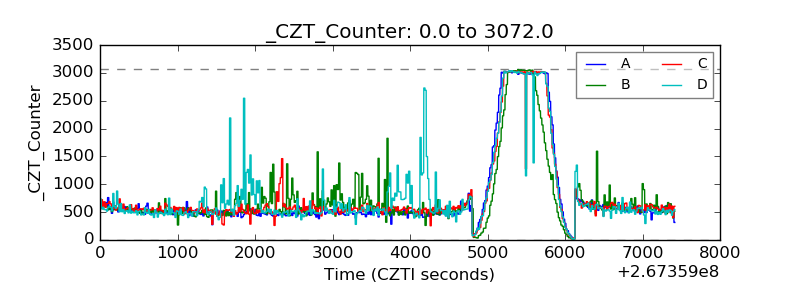 |
| +2.5 Volts monitor |  |
| +5 Volts monitor |  |
| _ROLL_ROT | 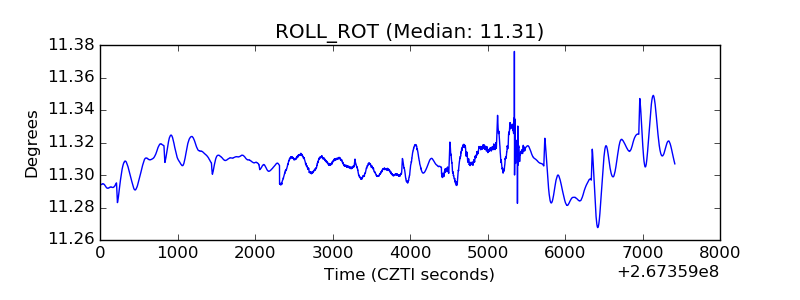 |
| _Roll_DEC | 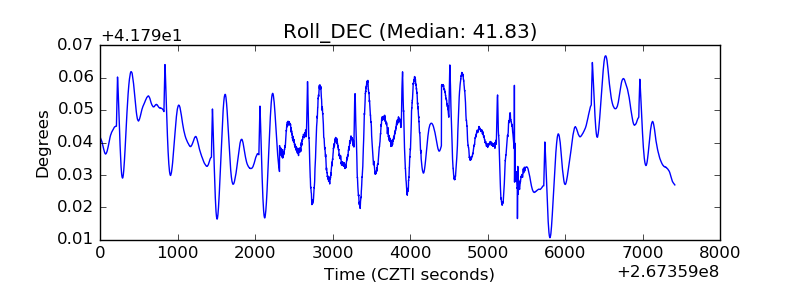 |
| _Roll_RA | 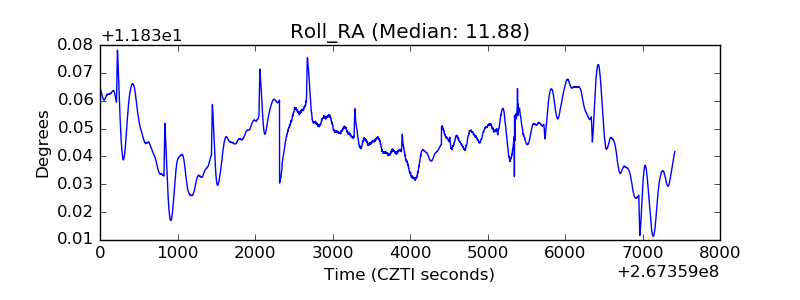 |
| Veto Counter | 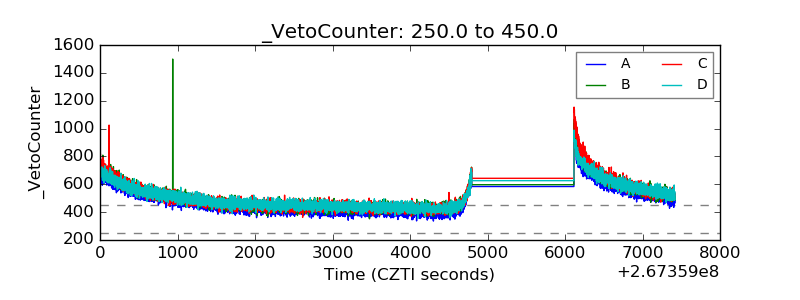 |