| Param | Original file | Final file |
|---|---|---|
| Filename | modeM0/AS1A04_022T06_9000002182_14779cztM0_level2.evt | modeM0/AS1A04_022T06_9000002182_14779cztM0_level2_quad_clean.evt |
| Size (bytes) | 477,475,200 | 63,054,720 |
| Size | 455.4 MB | 60.1 MB |
| Events in quadrant A | 3,234,654 | 377,495 |
| Events in quadrant B | 4,105,872 | 371,176 |
| Events in quadrant C | 3,384,697 | 370,209 |
| Events in quadrant D | 3,321,118 | 364,065 |
| Mode SS | |||
|---|---|---|---|
| Quadrant | BADHDUFLAG | Total packets | Discarded packets |
| A | 0 | 124 | 0 |
| B | 0 | 124 | 0 |
| C | 0 | 124 | 0 |
| D | 0 | 124 | 0 |
| Mode M0 | |||
|---|---|---|---|
| Quadrant | BADHDUFLAG | Total packets | Discarded packets |
| A | 0 | 13118 | 3 |
| B | 0 | 16416 | 2 |
| C | 0 | 13508 | 2 |
| D | 0 | 13569 | 2 |
| Mode M9 | |||
|---|---|---|---|
| Quadrant | BADHDUFLAG | Total packets | Discarded packets |
| A | 0 | 13 | 0 |
| B | 0 | 13 | 0 |
| C | 0 | 13 | 0 |
| D | 0 | 13 | 0 |
| Quadrant | Total seconds | Saturated seconds | Saturation percentage |
|---|---|---|---|
| A | 6102 | 115 | 1.884628% |
| B | 6102 | 166 | 2.720420% |
| C | 6102 | 87 | 1.425762% |
| D | 6102 | 121 | 1.982956% |
Noise dominated data is calculated using 1-second bins in cleaned event files. If a bin has >2000 counts, and if more than 50% of those come from <1% of pixels, then it is considered to be noise-dominated and hence unusable.
| Quadrant | # 1 sec bins | Bins with >0 counts | Bins with >2000 counts | High rate bins dominated by noise | Noise dominated (total time) | Noise dominated (detector-on time) | Marked lightcurve |
|---|---|---|---|---|---|---|---|
| A | 7393 | 6105 | 2 | 2 | 0.03% | 0.03% | 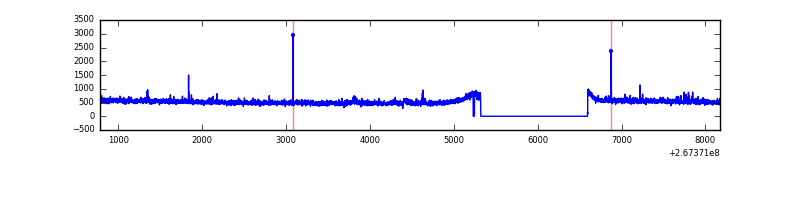 |
| B | 7393 | 6105 | 24 | 24 | 0.32% | 0.39% |  |
| C | 7393 | 6105 | 0 | 0 | 0.00% | 0.00% | 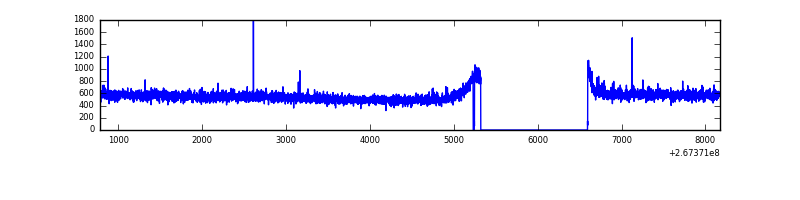 |
| D | 7393 | 6105 | 27 | 27 | 0.37% | 0.44% | 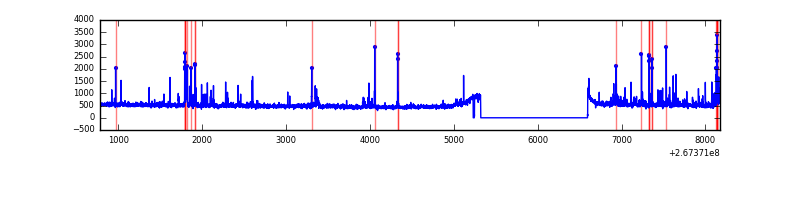 |
Top three noisy pixels from each quadrant. If the there are fewer than three noisy pixels in the level2.evt file, extra rows are filled as -1
| Pixel properties | Quadrant properties | ||||||
|---|---|---|---|---|---|---|---|
| Quadrant | DetID | PixID | Counts | Sigma | Mean | Median | Sigma |
| A | 12 | 189 | 73805 | 443.68 | 815 | 799 | 164.5 |
| A | 9 | 143 | 12446 | 70.78 | 815 | 799 | 164.5 |
| A | 3 | 1 | 8735 | 48.23 | 815 | 799 | 164.5 |
| B | 0 | 219 | 502938 | 3383.95 | 802 | 784 | 148.4 |
| B | 3 | 64 | 294091 | 1976.56 | 802 | 784 | 148.4 |
| B | 0 | 229 | 55829 | 370.94 | 802 | 784 | 148.4 |
| C | 3 | 233 | 324709 | 1831.7 | 782 | 788 | 176.8 |
| C | 0 | 207 | 11720 | 61.82 | 782 | 788 | 176.8 |
| C | 13 | 61 | 5718 | 27.88 | 782 | 788 | 176.8 |
| D | 12 | 233 | 119286 | 577.85 | 784 | 768 | 205.1 |
| D | 5 | 222 | 101879 | 492.98 | 784 | 768 | 205.1 |
| D | 2 | 120 | 37811 | 180.61 | 784 | 768 | 205.1 |
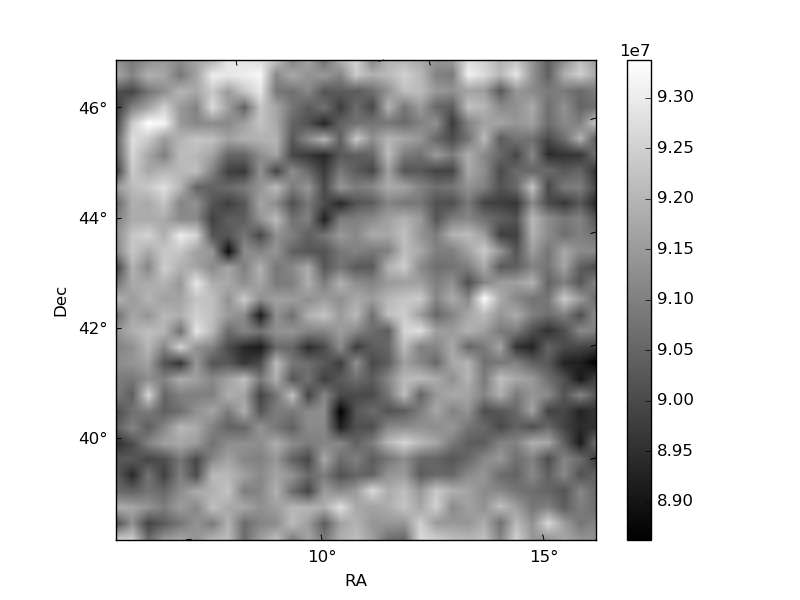
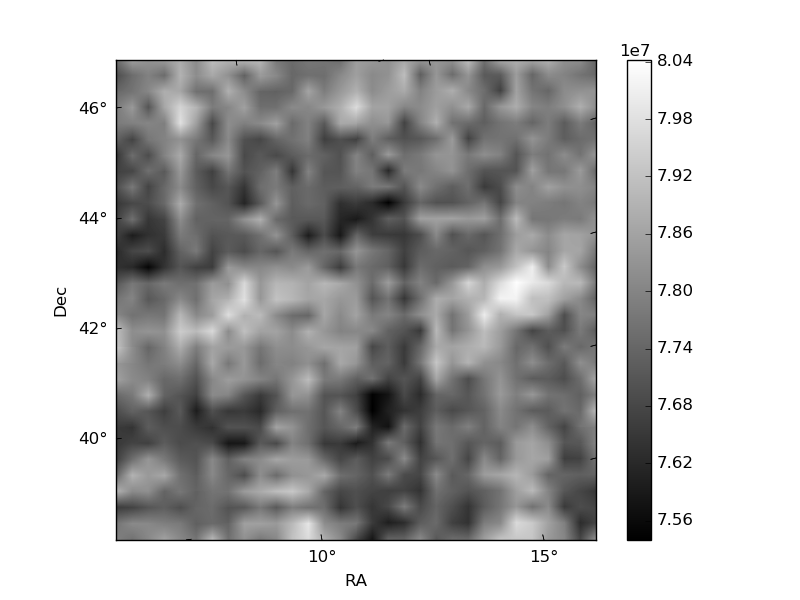
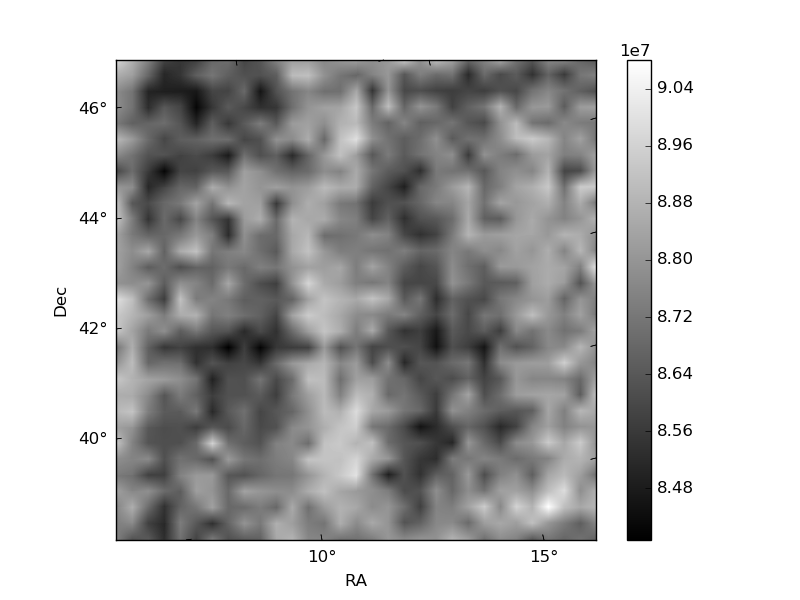
Histogram calculated using DETX and DETY for each event in the final _common_clean file
| Quadrant A |  |
 |
Quadrant B |
|---|---|---|---|
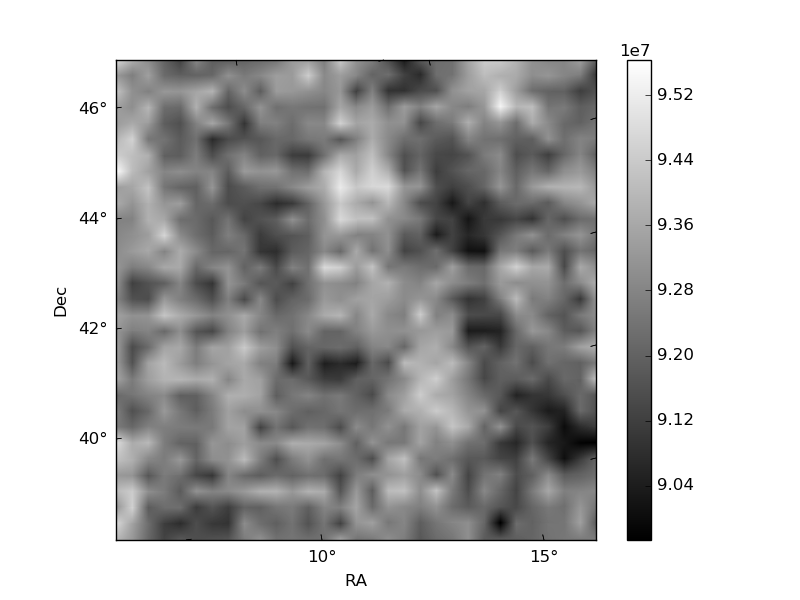
| Quadrant D | 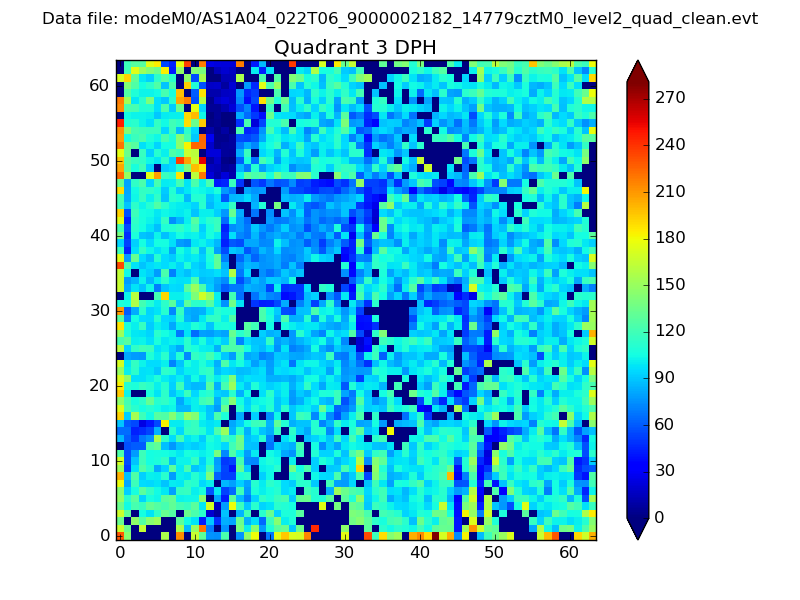 |
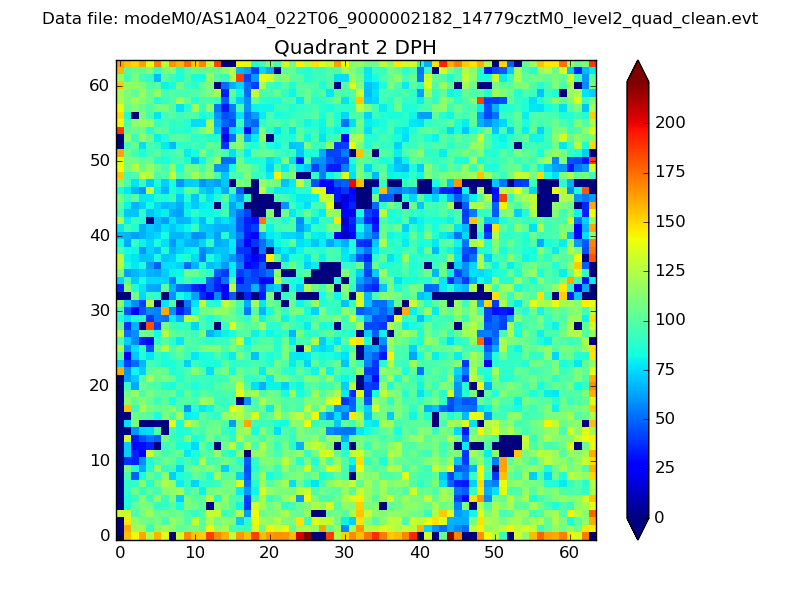 |
Quadrant C |
| Plot type | Count rate plots | Images |
|---|---|---|
| Comparison with Poisson distribution Blue bars denote a histogram of data divided into 1 sec bins. Red curve is a Poisson curve with rate = median count rate of data. |
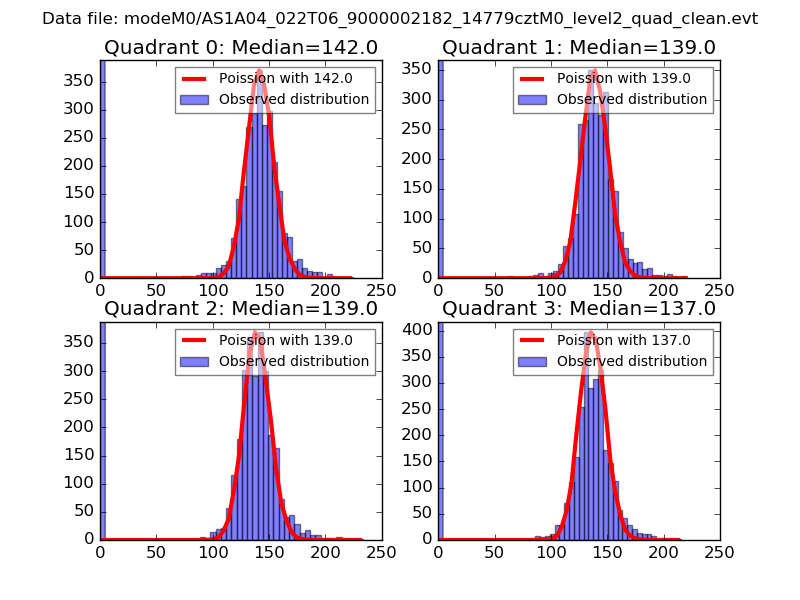 |
 |
| Quadrant-wise count rates Data is divided into 100 sec bins |
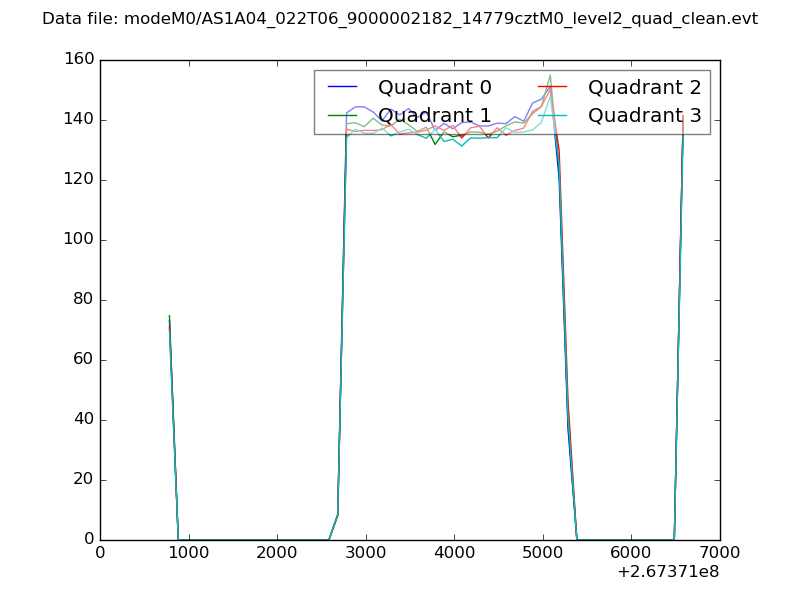 |
|
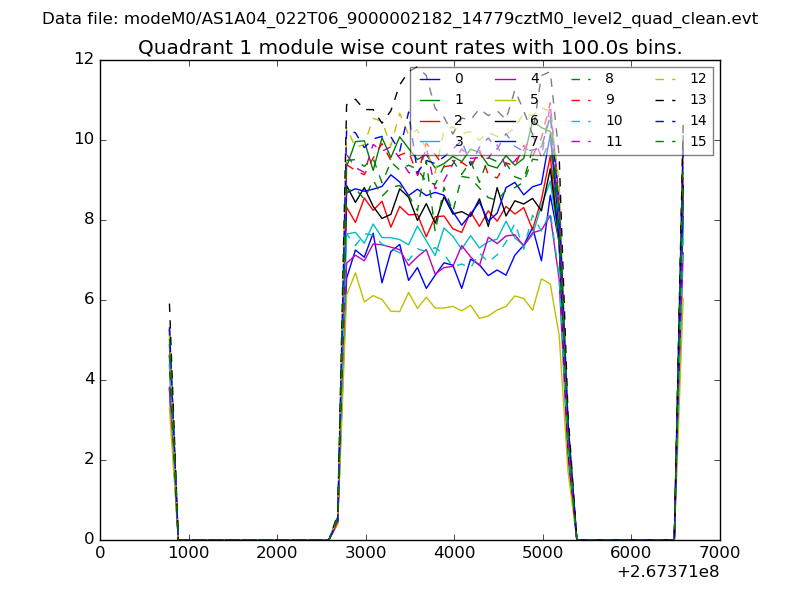
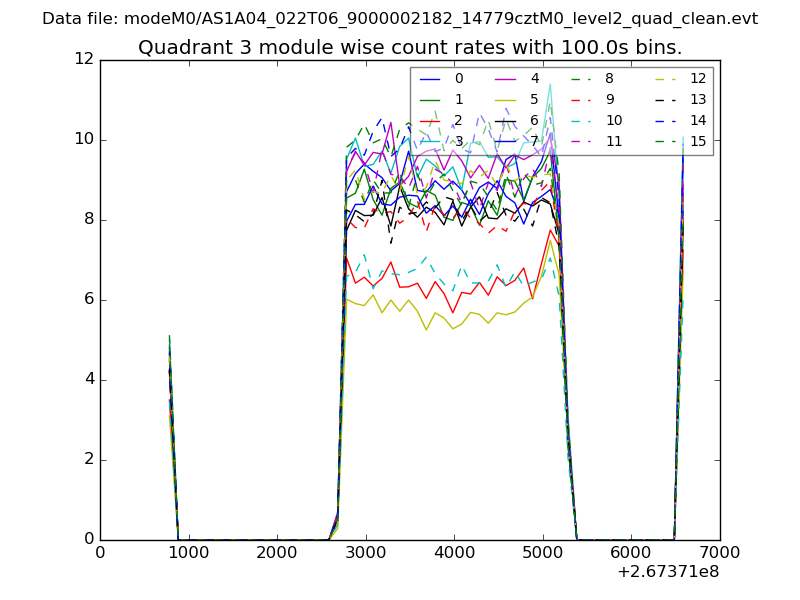
| Module-wise count rates for Quadrant A Data is divided into 100 sec bins |
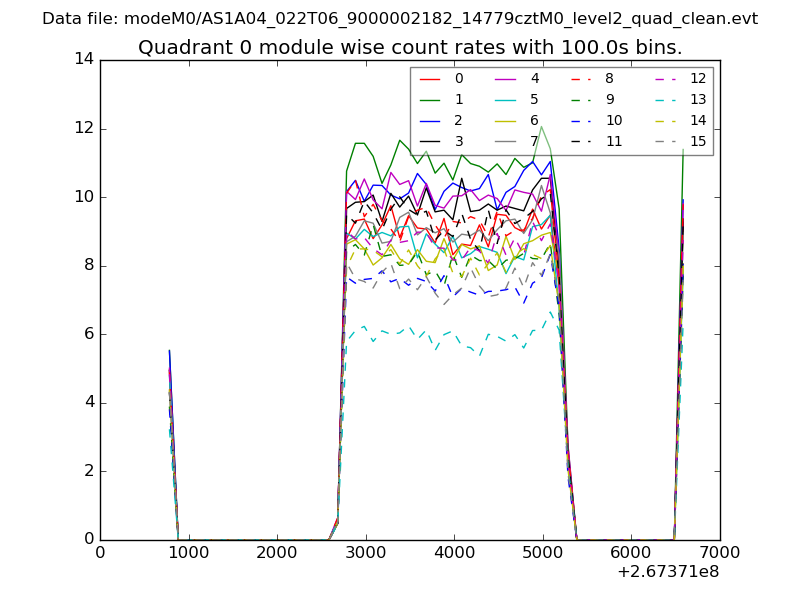 |
 |
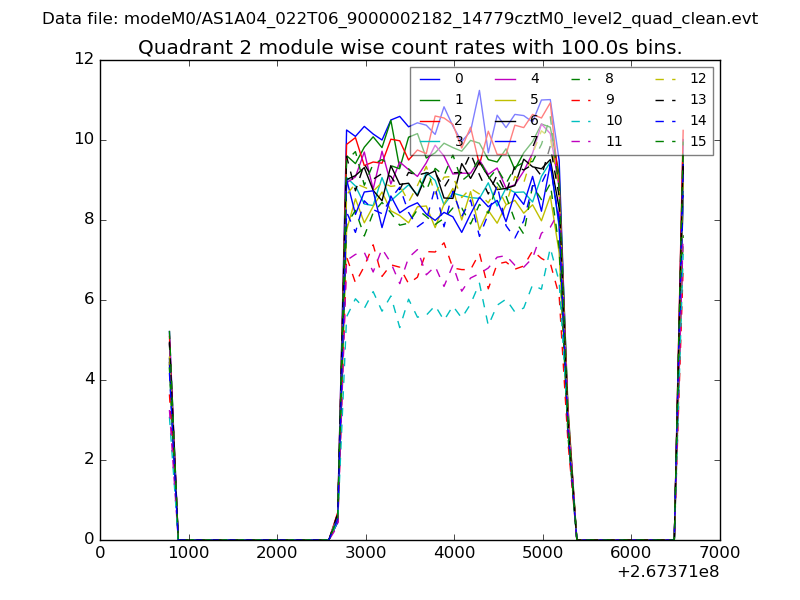
| Module-wise count rates for Quadrant B Data is divided into 100 sec bins |
 |
 |
| Module-wise count rates for Quadrant C Data is divided into 100 sec bins |
 |
 |
| Module-wise count rates for Quadrant D Data is divided into 100 sec bins |
 |
 |
| Parameter | Plot |
|---|---|
| CZT HV Monitor | 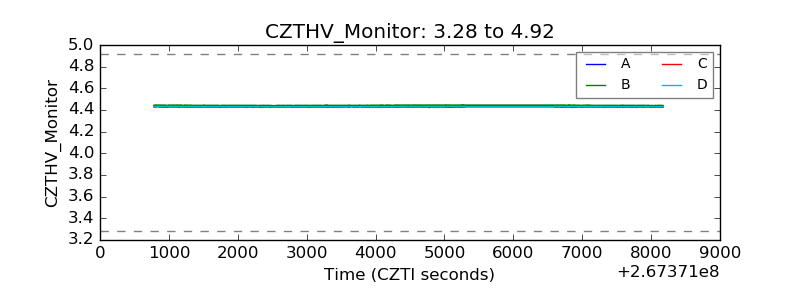 |
| D_VDD | 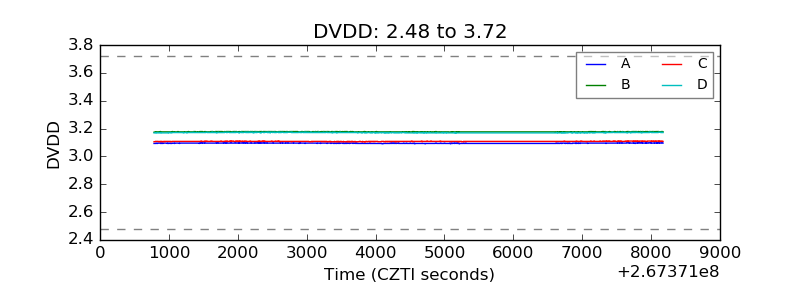 |
| Temperature 1 | 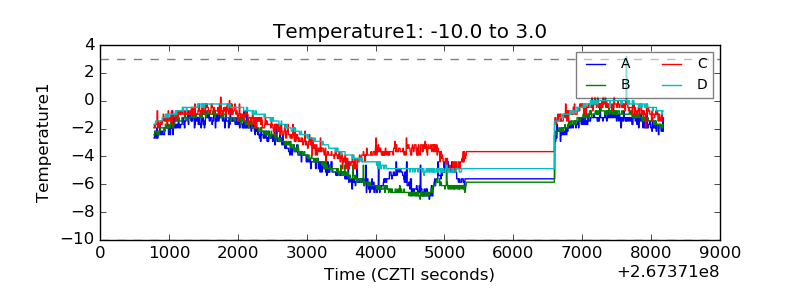 |
| Veto HV Monitor | 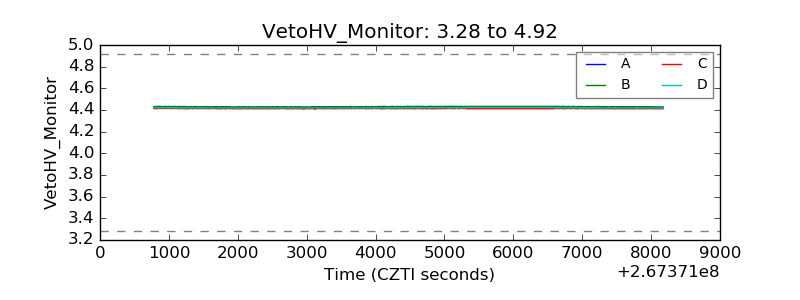 |
| Veto LLD |  |
| Alpha Counter | 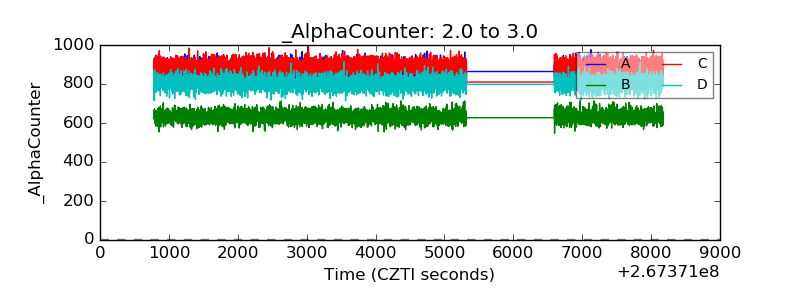 |
| _CPM_Rate | 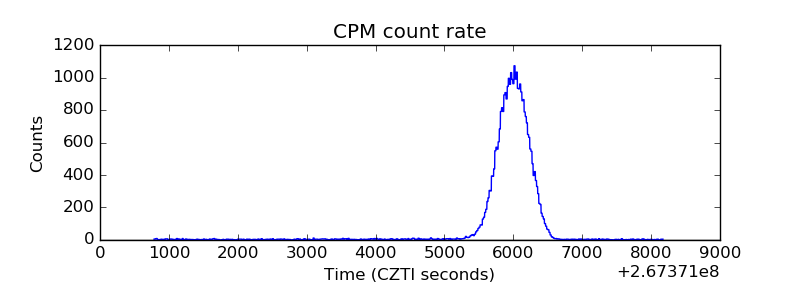 |
| CZT Counter | 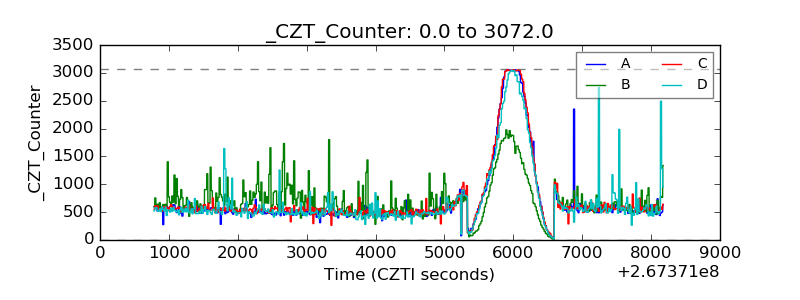 |
| +2.5 Volts monitor |  |
| +5 Volts monitor | 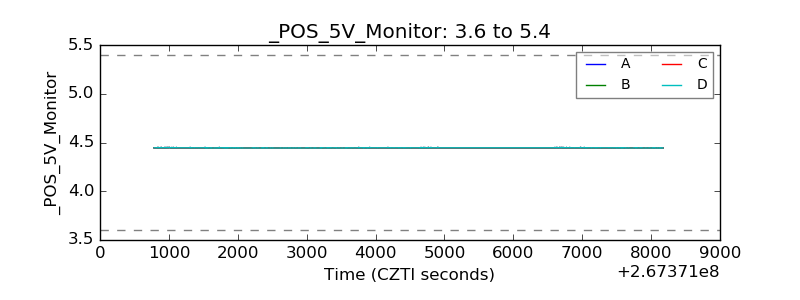 |
| _ROLL_ROT | 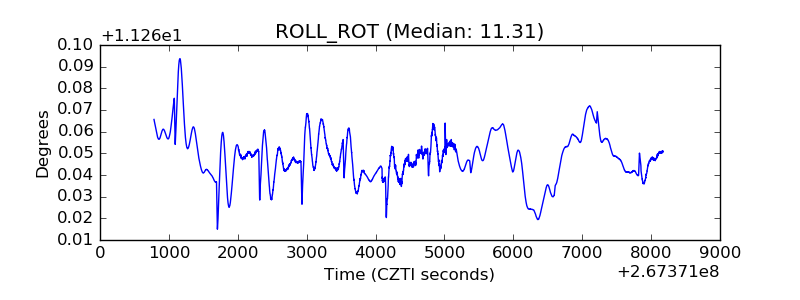 |
| _Roll_DEC | 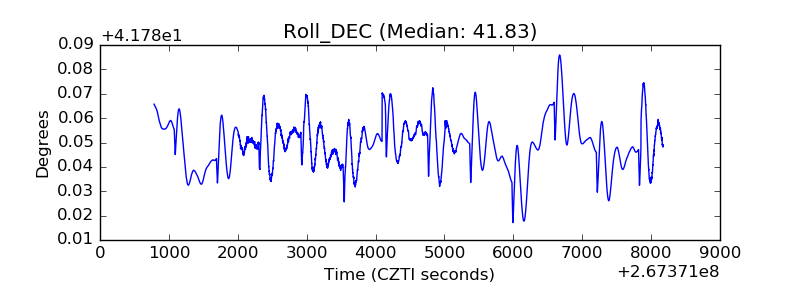 |
| _Roll_RA |  |
| Veto Counter | 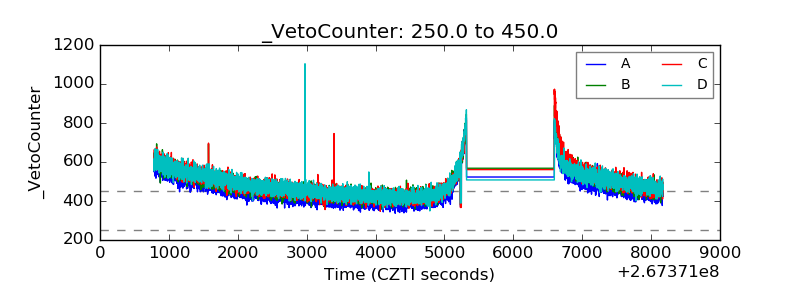 |