| Param | Original file | Final file |
|---|---|---|
| Filename | modeM0/AS1A04_022T06_9000002182_14780cztM0_level2.evt | modeM0/AS1A04_022T06_9000002182_14780cztM0_level2_quad_clean.evt |
| Size (bytes) | 517,703,040 | 72,806,400 |
| Size | 493.7 MB | 69.4 MB |
| Events in quadrant A | 3,537,511 | 440,108 |
| Events in quadrant B | 4,141,097 | 437,245 |
| Events in quadrant C | 3,742,869 | 435,741 |
| Events in quadrant D | 3,805,071 | 426,842 |
| Mode SS | |||
|---|---|---|---|
| Quadrant | BADHDUFLAG | Total packets | Discarded packets |
| A | 0 | 134 | 0 |
| B | 0 | 134 | 0 |
| C | 0 | 134 | 0 |
| D | 0 | 134 | 0 |
| Mode M0 | |||
|---|---|---|---|
| Quadrant | BADHDUFLAG | Total packets | Discarded packets |
| A | 0 | 14528 | 3 |
| B | 0 | 16743 | 2 |
| C | 0 | 15155 | 2 |
| D | 0 | 15614 | 2 |
| Mode M9 | |||
|---|---|---|---|
| Quadrant | BADHDUFLAG | Total packets | Discarded packets |
| A | 0 | 14 | 0 |
| B | 0 | 14 | 0 |
| C | 0 | 14 | 0 |
| D | 0 | 15 | 0 |
| Quadrant | Total seconds | Saturated seconds | Saturation percentage |
|---|---|---|---|
| A | 6669 | 135 | 2.024291% |
| B | 6669 | 204 | 3.058929% |
| C | 6669 | 122 | 1.829360% |
| D | 6669 | 144 | 2.159244% |
Noise dominated data is calculated using 1-second bins in cleaned event files. If a bin has >2000 counts, and if more than 50% of those come from <1% of pixels, then it is considered to be noise-dominated and hence unusable.
| Quadrant | # 1 sec bins | Bins with >0 counts | Bins with >2000 counts | High rate bins dominated by noise | Noise dominated (total time) | Noise dominated (detector-on time) | Marked lightcurve |
|---|---|---|---|---|---|---|---|
| A | 7730 | 6671 | 2 | 2 | 0.03% | 0.03% | 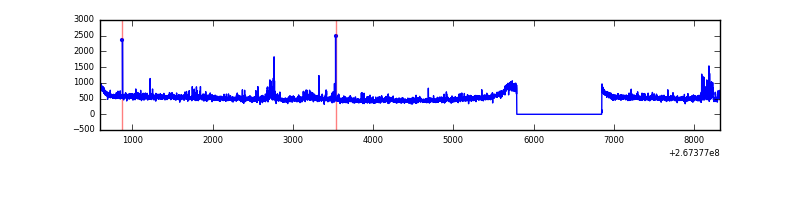 |
| B | 7730 | 6671 | 36 | 36 | 0.47% | 0.54% | 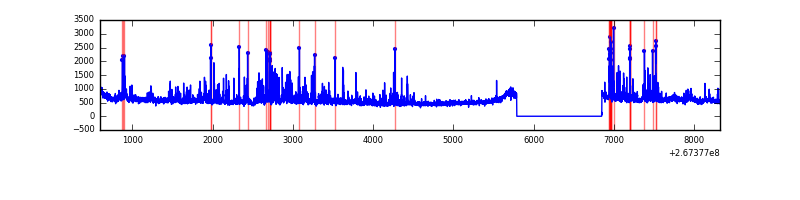 |
| C | 7730 | 6671 | 0 | 0 | 0.00% | 0.00% | 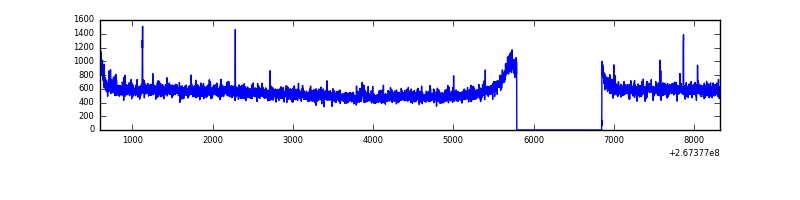 |
| D | 7730 | 6671 | 31 | 31 | 0.40% | 0.46% | 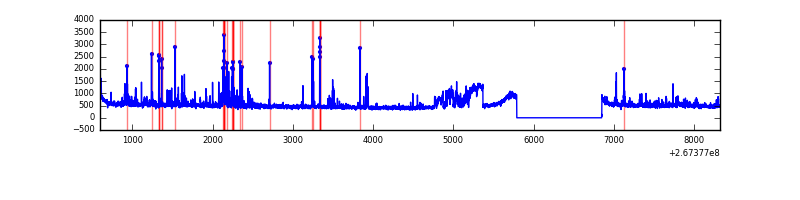 |
Top three noisy pixels from each quadrant. If the there are fewer than three noisy pixels in the level2.evt file, extra rows are filled as -1
| Pixel properties | Quadrant properties | ||||||
|---|---|---|---|---|---|---|---|
| Quadrant | DetID | PixID | Counts | Sigma | Mean | Median | Sigma |
| A | 15 | 31 | 93291 | 526.79 | 870 | 854 | 175.5 |
| A | 12 | 189 | 66430 | 373.71 | 870 | 854 | 175.5 |
| A | 3 | 1 | 16978 | 91.89 | 870 | 854 | 175.5 |
| B | 3 | 64 | 414996 | 2575.96 | 859 | 839 | 160.8 |
| B | 0 | 219 | 205280 | 1271.57 | 859 | 839 | 160.8 |
| B | 0 | 229 | 39897 | 242.93 | 859 | 839 | 160.8 |
| C | 3 | 233 | 455420 | 2342.87 | 840 | 845 | 194.0 |
| C | 0 | 207 | 9465 | 44.43 | 840 | 845 | 194.0 |
| C | 13 | 61 | 6344 | 28.34 | 840 | 845 | 194.0 |
| D | 15 | 0 | 291000 | 1347.59 | 843 | 823 | 215.3 |
| D | 12 | 233 | 225327 | 1042.6 | 843 | 823 | 215.3 |
| D | 2 | 120 | 27954 | 126.0 | 843 | 823 | 215.3 |
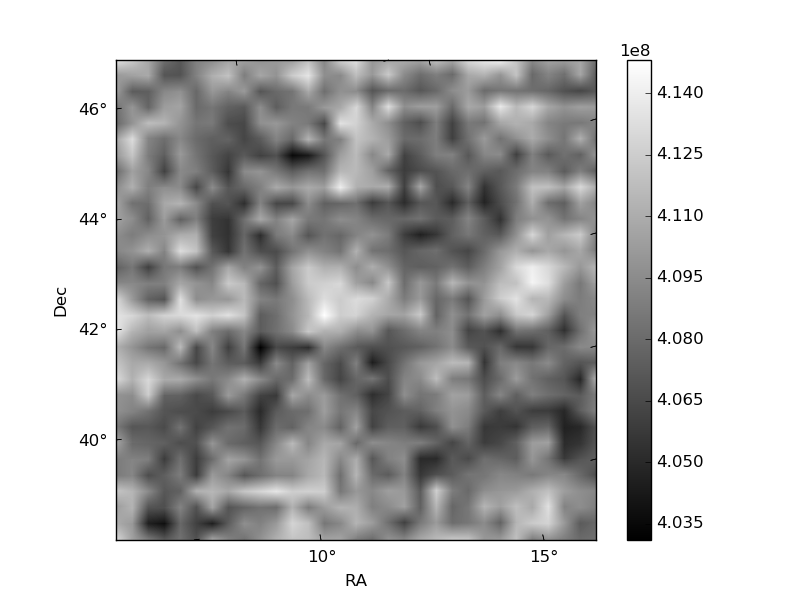
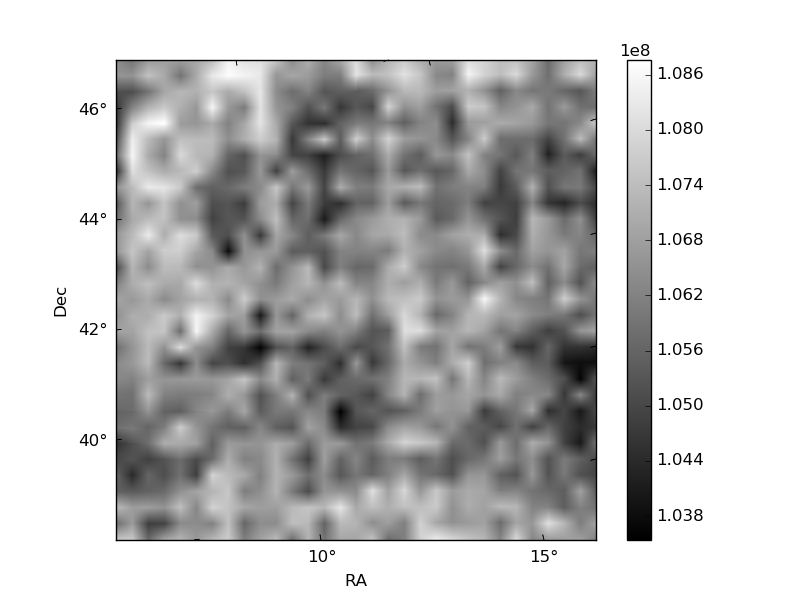
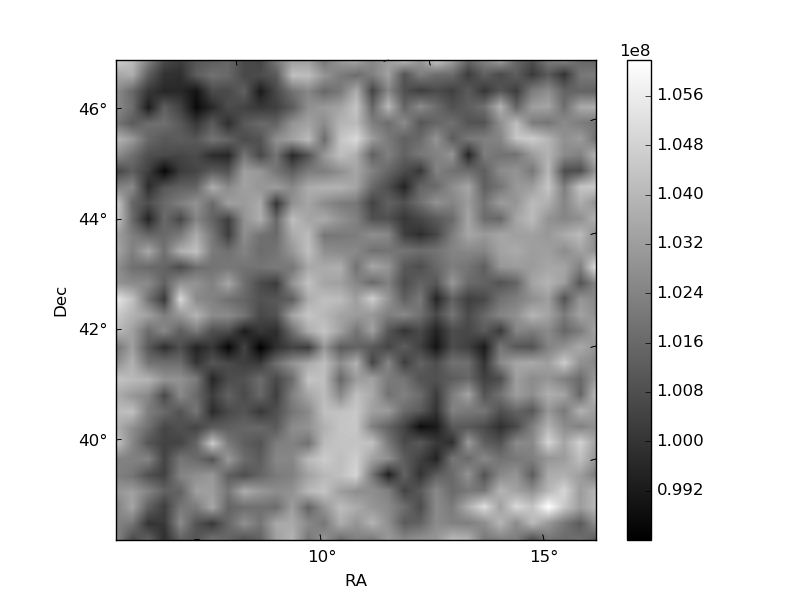
Histogram calculated using DETX and DETY for each event in the final _common_clean file
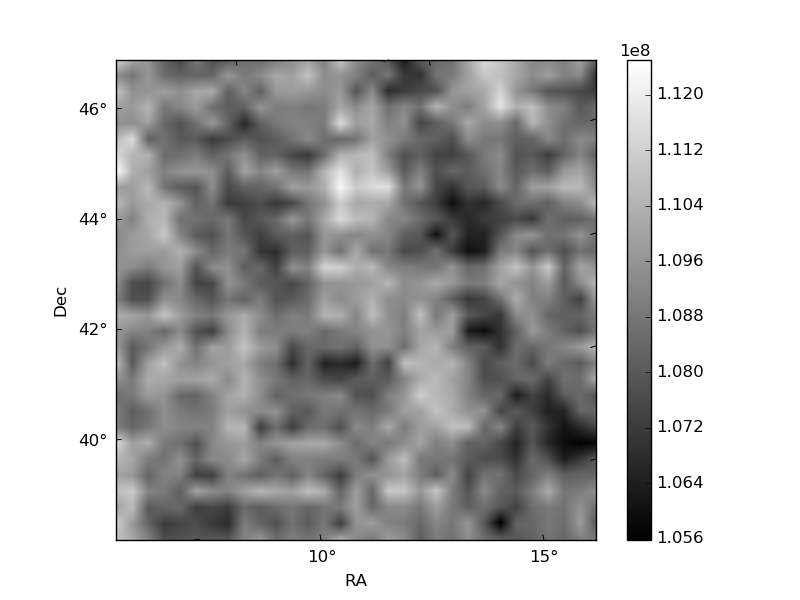
| Quadrant A | 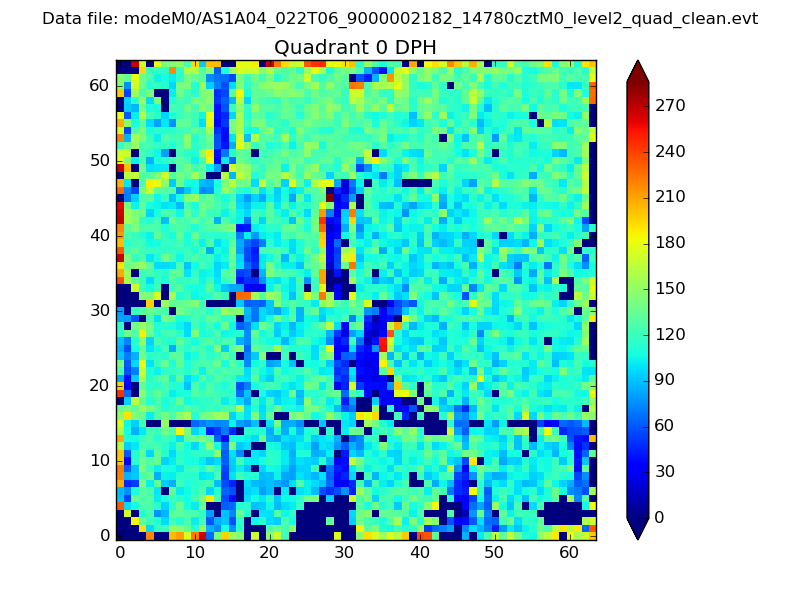 |
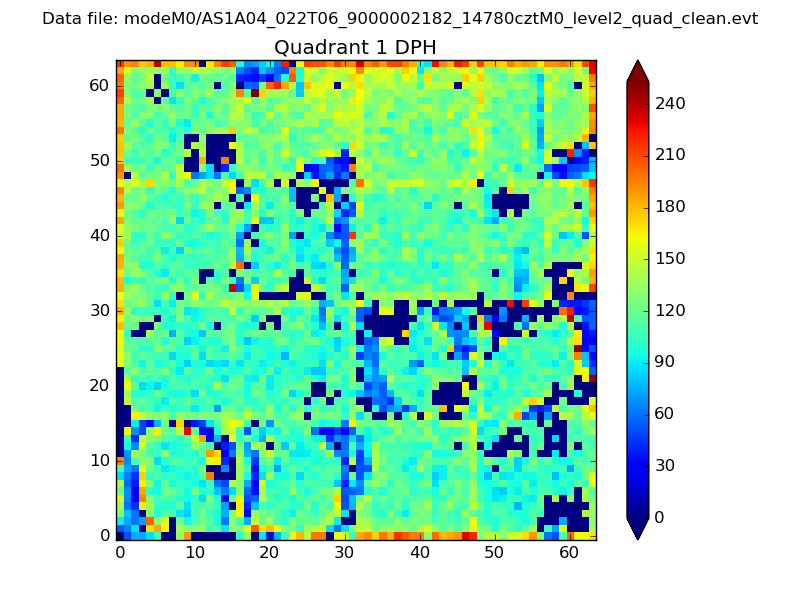 |
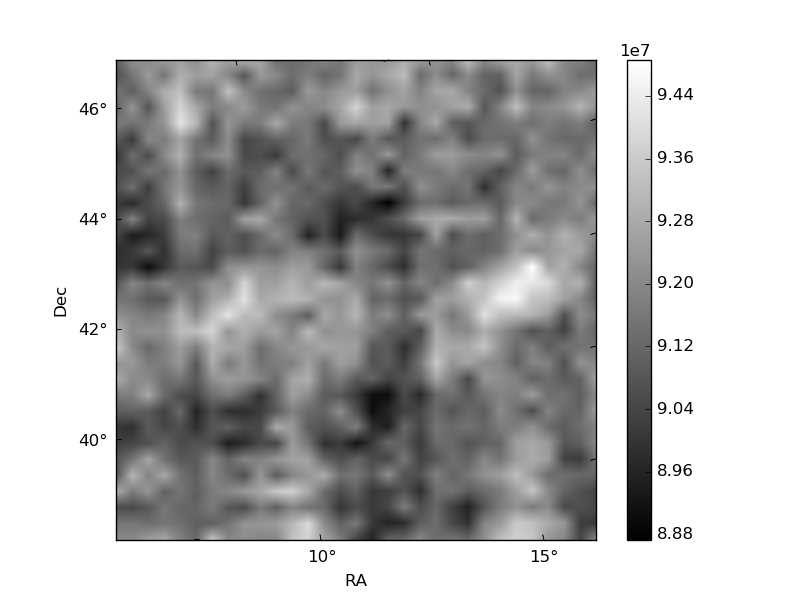
Quadrant B |
|---|---|---|---|
| Quadrant D | 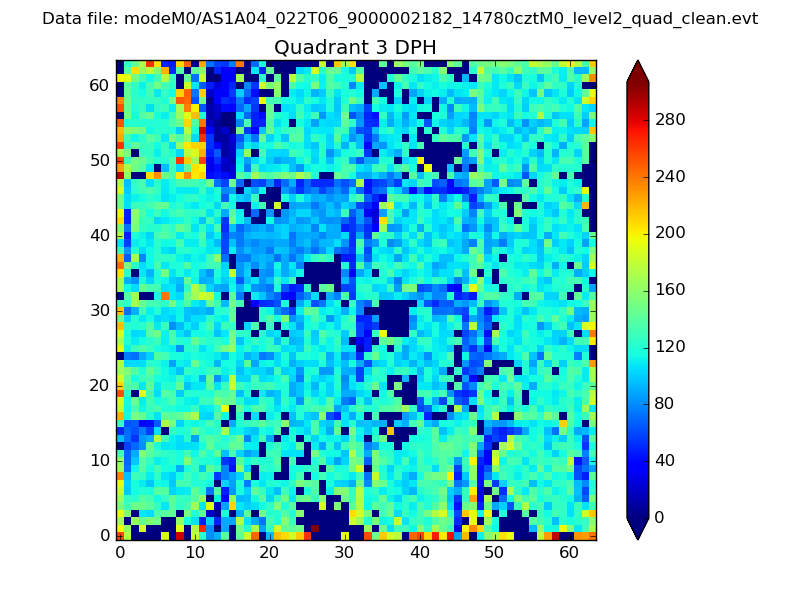 |
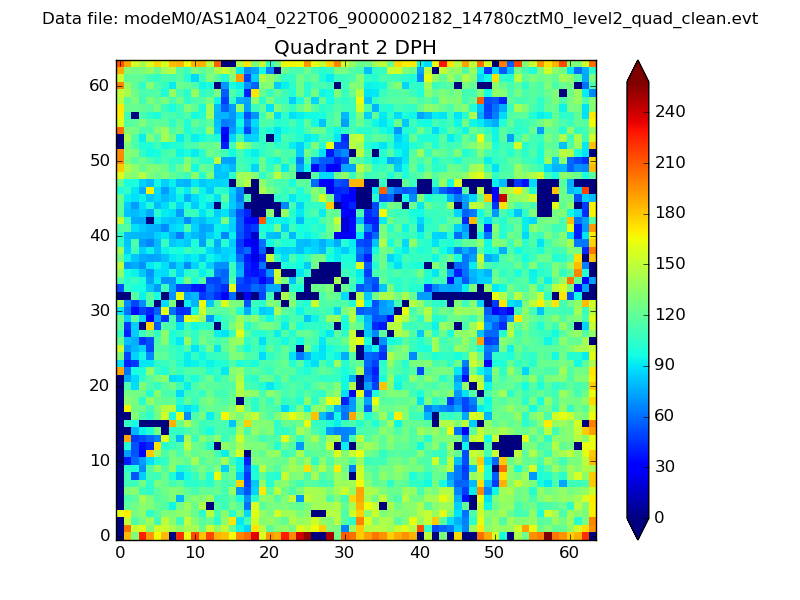 |
Quadrant C |
| Plot type | Count rate plots | Images |
|---|---|---|
| Comparison with Poisson distribution Blue bars denote a histogram of data divided into 1 sec bins. Red curve is a Poisson curve with rate = median count rate of data. |
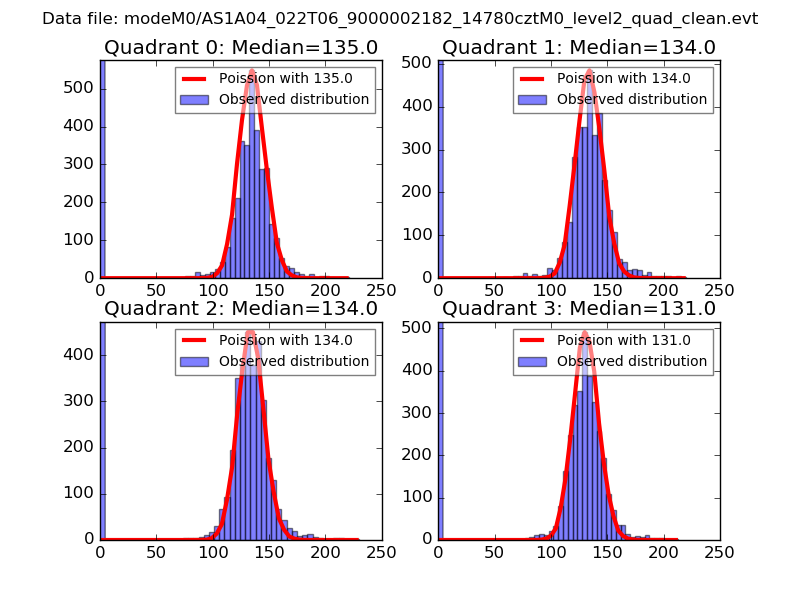 |
 |
| Quadrant-wise count rates Data is divided into 100 sec bins |
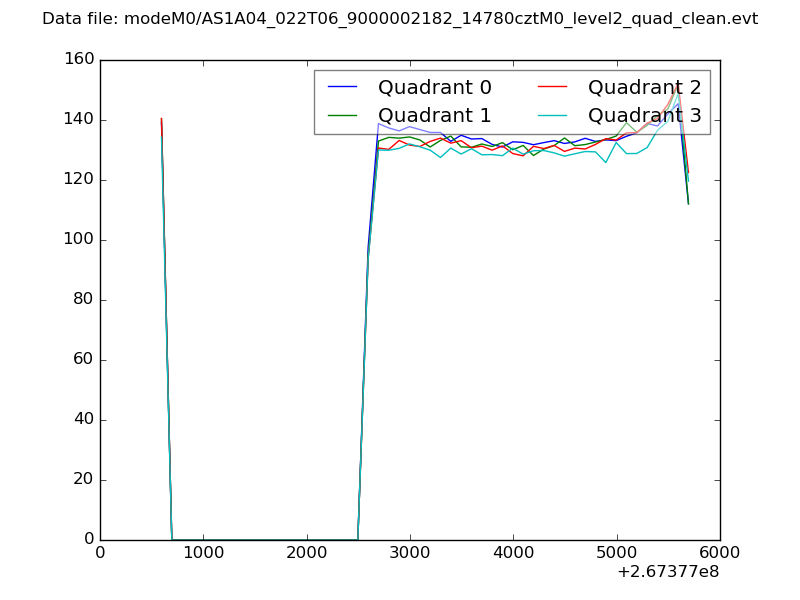 |
|
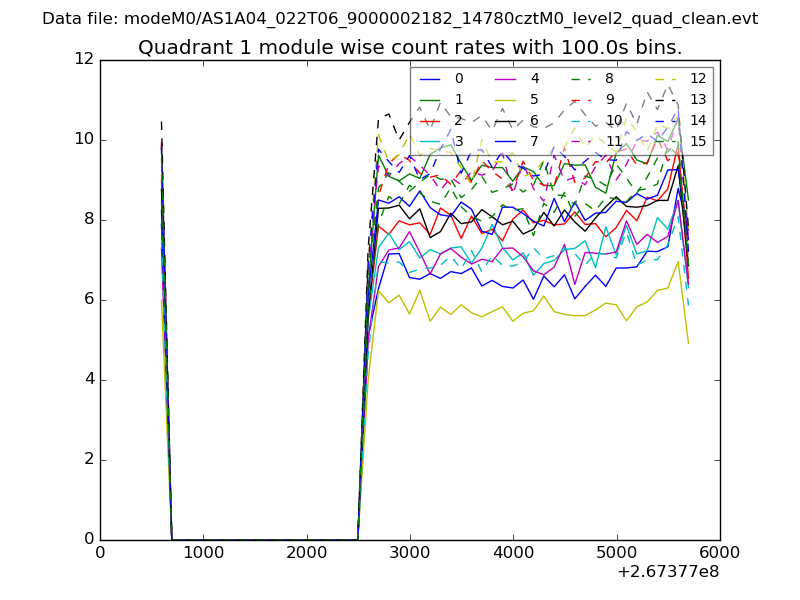
| Module-wise count rates for Quadrant A Data is divided into 100 sec bins |
 |
 |
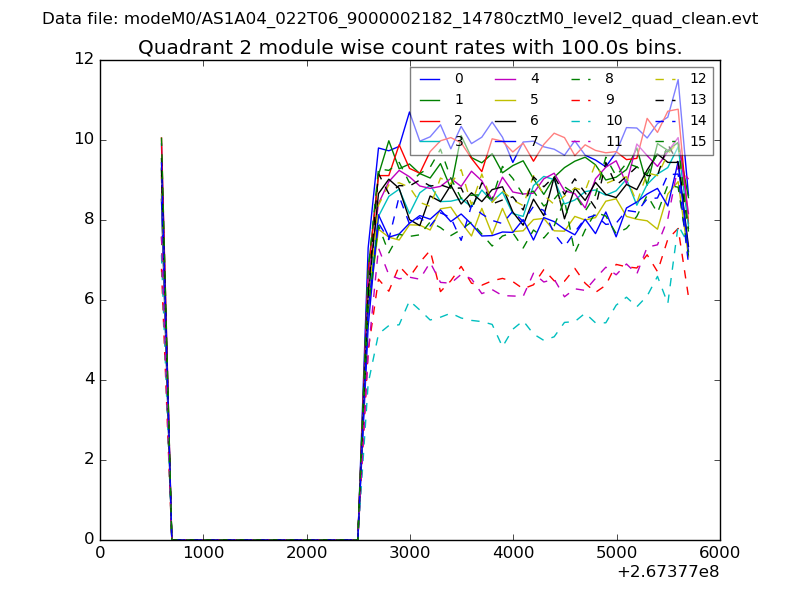
| Module-wise count rates for Quadrant B Data is divided into 100 sec bins |
 |
 |
| Module-wise count rates for Quadrant C Data is divided into 100 sec bins |
 |
 |
| Module-wise count rates for Quadrant D Data is divided into 100 sec bins |
 |
 |
| Parameter | Plot |
|---|---|
| CZT HV Monitor | 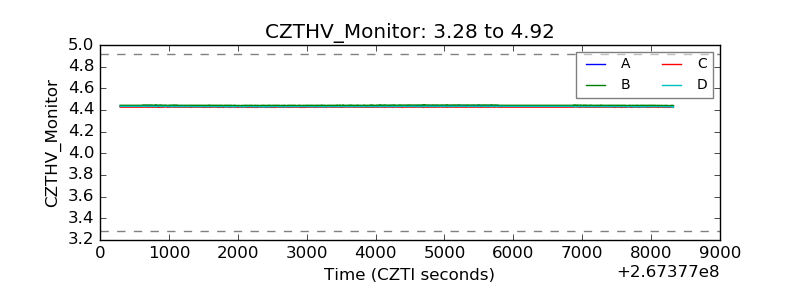 |
| D_VDD |  |
| Temperature 1 | 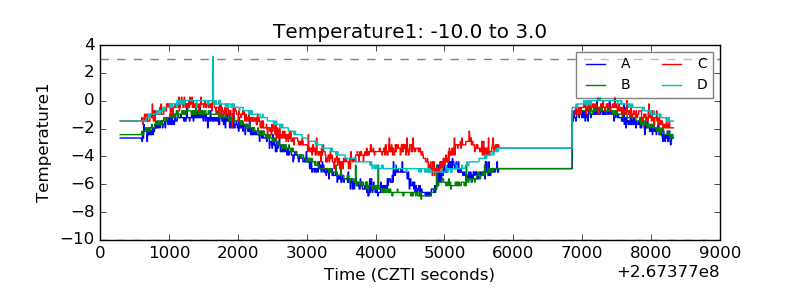 |
| Veto HV Monitor | 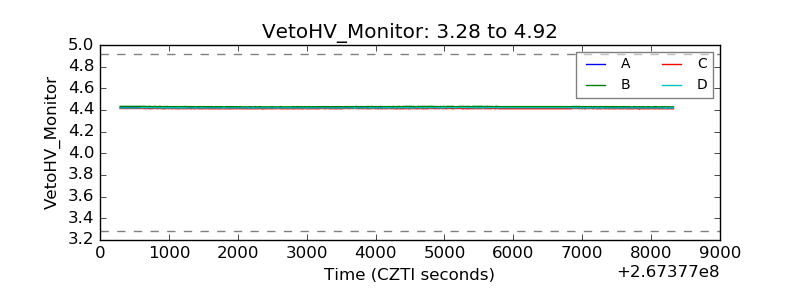 |
| Veto LLD |  |
| Alpha Counter | 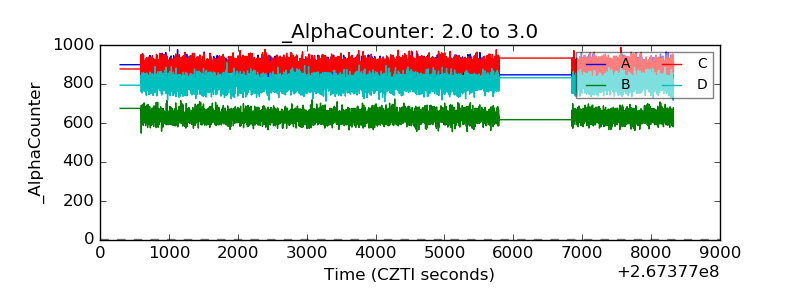 |
| _CPM_Rate | 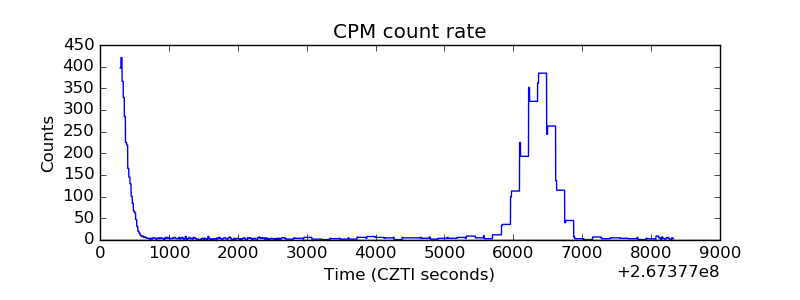 |
| CZT Counter | 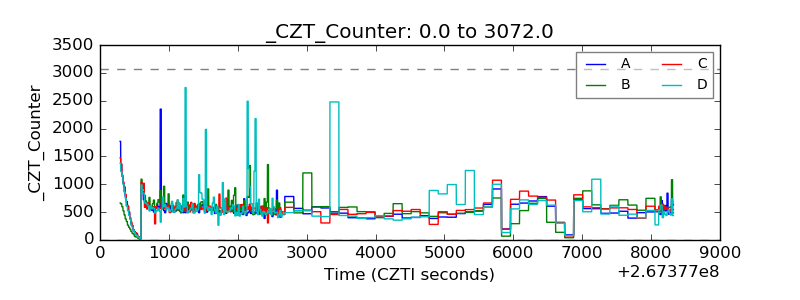 |
| +2.5 Volts monitor |  |
| +5 Volts monitor |  |
| _ROLL_ROT |  |
| _Roll_DEC | 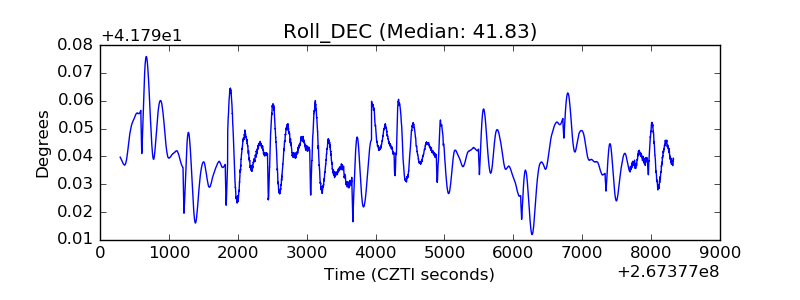 |
| _Roll_RA | 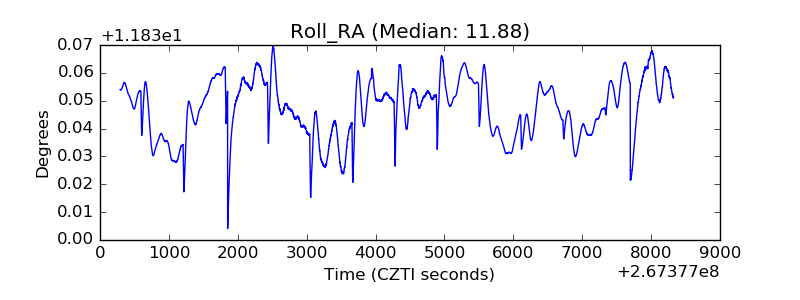 |
| Veto Counter |  |