| Param | Original file | Final file |
|---|---|---|
| Filename | modeM0/AS1A04_022T06_9000002182_14781cztM0_level2.evt | modeM0/AS1A04_022T06_9000002182_14781cztM0_level2_quad_clean.evt |
| Size (bytes) | 192,913,920 | 20,269,440 |
| Size | 184.0 MB | 19.3 MB |
| Events in quadrant A | 1,299,928 | 111,349 |
| Events in quadrant B | 1,592,946 | 109,412 |
| Events in quadrant C | 1,422,474 | 107,664 |
| Events in quadrant D | 1,356,444 | 106,400 |
| Mode SS | |||
|---|---|---|---|
| Quadrant | BADHDUFLAG | Total packets | Discarded packets |
| A | 0 | 50 | 0 |
| B | 0 | 50 | 0 |
| C | 0 | 50 | 0 |
| D | 0 | 50 | 0 |
| Mode M0 | |||
|---|---|---|---|
| Quadrant | BADHDUFLAG | Total packets | Discarded packets |
| A | 0 | 5348 | 1 |
| B | 0 | 6427 | 1 |
| C | 0 | 5713 | 1 |
| D | 0 | 5562 | 1 |
| Mode M9 | |||
|---|---|---|---|
| Quadrant | BADHDUFLAG | Total packets | Discarded packets |
| A | 0 | 3 | 0 |
| B | 0 | 3 | 0 |
| C | 0 | 3 | 0 |
| D | 0 | 4 | 0 |
| Quadrant | Total seconds | Saturated seconds | Saturation percentage |
|---|---|---|---|
| A | 2479 | 8 | 0.322711% |
| B | 2479 | 47 | 1.895926% |
| C | 2479 | 7 | 0.282372% |
| D | 2479 | 11 | 0.443727% |
Noise dominated data is calculated using 1-second bins in cleaned event files. If a bin has >2000 counts, and if more than 50% of those come from <1% of pixels, then it is considered to be noise-dominated and hence unusable.
| Quadrant | # 1 sec bins | Bins with >0 counts | Bins with >2000 counts | High rate bins dominated by noise | Noise dominated (total time) | Noise dominated (detector-on time) | Marked lightcurve |
|---|---|---|---|---|---|---|---|
| A | 2480 | 2480 | 0 | 0 | 0.00% | 0.00% | 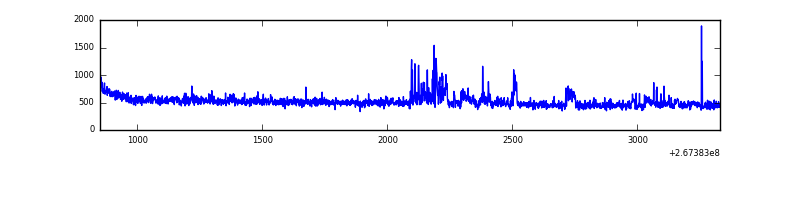 |
| B | 2480 | 2480 | 22 | 22 | 0.89% | 0.89% | 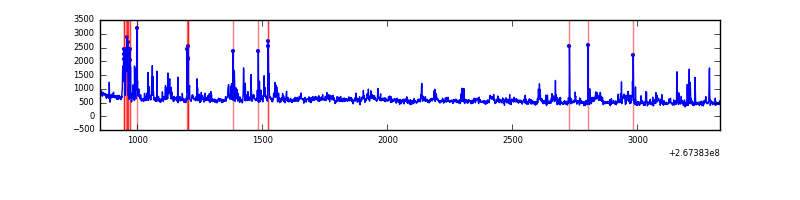 |
| C | 2480 | 2480 | 0 | 0 | 0.00% | 0.00% | 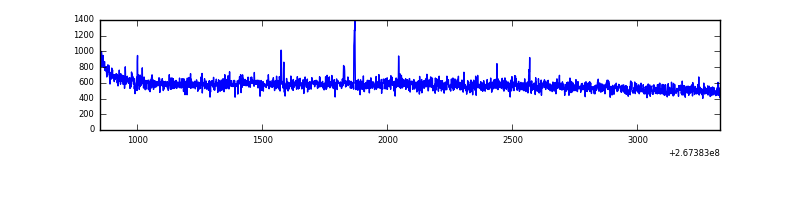 |
| D | 2480 | 2480 | 7 | 7 | 0.28% | 0.28% | 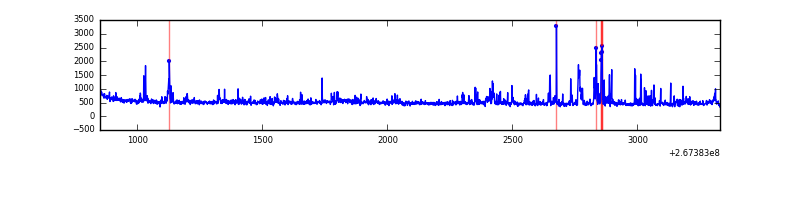 |
Top three noisy pixels from each quadrant. If the there are fewer than three noisy pixels in the level2.evt file, extra rows are filled as -1
| Pixel properties | Quadrant properties | ||||||
|---|---|---|---|---|---|---|---|
| Quadrant | DetID | PixID | Counts | Sigma | Mean | Median | Sigma |
| A | 15 | 31 | 65879 | 1009.36 | 314 | 308 | 65.0 |
| A | 12 | 189 | 15948 | 240.75 | 314 | 308 | 65.0 |
| A | 3 | 1 | 4793 | 69.04 | 314 | 308 | 65.0 |
| B | 3 | 64 | 176709 | 2955.72 | 309 | 302 | 59.7 |
| B | 0 | 219 | 134541 | 2249.19 | 309 | 302 | 59.7 |
| B | 0 | 190 | 18118 | 298.51 | 309 | 302 | 59.7 |
| C | 3 | 233 | 243028 | 3414.96 | 302 | 303 | 71.1 |
| C | 13 | 61 | 2304 | 28.15 | 302 | 303 | 71.1 |
| C | 0 | 207 | 1325 | 14.38 | 302 | 303 | 71.1 |
| D | 12 | 233 | 157412 | 1949.86 | 306 | 297 | 80.6 |
| D | 15 | 145 | 14178 | 172.27 | 306 | 297 | 80.6 |
| D | 2 | 234 | 10558 | 127.34 | 306 | 297 | 80.6 |
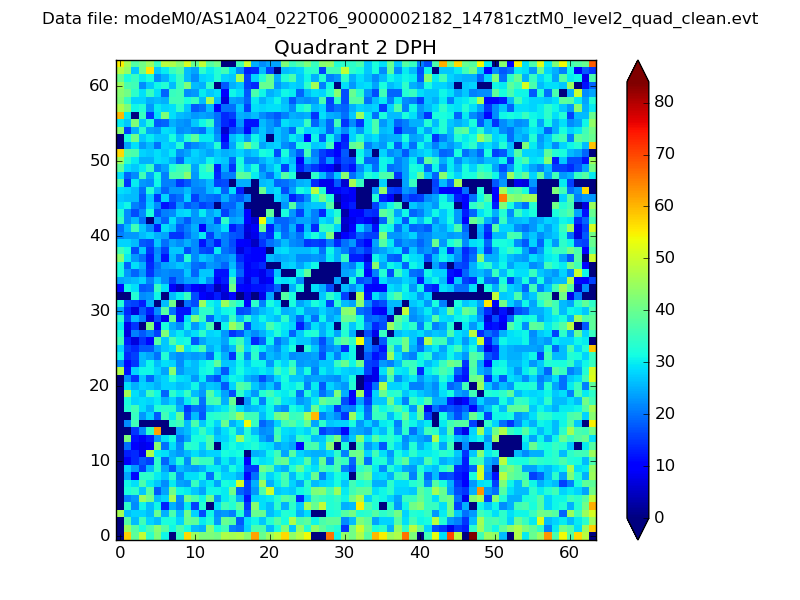
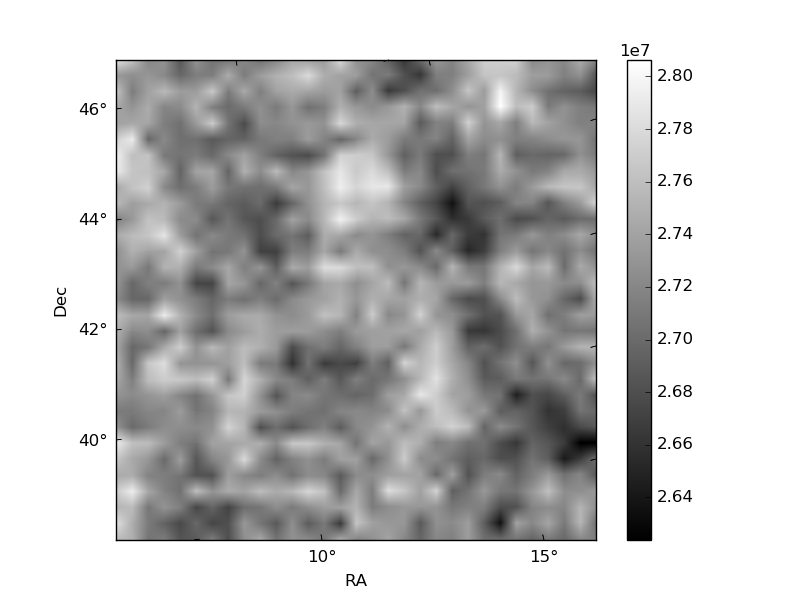
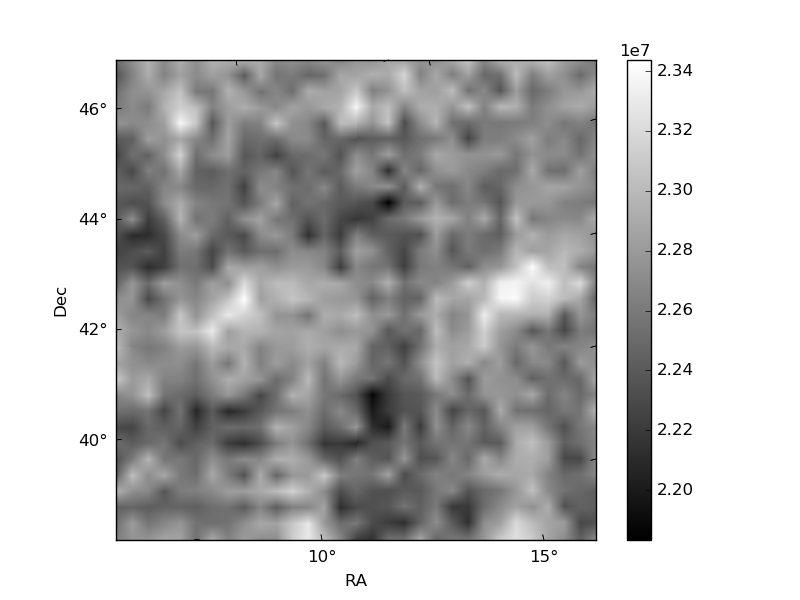
Histogram calculated using DETX and DETY for each event in the final _common_clean file
| Quadrant A | 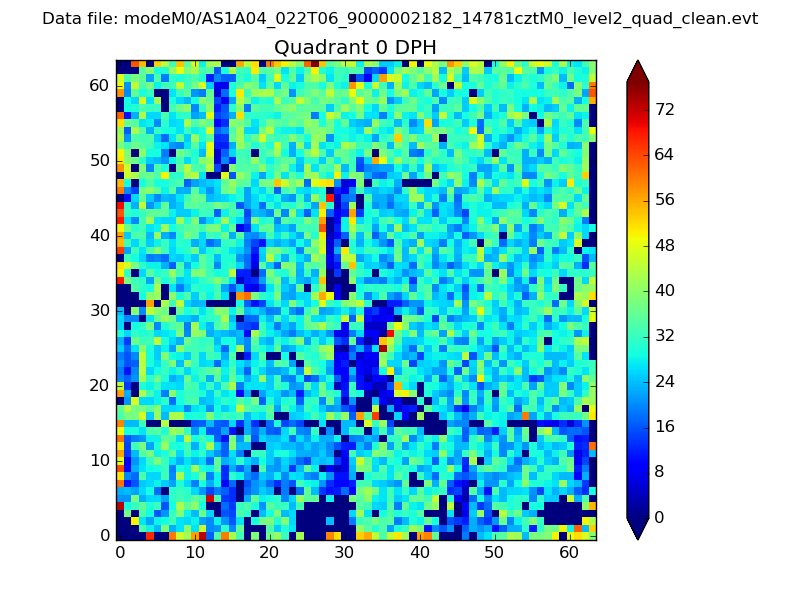 |
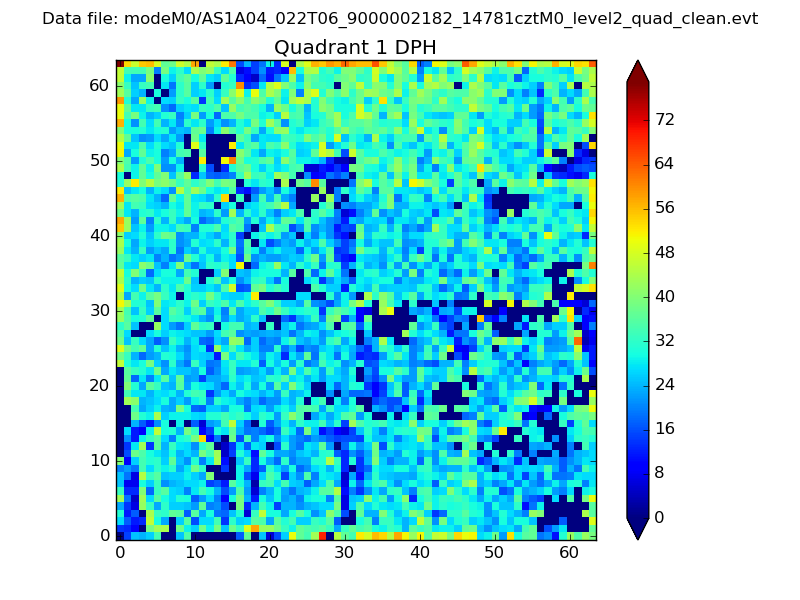 |
Quadrant B |
|---|---|---|---|
| Quadrant D | 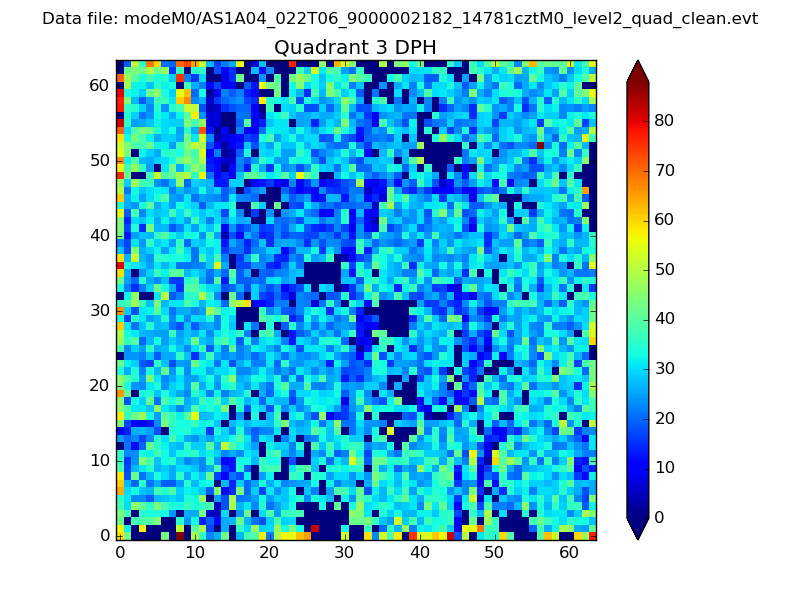 |
 |
Quadrant C |
| Plot type | Count rate plots | Images |
|---|---|---|
| Comparison with Poisson distribution Blue bars denote a histogram of data divided into 1 sec bins. Red curve is a Poisson curve with rate = median count rate of data. |
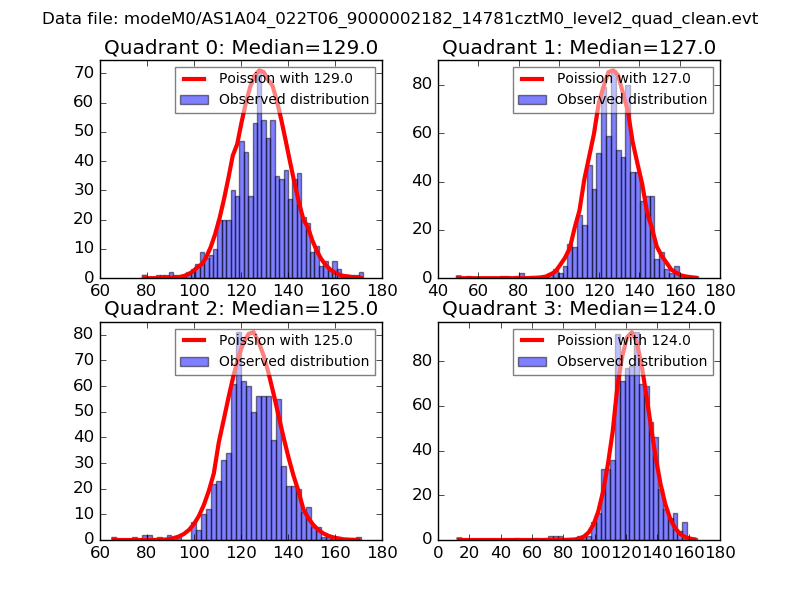 |
 |
| Quadrant-wise count rates Data is divided into 100 sec bins |
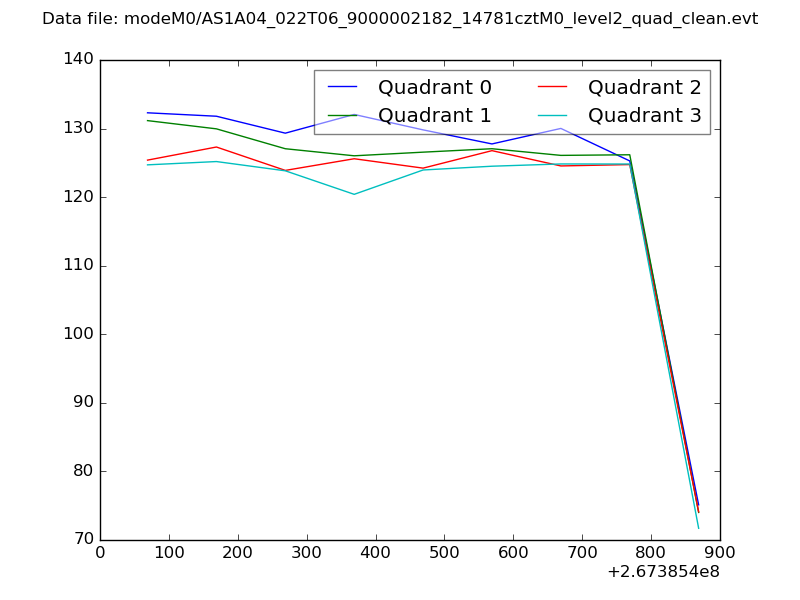 |
|
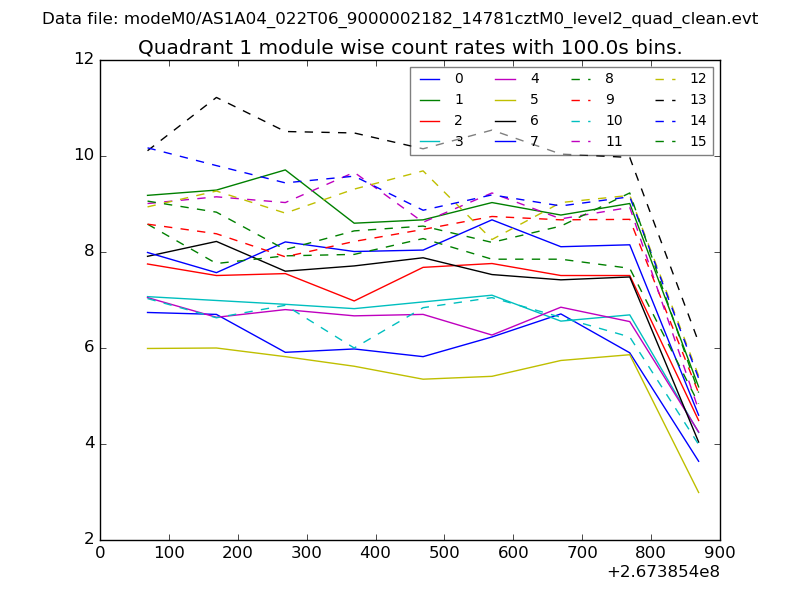
| Module-wise count rates for Quadrant A Data is divided into 100 sec bins |
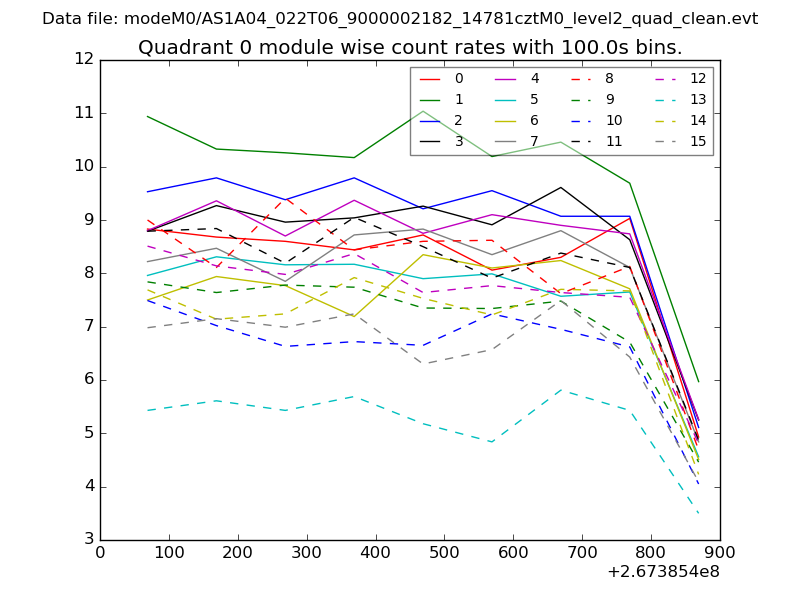 |
 |
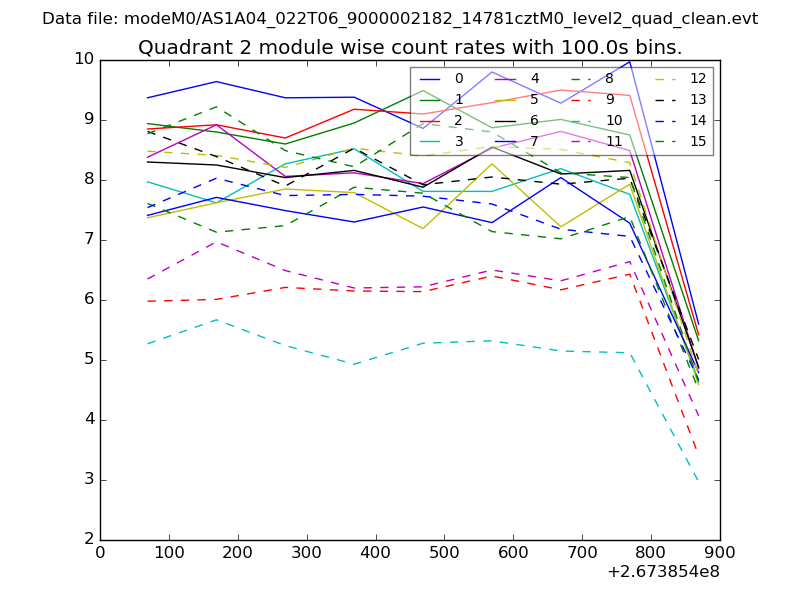
| Module-wise count rates for Quadrant B Data is divided into 100 sec bins |
 |
 |
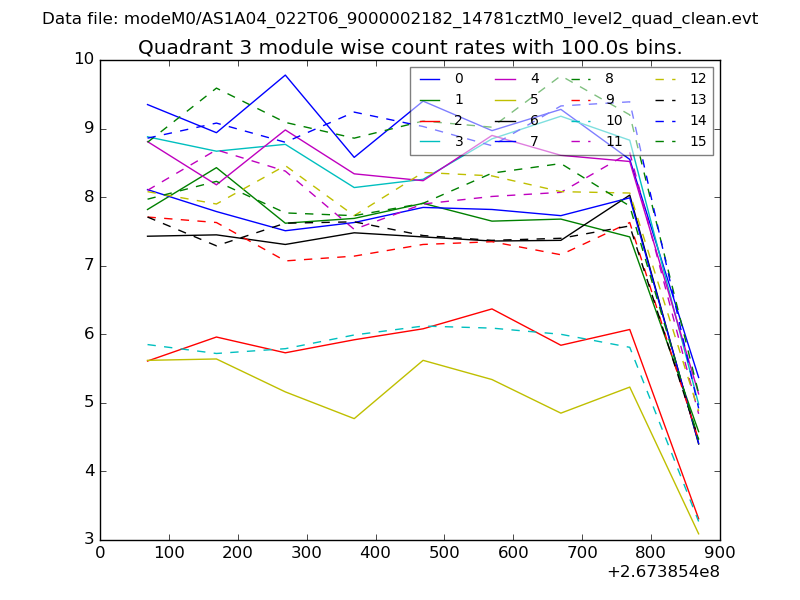
| Module-wise count rates for Quadrant C Data is divided into 100 sec bins |
 |
 |
| Module-wise count rates for Quadrant D Data is divided into 100 sec bins |
 |
 |
| Parameter | Plot |
|---|---|
| CZT HV Monitor | 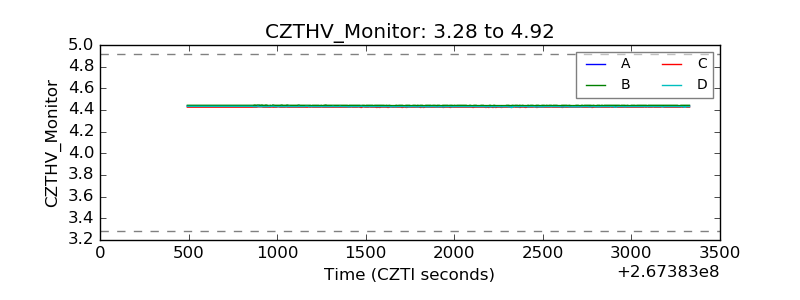 |
| D_VDD | 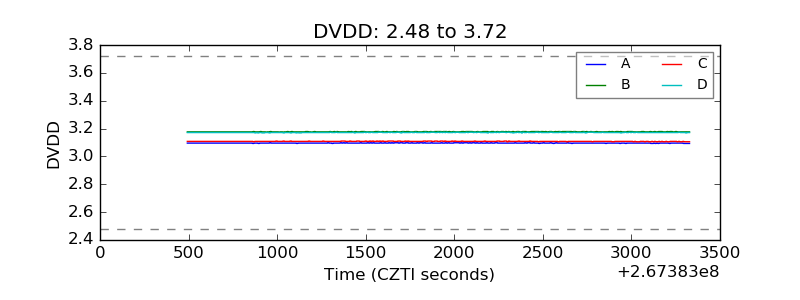 |
| Temperature 1 | 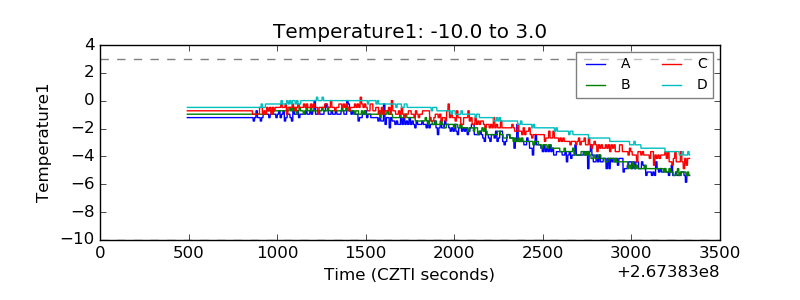 |
| Veto HV Monitor | 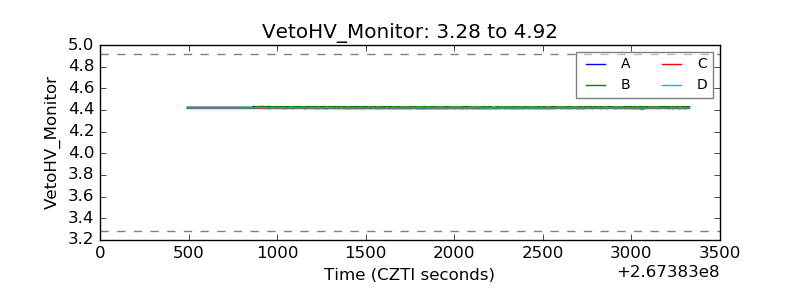 |
| Veto LLD | 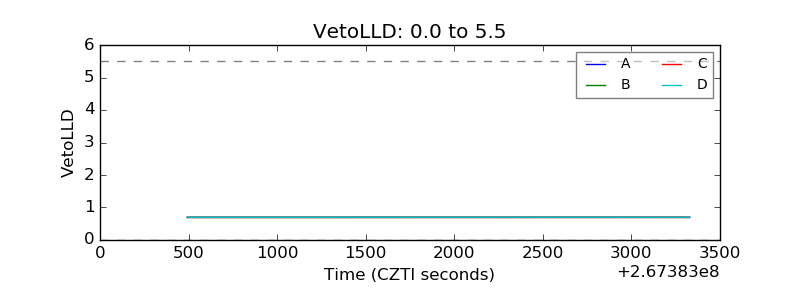 |
| Alpha Counter | 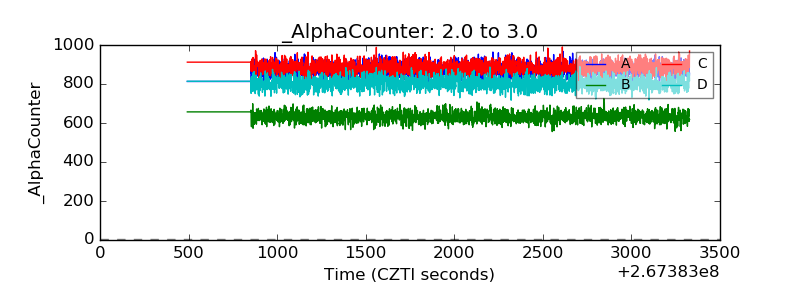 |
| _CPM_Rate | 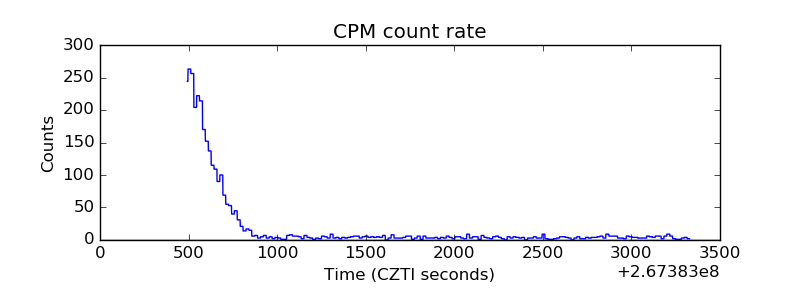 |
| CZT Counter |  |
| +2.5 Volts monitor |  |
| +5 Volts monitor |  |
| _ROLL_ROT | 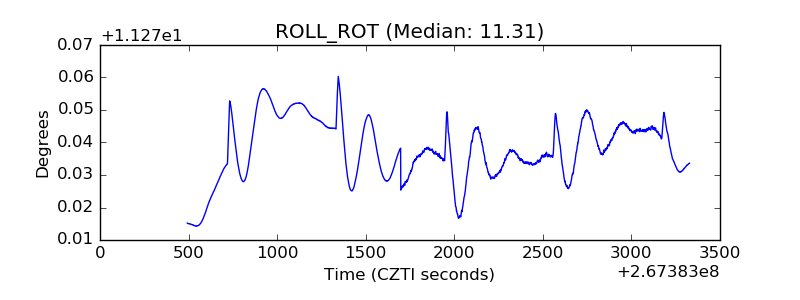 |
| _Roll_DEC | 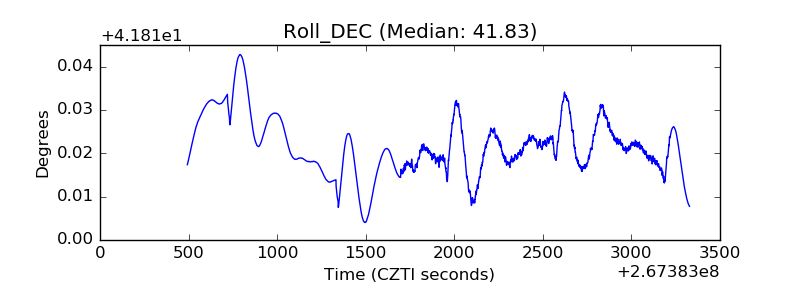 |
| _Roll_RA |  |
| Veto Counter | 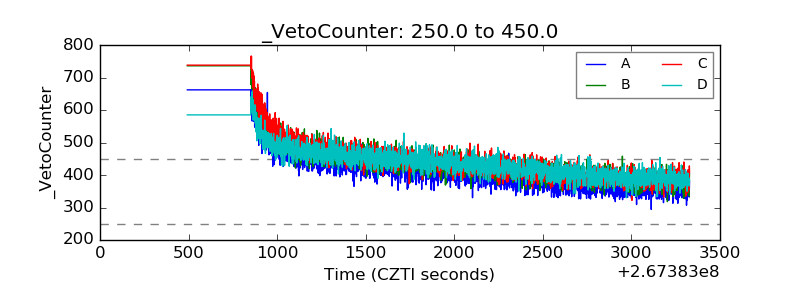 |