| Param | Original file | Final file |
|---|---|---|
| Filename | modeM0/AS1A04_022T02_9000002184cztM0_level2.fits | modeM0/AS1A04_022T02_9000002184cztM0_level2_quad_clean.evt |
| Size (bytes) | 1,211,849,280 | 1,178,496,000 |
| Size | 1.1 GB | 1.1 GB |
| Events in quadrant A | 7,429,936 | 7,121,697 |
| Events in quadrant B | 6,928,960 | 6,829,449 |
| Events in quadrant C | 7,193,988 | 6,675,148 |
| Events in quadrant D | 6,396,642 | 6,316,271 |
| Mode M0 | |||
|---|---|---|---|
| Quadrant | BADHDUFLAG | Total packets | Discarded packets |
| A | 0 | 271543 | 0 |
| B | 0 | 322248 | 0 |
| C | 0 | 313289 | 0 |
| D | 0 | 273163 | 0 |
| Mode M9 | |||
|---|---|---|---|
| Quadrant | BADHDUFLAG | Total packets | Discarded packets |
| A | 0 | 184 | 0 |
| B | 0 | 184 | 0 |
| C | 0 | 184 | 0 |
| D | 0 | 184 | 0 |
| Mode SS | |||
|---|---|---|---|
| Quadrant | BADHDUFLAG | Total packets | Discarded packets |
| A | 0 | 2598 | 0 |
| B | 0 | 2598 | 0 |
| C | 0 | 2598 | 0 |
| D | 0 | 2598 | 0 |
| Quadrant | Total seconds | Saturated seconds | Saturation percentage |
|---|---|---|---|
| A | 127690 | 1431 | 1.120683% |
| B | 127690 | 6163 | 4.826533% |
| C | 127690 | 1791 | 1.402616% |
| D | 127690 | 1414 | 1.107369% |
Noise dominated data is calculated using 1-second bins in cleaned event files. If a bin has >2000 counts, and if more than 50% of those come from <1% of pixels, then it is considered to be noise-dominated and hence unusable.
| Quadrant | # 1 sec bins | Bins with >0 counts | Bins with >2000 counts | High rate bins dominated by noise | Noise dominated (total time) | Noise dominated (detector-on time) | Marked lightcurve |
|---|---|---|---|---|---|---|---|
| A | 146101 | 127690 | 0 | 0 | 0.00% | 0.00% | 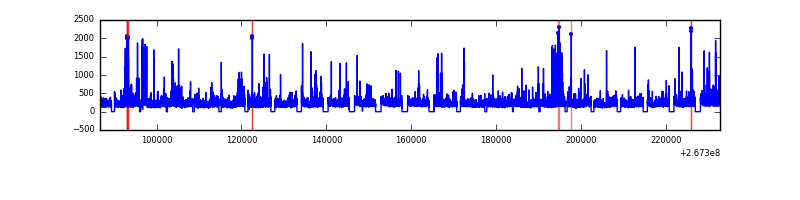 |
| B | 146101 | 127570 | 0 | 0 | 0.00% | 0.00% |  |
| C | 146100 | 127684 | 0 | 0 | 0.00% | 0.00% | 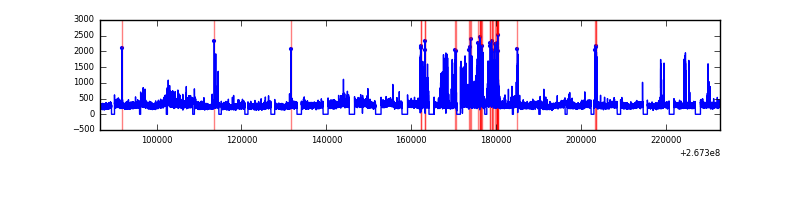 |
| D | 146101 | 127685 | 0 | 0 | 0.00% | 0.00% |  |
Top three noisy pixels from each quadrant. If the there are fewer than three noisy pixels in the level2.evt file, extra rows are filled as -1
| Pixel properties | Quadrant properties | ||||||
|---|---|---|---|---|---|---|---|
| Quadrant | DetID | PixID | Counts | Sigma | Mean | Median | Sigma |
| A | 0 | 29 | 7126 | 11.18 | 1937 | 1820 | 474.6 |
| A | 7 | 110 | 6040 | 8.89 | 1937 | 1820 | 474.6 |
| A | 0 | 30 | 5610 | 7.99 | 1937 | 1820 | 474.6 |
| B | 2 | 9 | 6077 | 12.31 | 1831 | 1750 | 351.4 |
| B | 14 | 254 | 4572 | 8.03 | 1831 | 1750 | 351.4 |
| B | 5 | 128 | 4529 | 7.91 | 1831 | 1750 | 351.4 |
| C | 12 | 241 | 5083 | 6.84 | 1901 | 1769 | 484.6 |
| C | 2 | 191 | 4915 | 6.49 | 1901 | 1769 | 484.6 |
| C | 3 | 126 | 4767 | 6.19 | 1901 | 1769 | 484.6 |
| D | 3 | 14 | 4740 | 6.29 | 1826 | 1657 | 489.8 |
| D | 6 | 231 | 4655 | 6.12 | 1826 | 1657 | 489.8 |
| D | 10 | 189 | 4558 | 5.92 | 1826 | 1657 | 489.8 |
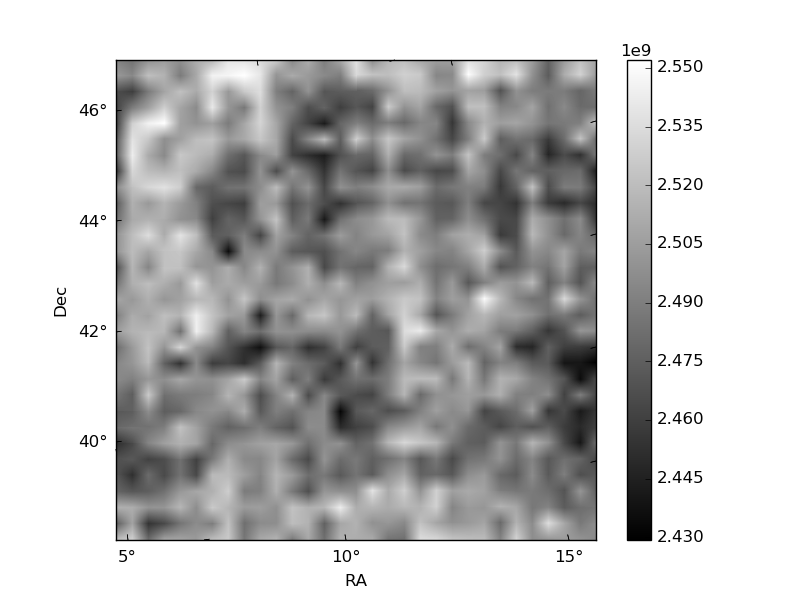
Histogram calculated using DETX and DETY for each event in the final _common_clean file
| Quadrant A |  |
 |
Quadrant B |
|---|---|---|---|
| Quadrant D |  |
 |
Quadrant C |
| Plot type | Count rate plots | Images |
|---|---|---|
| Comparison with Poisson distribution Blue bars denote a histogram of data divided into 1 sec bins. Red curve is a Poisson curve with rate = median count rate of data. |
 |
 |
| Quadrant-wise count rates Data is divided into 100 sec bins |
 |
|
| Module-wise count rates for Quadrant A Data is divided into 100 sec bins |
 |
 |
| Module-wise count rates for Quadrant B Data is divided into 100 sec bins |
 |
 |
| Module-wise count rates for Quadrant C Data is divided into 100 sec bins |
 |
 |
| Module-wise count rates for Quadrant D Data is divided into 100 sec bins |
 |
 |
| Parameter | Plot |
|---|---|
| CZT HV Monitor |  |
| D_VDD | 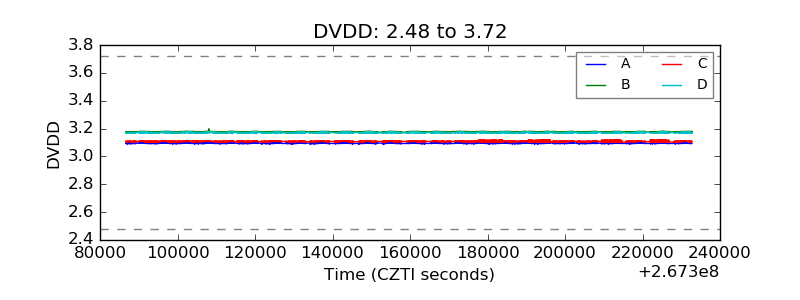 |
| Temperature 1 | 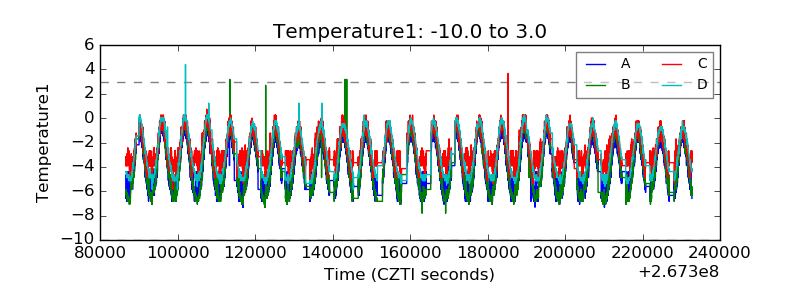 |
| Veto HV Monitor |  |
| Veto LLD |  |
| Alpha Counter |  |
| _CPM_Rate |  |
| CZT Counter |  |
| +2.5 Volts monitor |  |
| +5 Volts monitor |  |
| _ROLL_ROT |  |
| _Roll_DEC |  |
| _Roll_RA |  |
| Veto Counter |  |