| Param | Original file | Final file |
|---|---|---|
| Filename | modeM0/AS1A04_022T02_9000002184_14781cztM0_level2.evt | modeM0/AS1A04_022T02_9000002184_14781cztM0_level2_quad_clean.evt |
| Size (bytes) | 306,429,120 | 58,544,640 |
| Size | 292.2 MB | 55.8 MB |
| Events in quadrant A | 2,009,805 | 374,624 |
| Events in quadrant B | 2,555,238 | 373,184 |
| Events in quadrant C | 2,380,060 | 370,655 |
| Events in quadrant D | 2,052,207 | 361,834 |
| Mode M0 | |||
|---|---|---|---|
| Quadrant | BADHDUFLAG | Total packets | Discarded packets |
| A | 0 | 8612 | 2 |
| B | 0 | 10439 | 1 |
| C | 0 | 9892 | 1 |
| D | 0 | 8993 | 1 |
| Mode M9 | |||
|---|---|---|---|
| Quadrant | BADHDUFLAG | Total packets | Discarded packets |
| A | 0 | 7 | 0 |
| B | 0 | 7 | 0 |
| C | 0 | 7 | 0 |
| D | 0 | 7 | 0 |
| Mode SS | |||
|---|---|---|---|
| Quadrant | BADHDUFLAG | Total packets | Discarded packets |
| A | 0 | 86 | 0 |
| B | 0 | 86 | 0 |
| C | 0 | 86 | 0 |
| D | 0 | 86 | 0 |
| Quadrant | Total seconds | Saturated seconds | Saturation percentage |
|---|---|---|---|
| A | 4142 | 71 | 1.714148% |
| B | 4142 | 158 | 3.814582% |
| C | 4142 | 65 | 1.569290% |
| D | 4142 | 94 | 2.269435% |
Noise dominated data is calculated using 1-second bins in cleaned event files. If a bin has >2000 counts, and if more than 50% of those come from <1% of pixels, then it is considered to be noise-dominated and hence unusable.
| Quadrant | # 1 sec bins | Bins with >0 counts | Bins with >2000 counts | High rate bins dominated by noise | Noise dominated (total time) | Noise dominated (detector-on time) | Marked lightcurve |
|---|---|---|---|---|---|---|---|
| A | 4868 | 4144 | 0 | 0 | 0.00% | 0.00% | 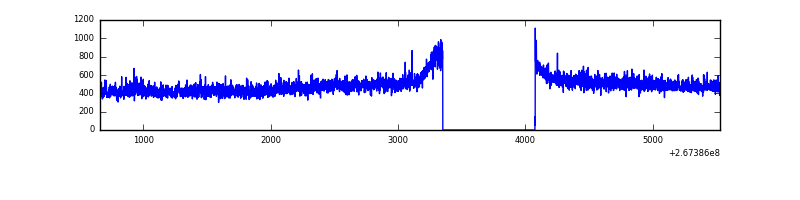 |
| B | 4868 | 4144 | 27 | 27 | 0.55% | 0.65% | 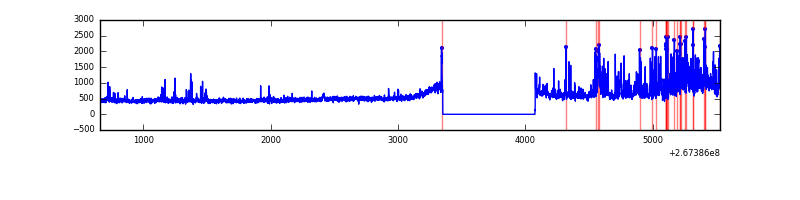 |
| C | 4868 | 4144 | 0 | 0 | 0.00% | 0.00% | 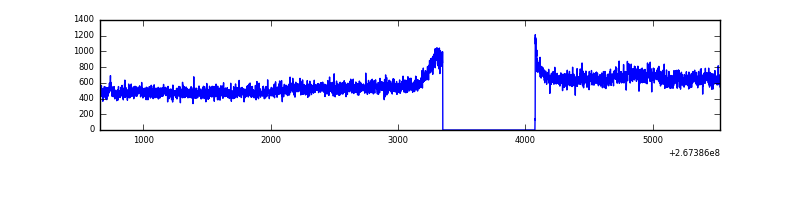 |
| D | 4868 | 4144 | 23 | 23 | 0.47% | 0.56% | 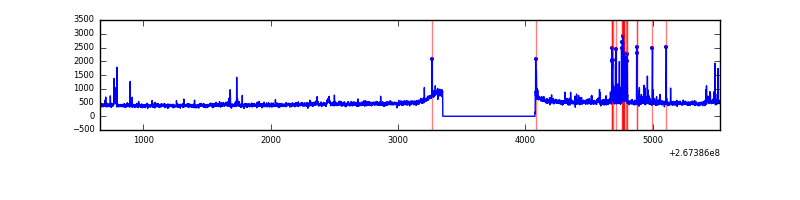 |
Top three noisy pixels from each quadrant. If the there are fewer than three noisy pixels in the level2.evt file, extra rows are filled as -1
| Pixel properties | Quadrant properties | ||||||
|---|---|---|---|---|---|---|---|
| Quadrant | DetID | PixID | Counts | Sigma | Mean | Median | Sigma |
| A | 12 | 189 | 37171 | 351.5 | 511 | 500 | 104.3 |
| A | 0 | 226 | 4745 | 40.69 | 511 | 500 | 104.3 |
| A | 12 | 194 | 3990 | 33.45 | 511 | 500 | 104.3 |
| B | 3 | 64 | 265949 | 2720.23 | 505 | 492 | 97.6 |
| B | 0 | 219 | 232065 | 2373.01 | 505 | 492 | 97.6 |
| B | 0 | 85 | 31729 | 320.09 | 505 | 492 | 97.6 |
| C | 3 | 233 | 455607 | 3977.63 | 492 | 495 | 114.4 |
| C | 3 | 232 | 4916 | 38.64 | 492 | 495 | 114.4 |
| C | 13 | 61 | 3624 | 27.35 | 492 | 495 | 114.4 |
| D | 12 | 233 | 110587 | 908.54 | 494 | 480 | 121.2 |
| D | 15 | 0 | 22778 | 183.99 | 494 | 480 | 121.2 |
| D | 2 | 234 | 15820 | 126.58 | 494 | 480 | 121.2 |
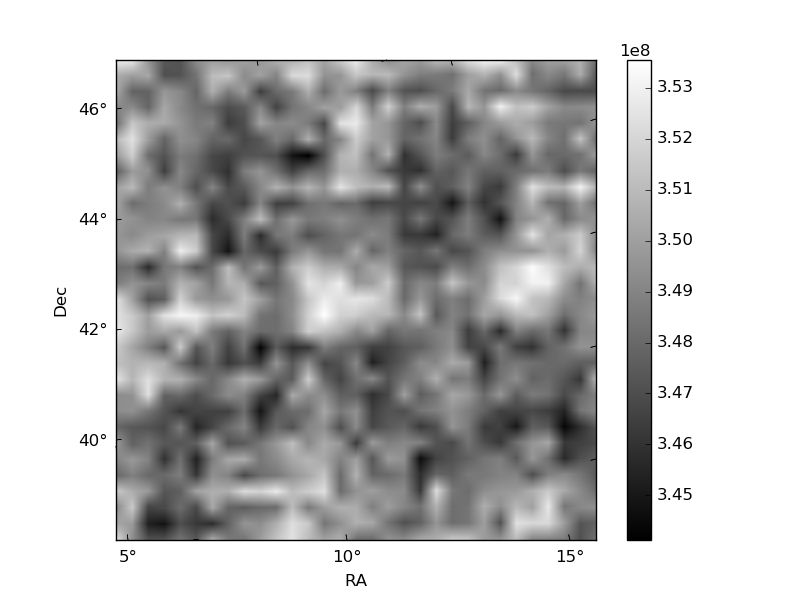
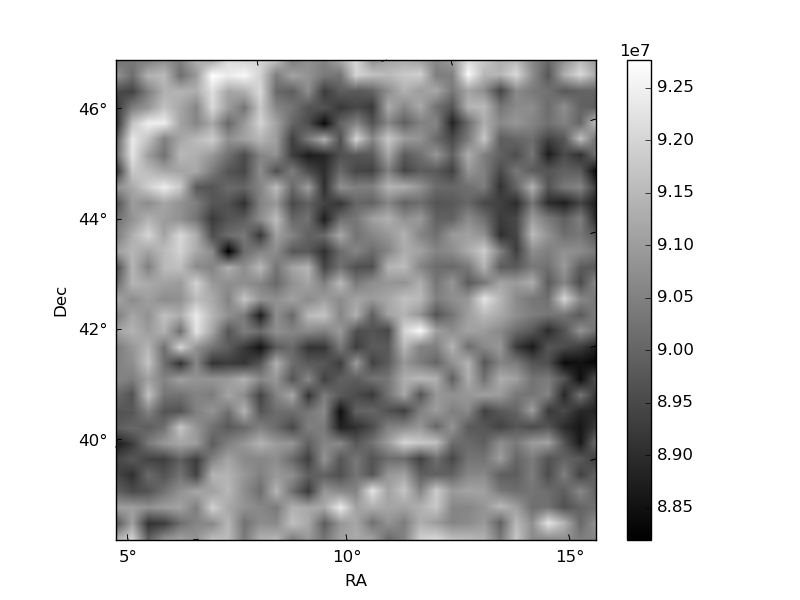
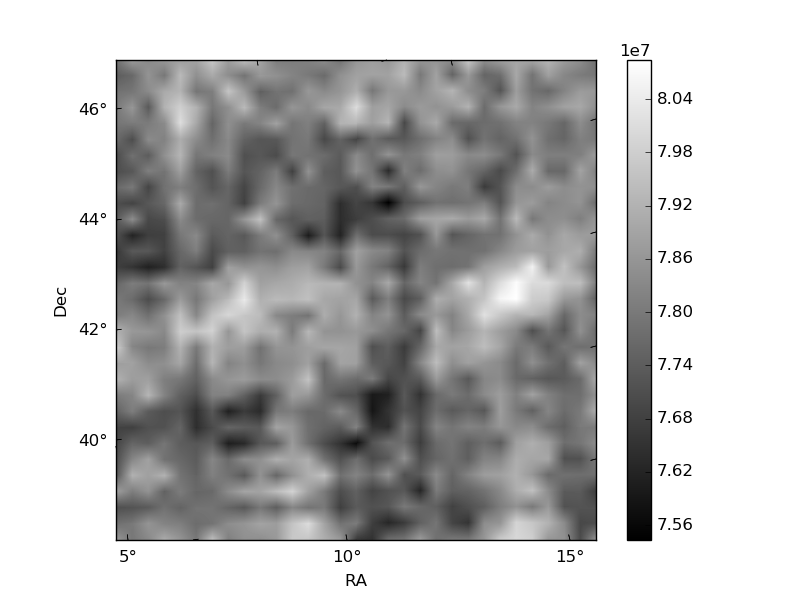
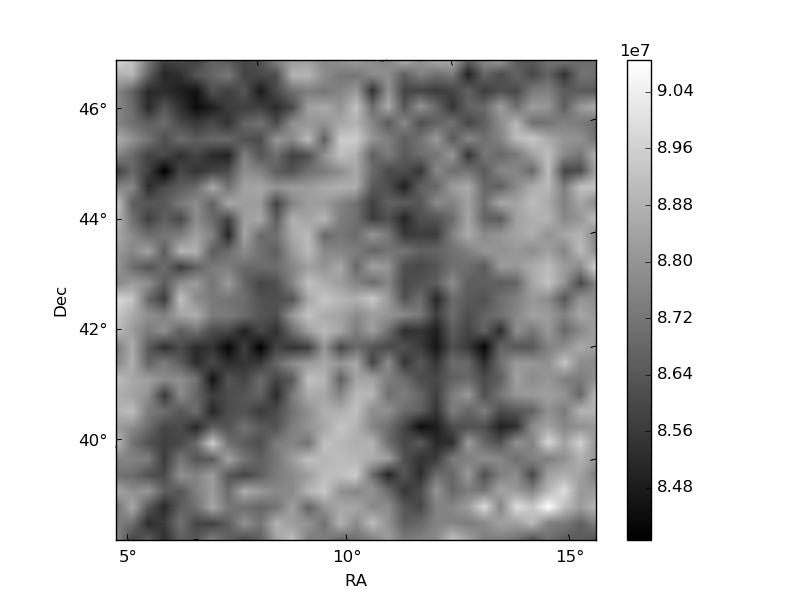
Histogram calculated using DETX and DETY for each event in the final _common_clean file
| Quadrant A | 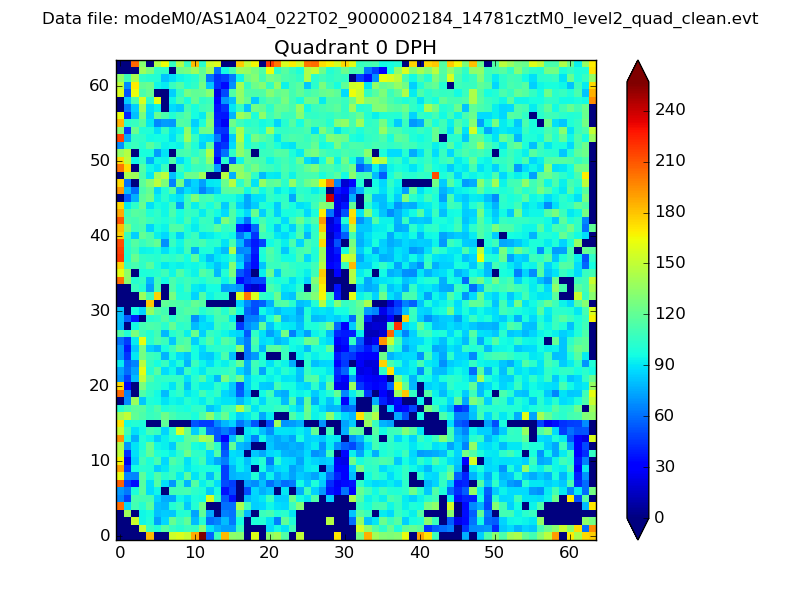 |
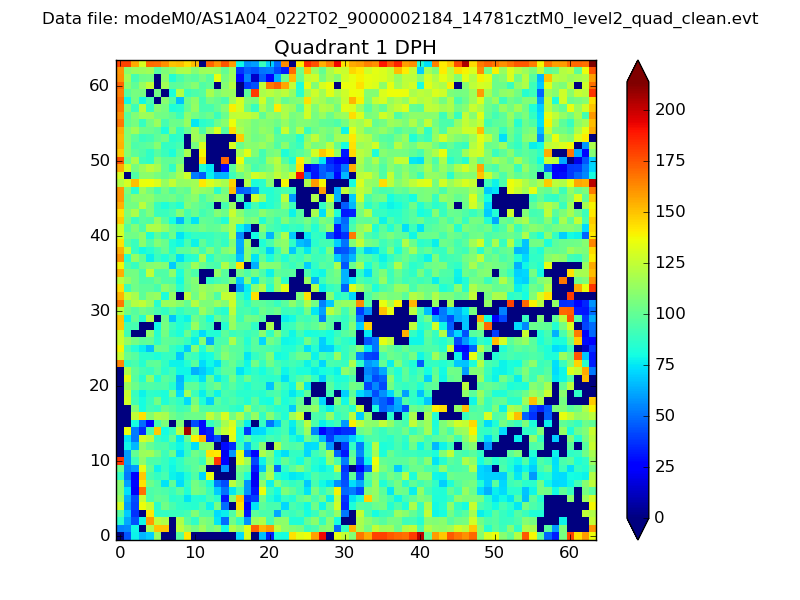 |
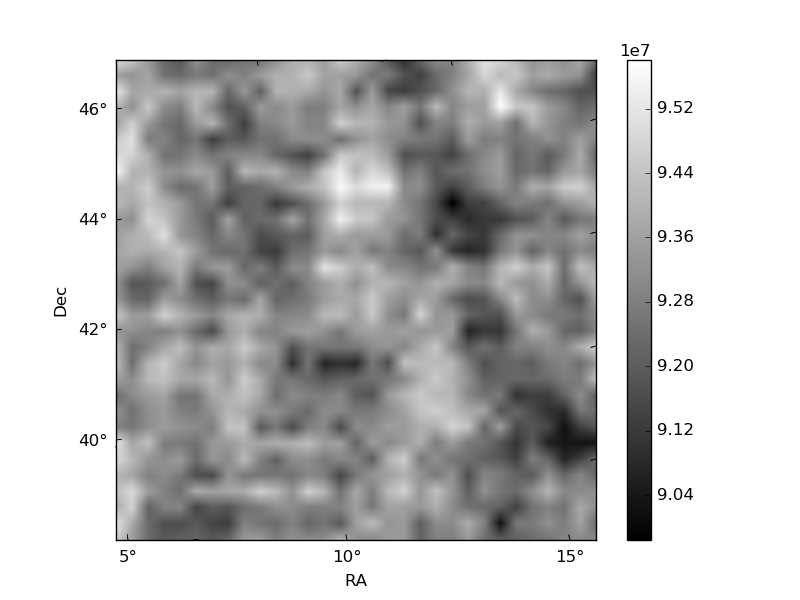
Quadrant B |
|---|---|---|---|
| Quadrant D | 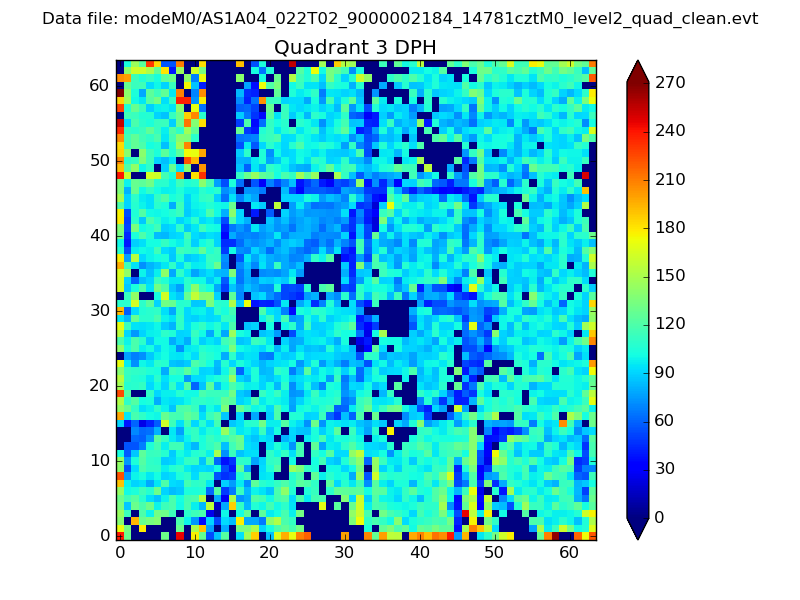 |
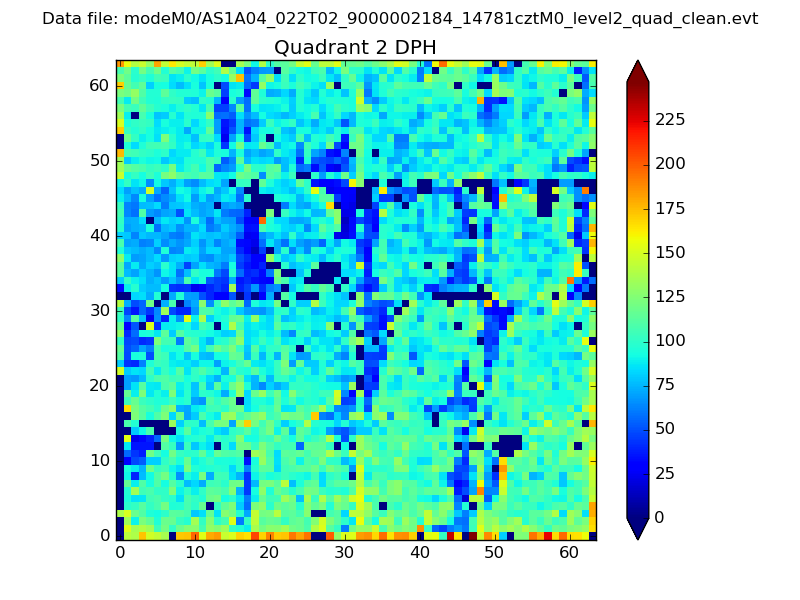 |
Quadrant C |
| Plot type | Count rate plots | Images |
|---|---|---|
| Comparison with Poisson distribution Blue bars denote a histogram of data divided into 1 sec bins. Red curve is a Poisson curve with rate = median count rate of data. |
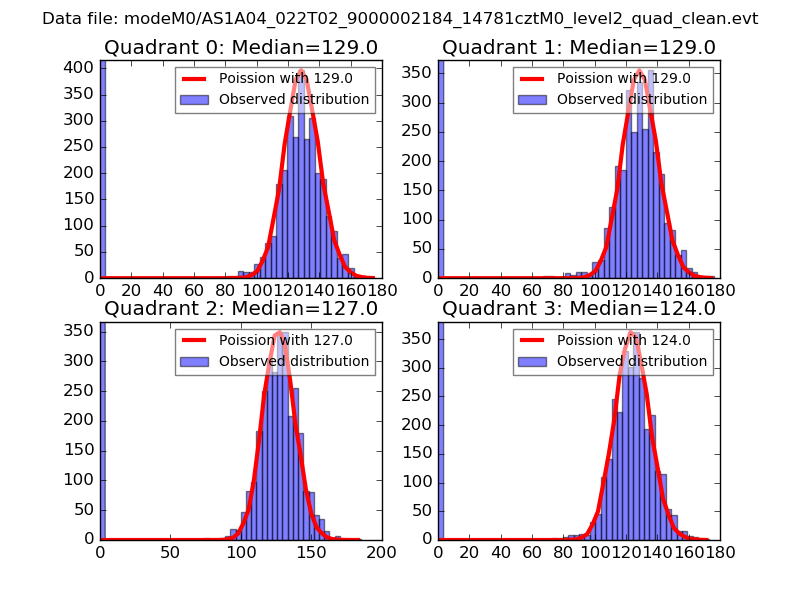 |
 |
| Quadrant-wise count rates Data is divided into 100 sec bins |
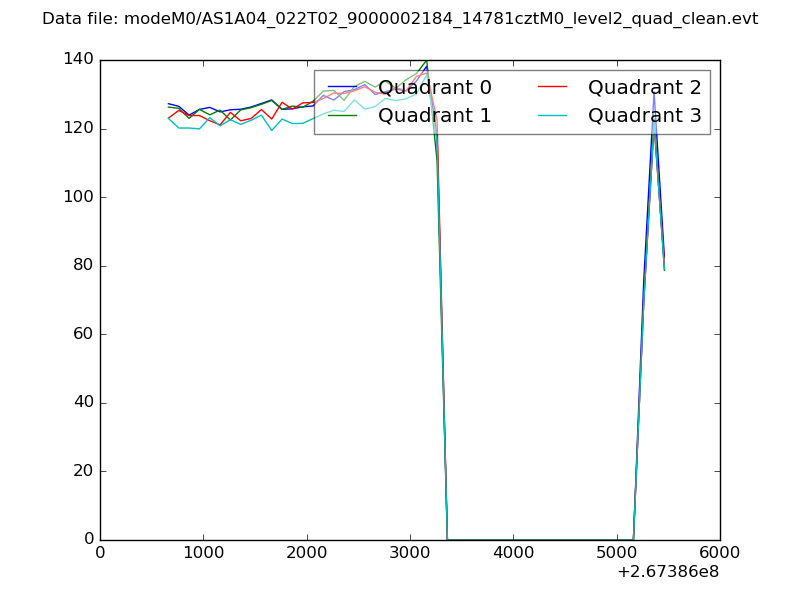 |
|
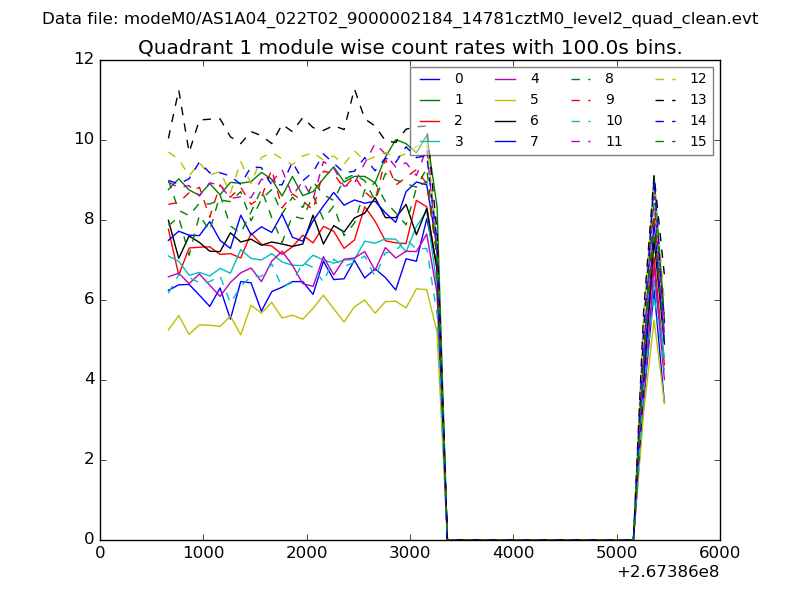
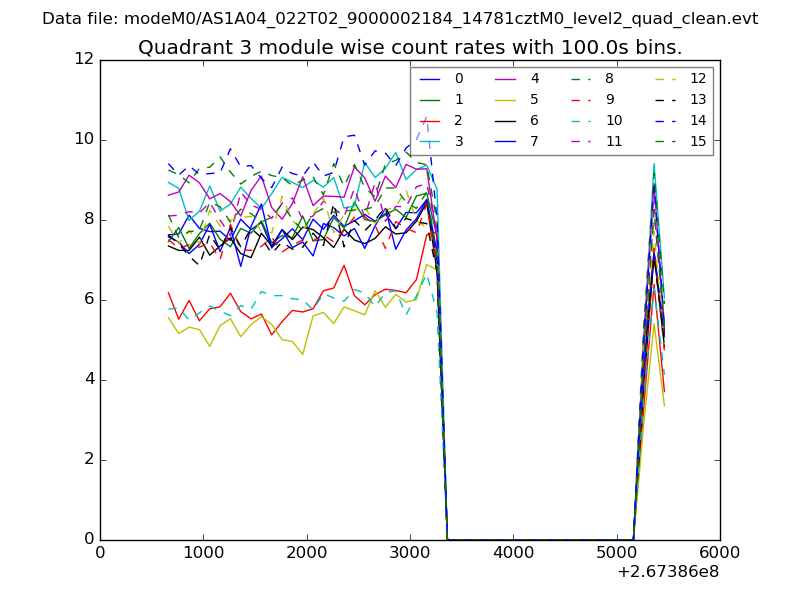
| Module-wise count rates for Quadrant A Data is divided into 100 sec bins |
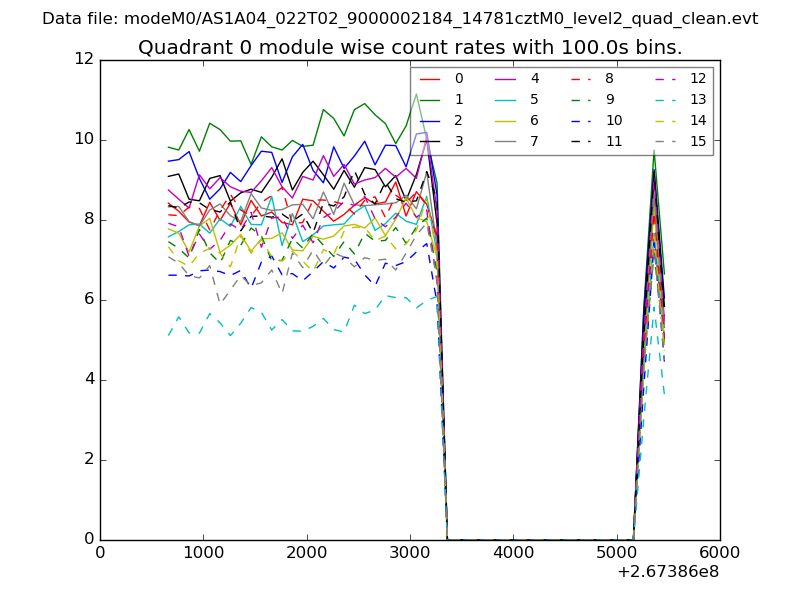 |
 |
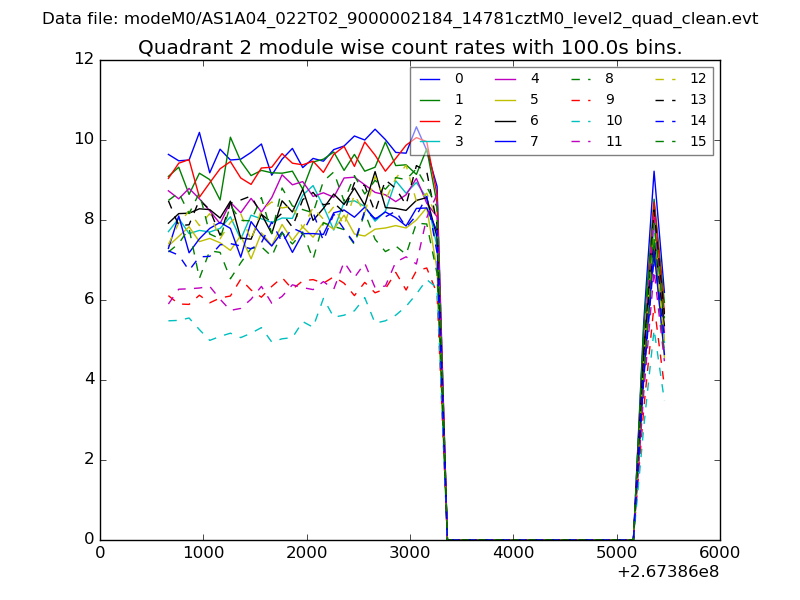
| Module-wise count rates for Quadrant B Data is divided into 100 sec bins |
 |
 |
| Module-wise count rates for Quadrant C Data is divided into 100 sec bins |
 |
 |
| Module-wise count rates for Quadrant D Data is divided into 100 sec bins |
 |
 |
| Parameter | Plot |
|---|---|
| CZT HV Monitor | 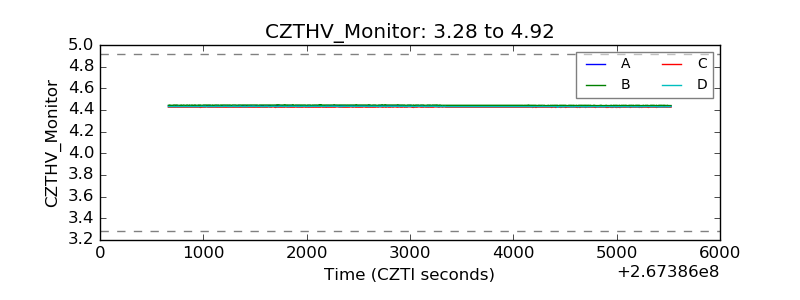 |
| D_VDD | 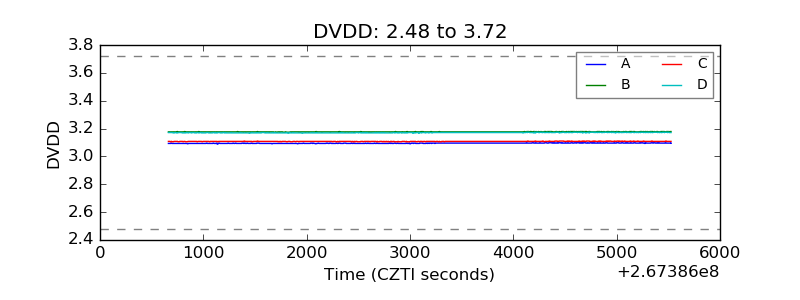 |
| Temperature 1 | 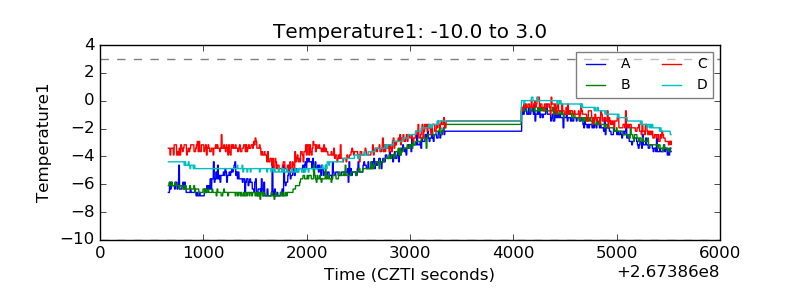 |
| Veto HV Monitor | 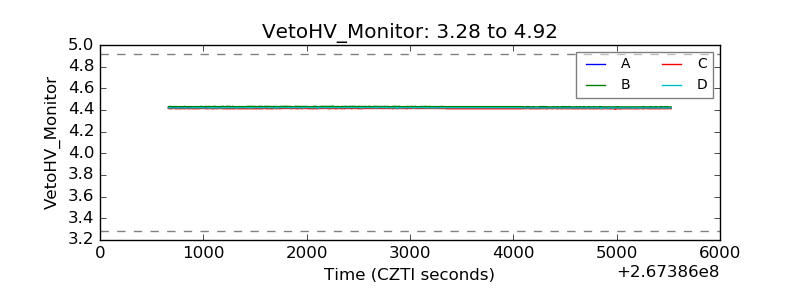 |
| Veto LLD | 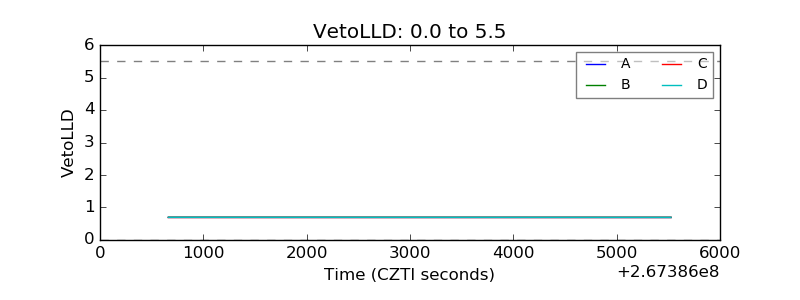 |
| Alpha Counter | 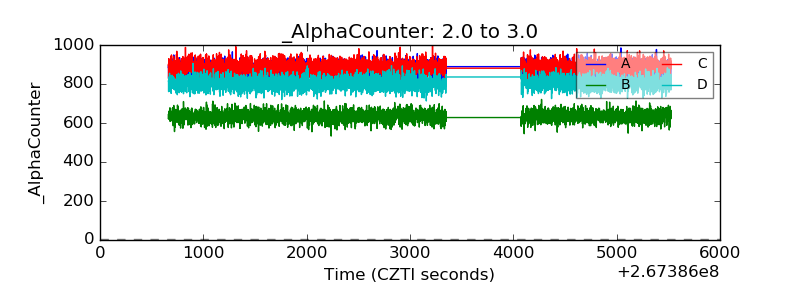 |
| _CPM_Rate | 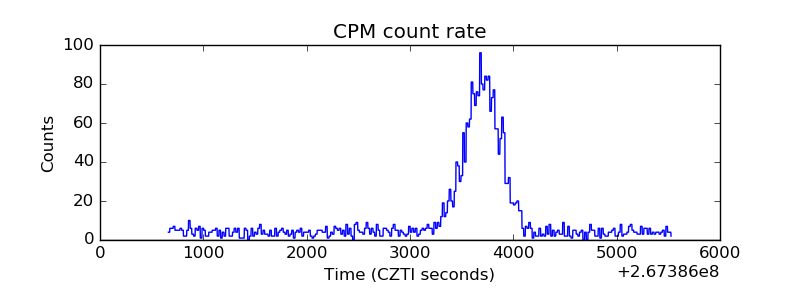 |
| CZT Counter | 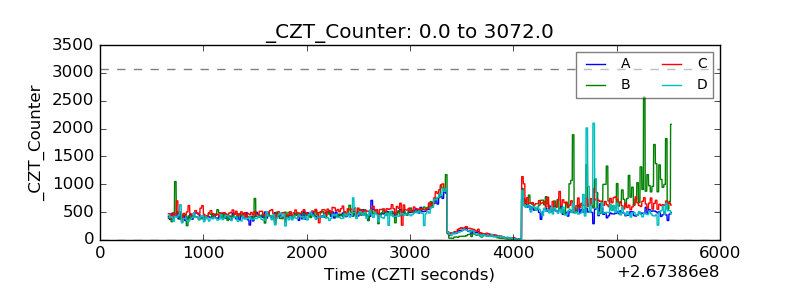 |
| +2.5 Volts monitor |  |
| +5 Volts monitor | 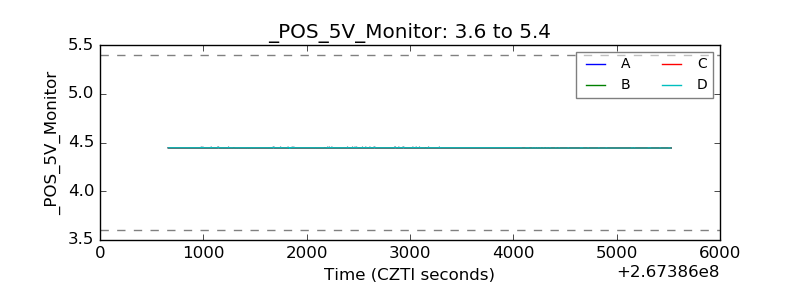 |
| _ROLL_ROT | 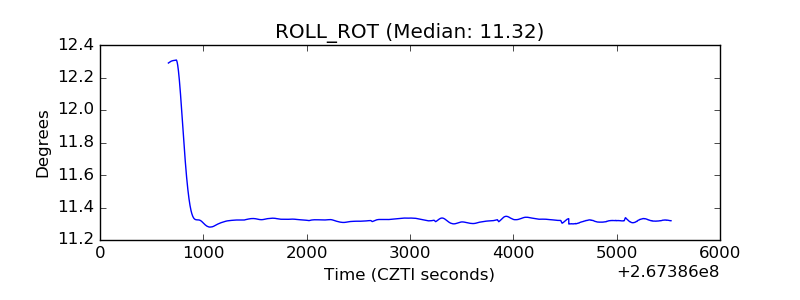 |
| _Roll_DEC | 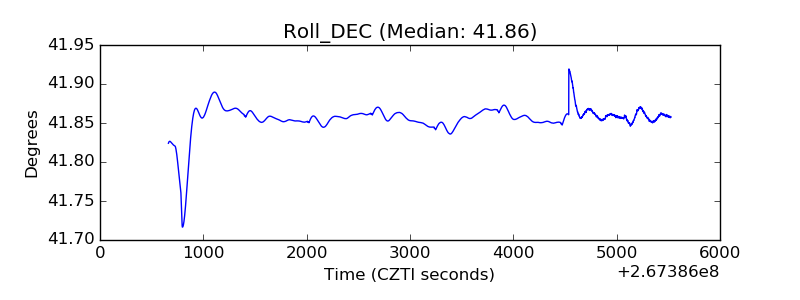 |
| _Roll_RA | 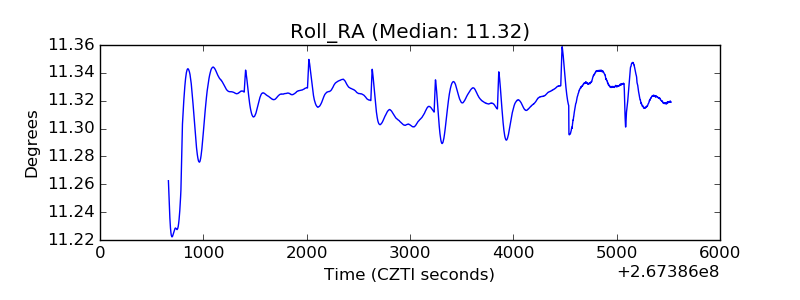 |
| Veto Counter | 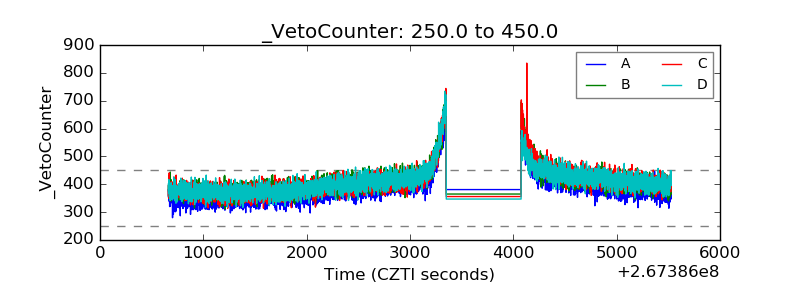 |