| Param | Original file | Final file |
|---|---|---|
| Filename | modeM0/AS1A04_022T02_9000002184_14782cztM0_level2.evt | modeM0/AS1A04_022T02_9000002184_14782cztM0_level2_quad_clean.evt |
| Size (bytes) | 591,750,720 | 89,334,720 |
| Size | 564.3 MB | 85.2 MB |
| Events in quadrant A | 4,322,222 | 559,455 |
| Events in quadrant B | 5,134,654 | 547,038 |
| Events in quadrant C | 4,398,393 | 551,070 |
| Events in quadrant D | 3,575,504 | 543,660 |
| Mode M0 | |||
|---|---|---|---|
| Quadrant | BADHDUFLAG | Total packets | Discarded packets |
| A | 0 | 17640 | 2 |
| B | 0 | 20169 | 1 |
| C | 0 | 18126 | 1 |
| D | 0 | 15670 | 1 |
| Mode M9 | |||
|---|---|---|---|
| Quadrant | BADHDUFLAG | Total packets | Discarded packets |
| A | 0 | 3 | 0 |
| B | 0 | 3 | 0 |
| C | 0 | 3 | 0 |
| D | 0 | 3 | 0 |
| Mode SS | |||
|---|---|---|---|
| Quadrant | BADHDUFLAG | Total packets | Discarded packets |
| A | 0 | 146 | 0 |
| B | 0 | 146 | 0 |
| C | 0 | 146 | 0 |
| D | 0 | 146 | 0 |
| Quadrant | Total seconds | Saturated seconds | Saturation percentage |
|---|---|---|---|
| A | 7240 | 278 | 3.839779% |
| B | 7240 | 413 | 5.704420% |
| C | 7240 | 85 | 1.174033% |
| D | 7240 | 116 | 1.602210% |
Noise dominated data is calculated using 1-second bins in cleaned event files. If a bin has >2000 counts, and if more than 50% of those come from <1% of pixels, then it is considered to be noise-dominated and hence unusable.
| Quadrant | # 1 sec bins | Bins with >0 counts | Bins with >2000 counts | High rate bins dominated by noise | Noise dominated (total time) | Noise dominated (detector-on time) | Marked lightcurve |
|---|---|---|---|---|---|---|---|
| A | 7501 | 7242 | 179 | 179 | 2.39% | 2.47% | 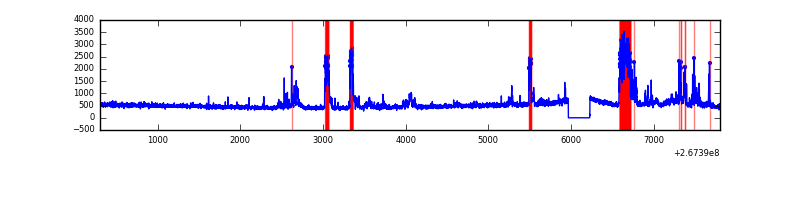 |
| B | 7501 | 7242 | 126 | 126 | 1.68% | 1.74% | 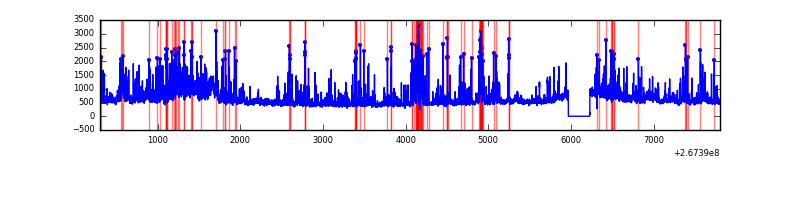 |
| C | 7501 | 7242 | 1 | 1 | 0.01% | 0.01% | 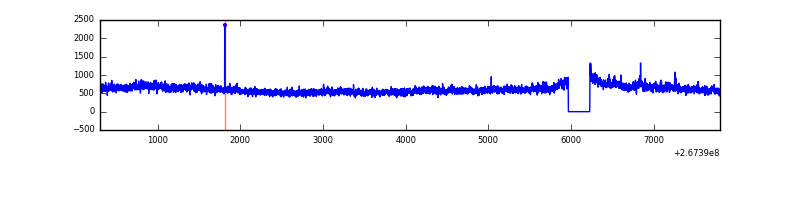 |
| D | 7501 | 7242 | 57 | 57 | 0.76% | 0.79% | 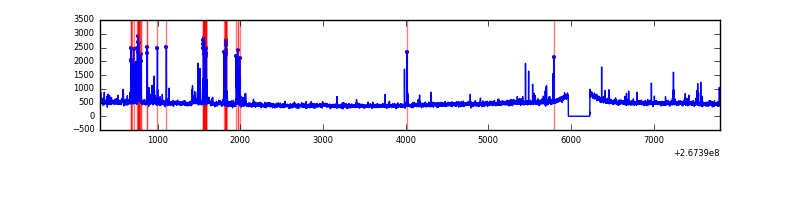 |
Top three noisy pixels from each quadrant. If the there are fewer than three noisy pixels in the level2.evt file, extra rows are filled as -1
| Pixel properties | Quadrant properties | ||||||
|---|---|---|---|---|---|---|---|
| Quadrant | DetID | PixID | Counts | Sigma | Mean | Median | Sigma |
| A | 14 | 237 | 895950 | 5053.13 | 864 | 845 | 177.1 |
| A | 12 | 189 | 90402 | 505.58 | 864 | 845 | 177.1 |
| A | 0 | 226 | 7971 | 40.23 | 864 | 845 | 177.1 |
| B | 3 | 64 | 1063531 | 6514.4 | 860 | 839 | 163.1 |
| B | 0 | 219 | 477427 | 2921.53 | 860 | 839 | 163.1 |
| B | 0 | 229 | 48481 | 292.05 | 860 | 839 | 163.1 |
| C | 3 | 233 | 1062051 | 5416.88 | 846 | 849 | 195.9 |
| C | 7 | 247 | 12278 | 58.34 | 846 | 849 | 195.9 |
| C | 3 | 232 | 11678 | 55.28 | 846 | 849 | 195.9 |
| D | 15 | 0 | 145188 | 688.21 | 854 | 827 | 209.8 |
| D | 12 | 233 | 102515 | 484.78 | 854 | 827 | 209.8 |
| D | 2 | 234 | 30332 | 140.66 | 854 | 827 | 209.8 |
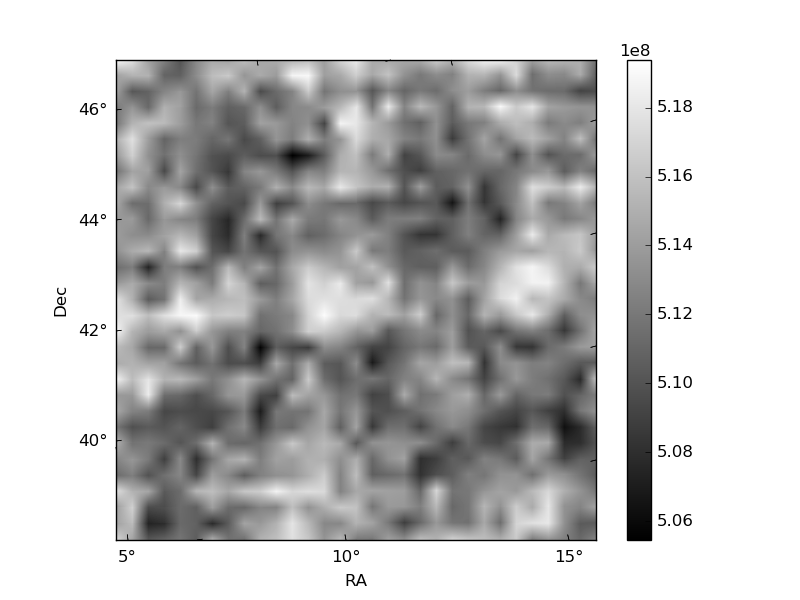
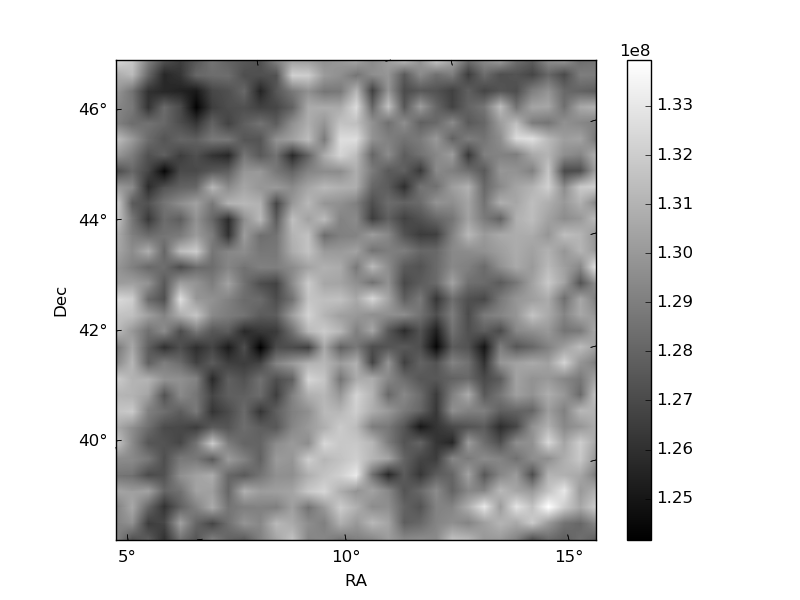
Histogram calculated using DETX and DETY for each event in the final _common_clean file
| Quadrant A | 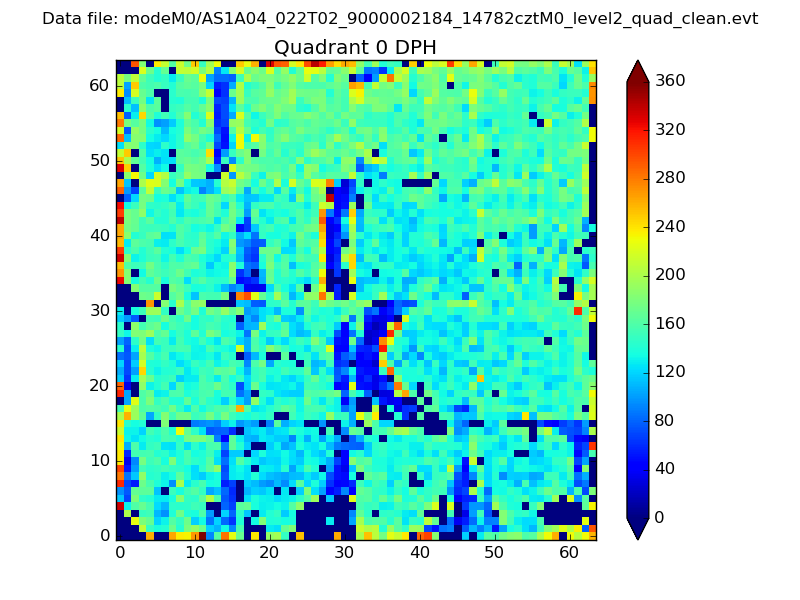 |
 |
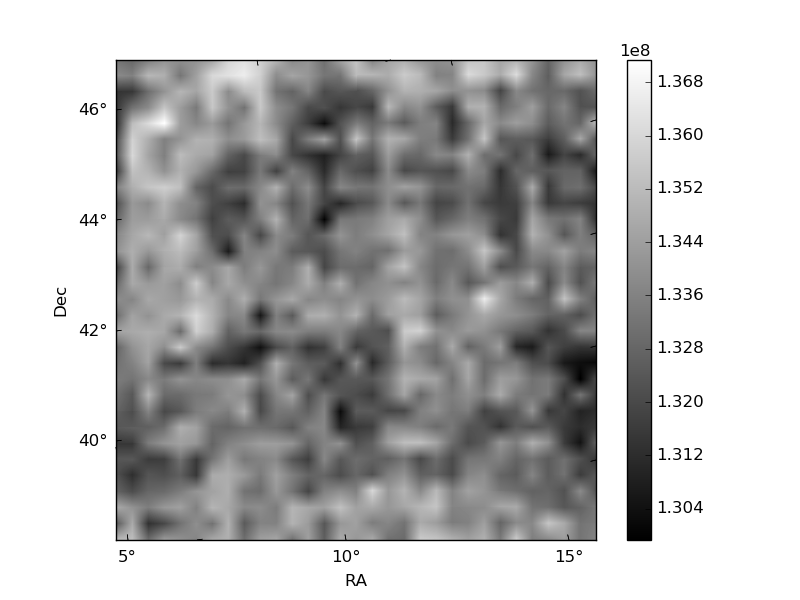
Quadrant B |
|---|---|---|---|
| Quadrant D | 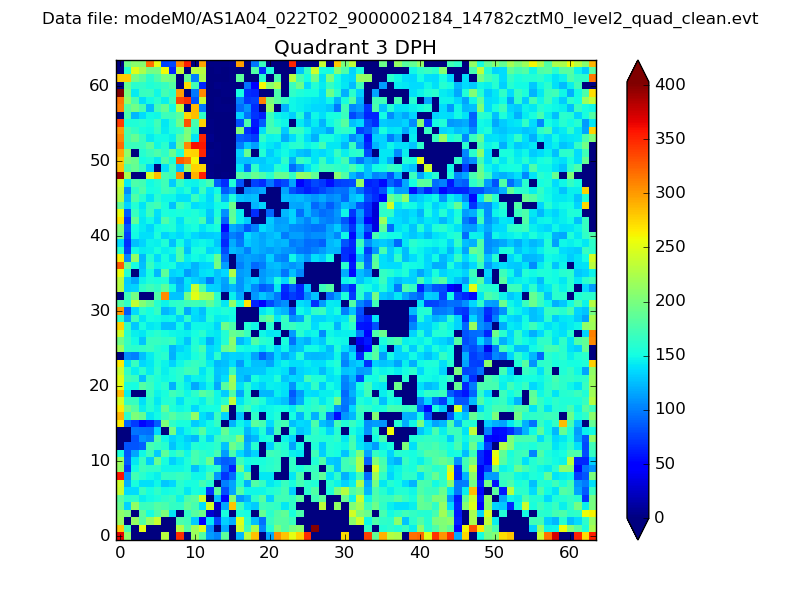 |
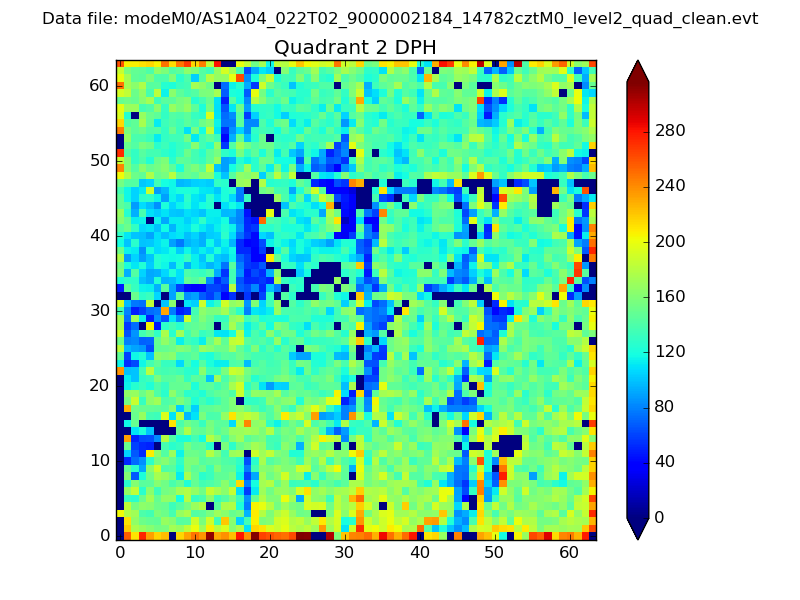 |
Quadrant C |
| Plot type | Count rate plots | Images |
|---|---|---|
| Comparison with Poisson distribution Blue bars denote a histogram of data divided into 1 sec bins. Red curve is a Poisson curve with rate = median count rate of data. |
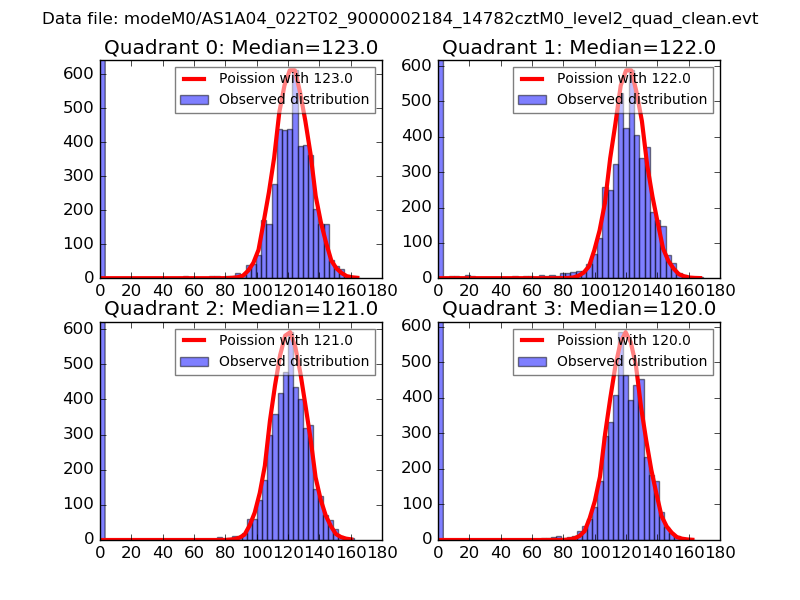 |
 |
| Quadrant-wise count rates Data is divided into 100 sec bins |
 |
|
| Module-wise count rates for Quadrant A Data is divided into 100 sec bins |
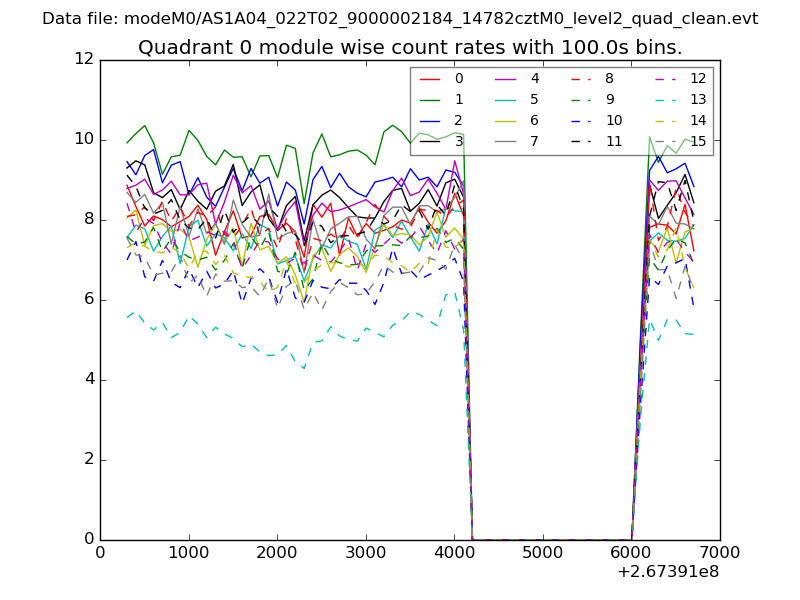 |
 |
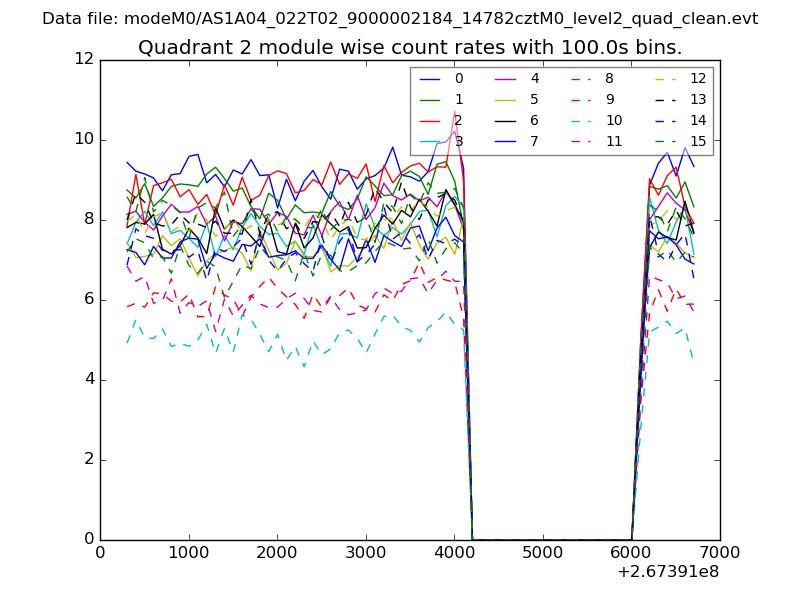
| Module-wise count rates for Quadrant B Data is divided into 100 sec bins |
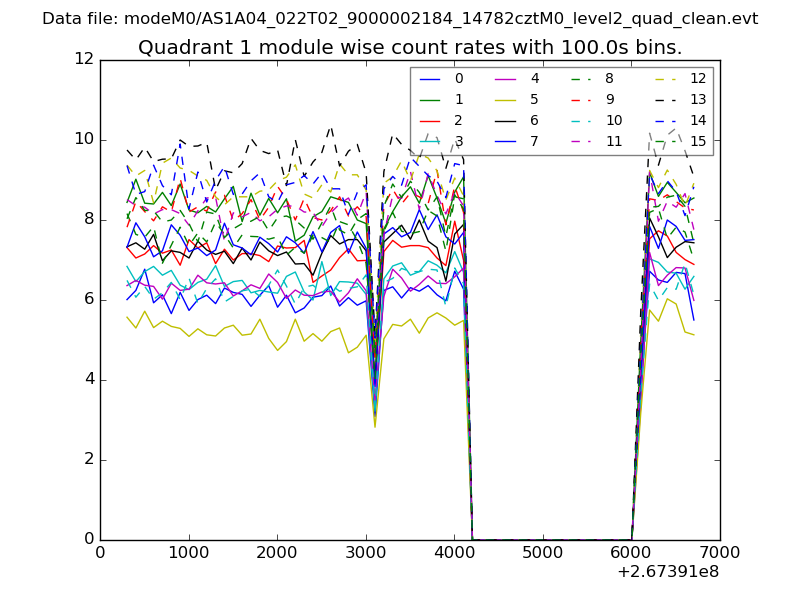 |
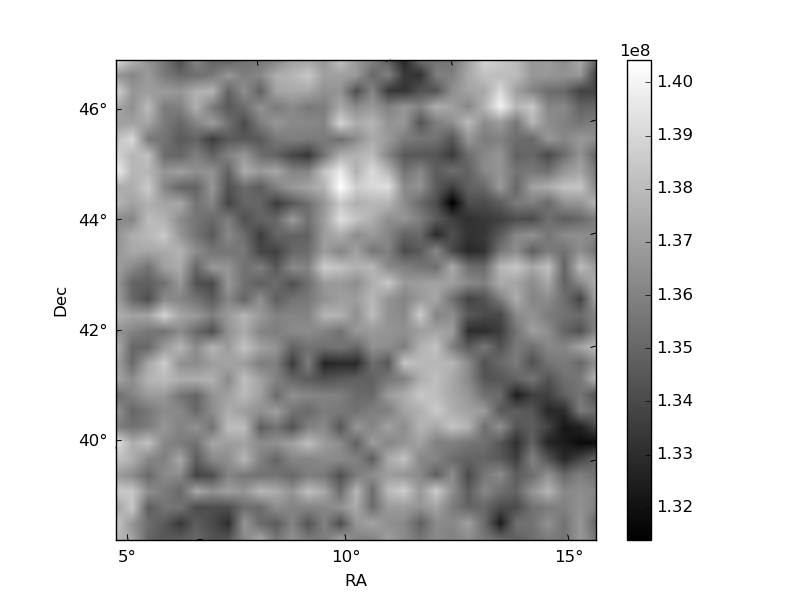 |
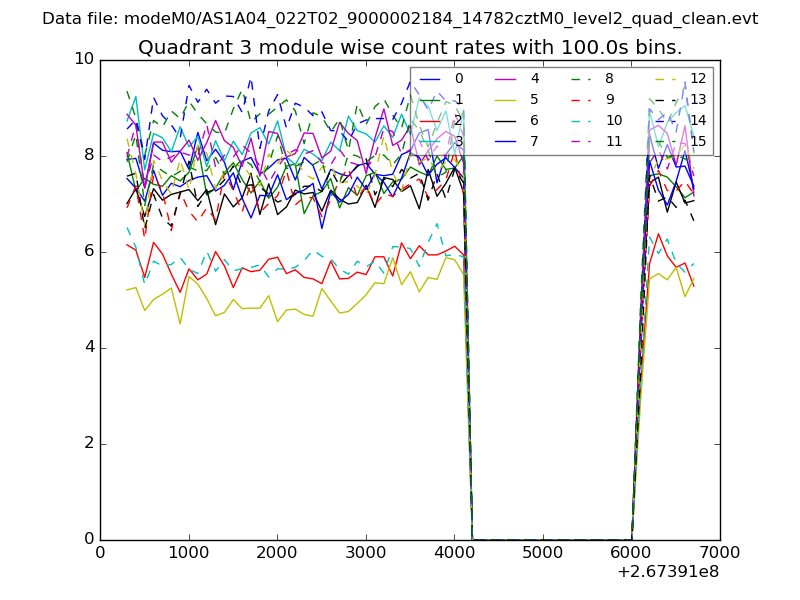
| Module-wise count rates for Quadrant C Data is divided into 100 sec bins |
 |
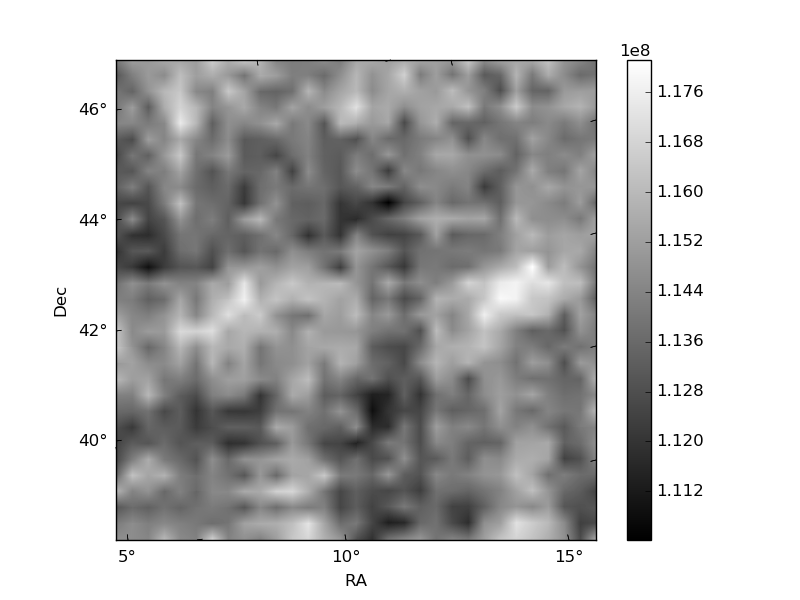 |
| Module-wise count rates for Quadrant D Data is divided into 100 sec bins |
 |
 |
| Parameter | Plot |
|---|---|
| CZT HV Monitor | 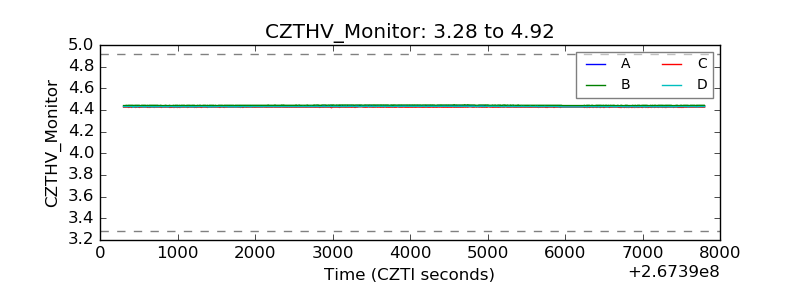 |
| D_VDD | 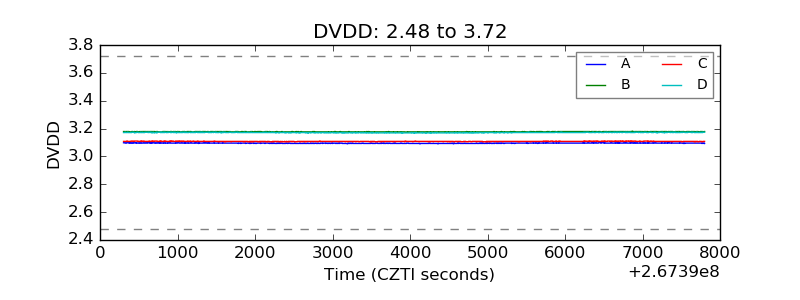 |
| Temperature 1 | 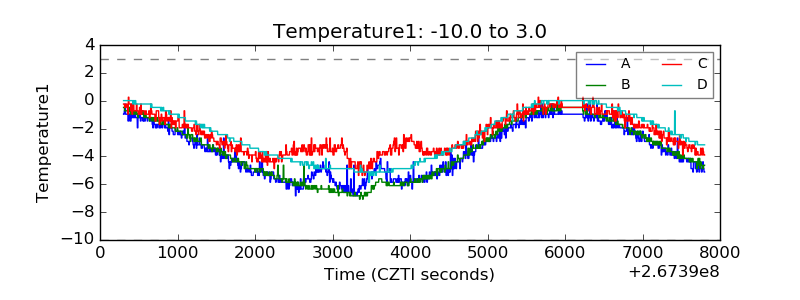 |
| Veto HV Monitor |  |
| Veto LLD |  |
| Alpha Counter | 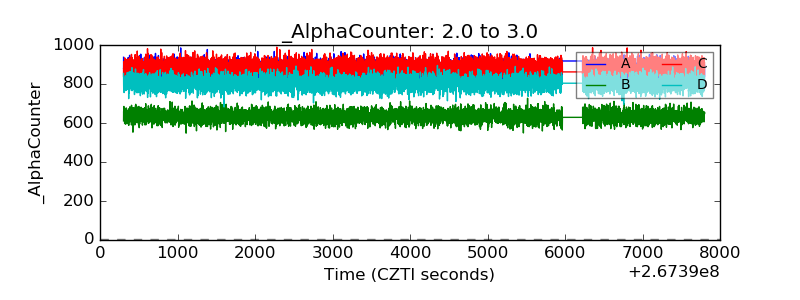 |
| _CPM_Rate | 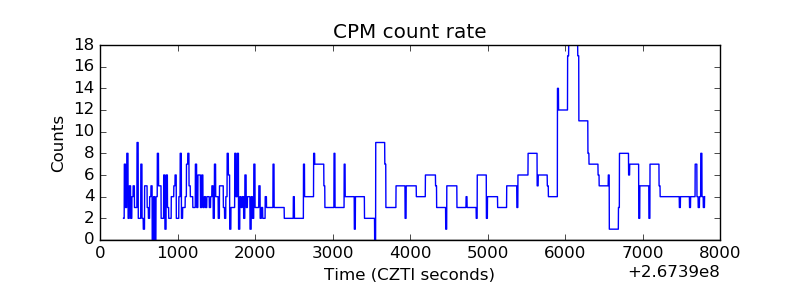 |
| CZT Counter | 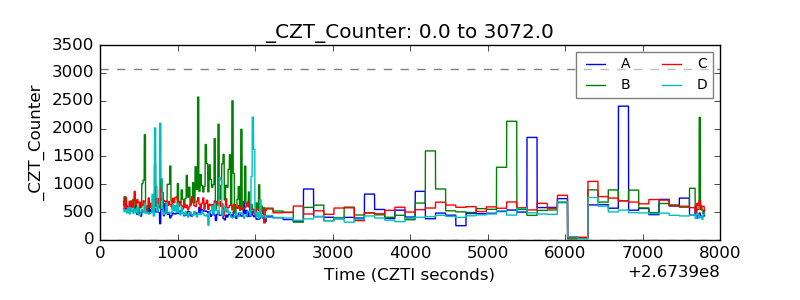 |
| +2.5 Volts monitor |  |
| +5 Volts monitor |  |
| _ROLL_ROT | 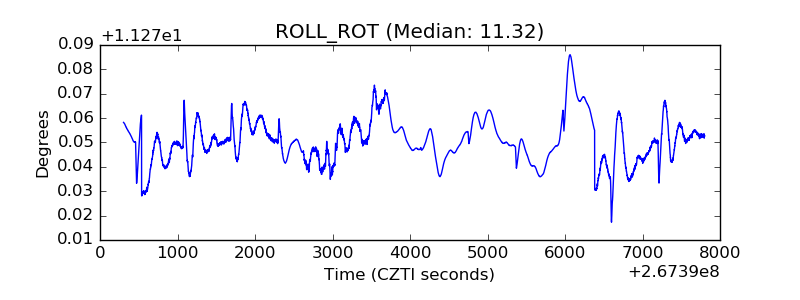 |
| _Roll_DEC | 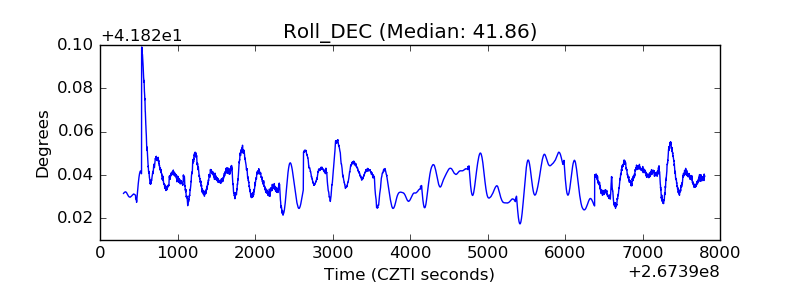 |
| _Roll_RA | 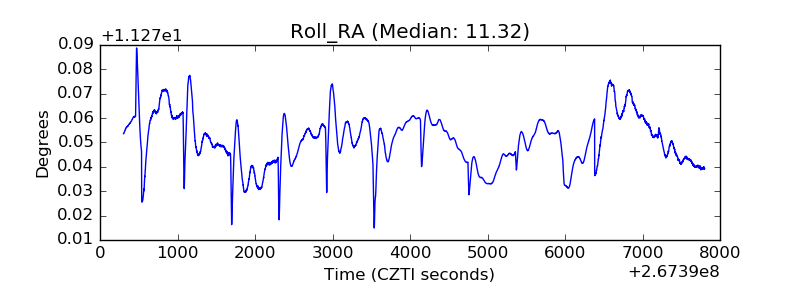 |
| Veto Counter | 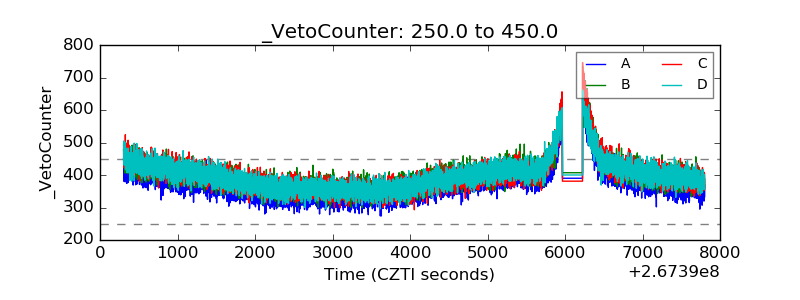 |