| Param | Original file | Final file |
|---|---|---|
| Filename | modeM0/AS1A04_022T02_9000002184_14783cztM0_level2.evt | modeM0/AS1A04_022T02_9000002184_14783cztM0_level2_quad_clean.evt |
| Size (bytes) | 591,782,400 | 97,012,800 |
| Size | 564.4 MB | 92.5 MB |
| Events in quadrant A | 4,227,990 | 611,912 |
| Events in quadrant B | 4,786,550 | 608,854 |
| Events in quadrant C | 4,754,555 | 601,965 |
| Events in quadrant D | 3,641,114 | 589,504 |
| Mode M0 | |||
|---|---|---|---|
| Quadrant | BADHDUFLAG | Total packets | Discarded packets |
| A | 0 | 17714 | 2 |
| B | 0 | 19474 | 1 |
| C | 0 | 19348 | 1 |
| D | 0 | 16120 | 1 |
| Mode M9 | |||
|---|---|---|---|
| Quadrant | BADHDUFLAG | Total packets | Discarded packets |
| A | 0 | 3 | 0 |
| B | 0 | 3 | 0 |
| C | 0 | 3 | 0 |
| D | 0 | 3 | 0 |
| Mode SS | |||
|---|---|---|---|
| Quadrant | BADHDUFLAG | Total packets | Discarded packets |
| A | 0 | 152 | 0 |
| B | 0 | 152 | 0 |
| C | 0 | 152 | 0 |
| D | 0 | 152 | 0 |
| Quadrant | Total seconds | Saturated seconds | Saturation percentage |
|---|---|---|---|
| A | 7560 | 190 | 2.513228% |
| B | 7560 | 271 | 3.584656% |
| C | 7560 | 69 | 0.912698% |
| D | 7560 | 74 | 0.978836% |
Noise dominated data is calculated using 1-second bins in cleaned event files. If a bin has >2000 counts, and if more than 50% of those come from <1% of pixels, then it is considered to be noise-dominated and hence unusable.
| Quadrant | # 1 sec bins | Bins with >0 counts | Bins with >2000 counts | High rate bins dominated by noise | Noise dominated (total time) | Noise dominated (detector-on time) | Marked lightcurve |
|---|---|---|---|---|---|---|---|
| A | 7821 | 7563 | 121 | 121 | 1.55% | 1.60% | 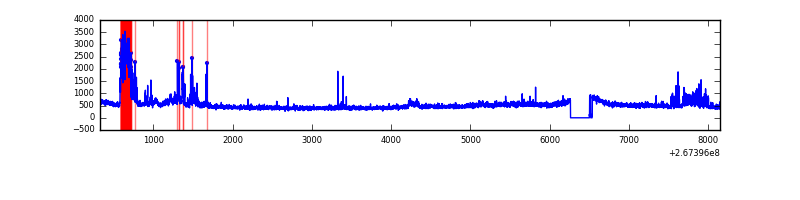 |
| B | 7821 | 7563 | 116 | 116 | 1.48% | 1.53% | 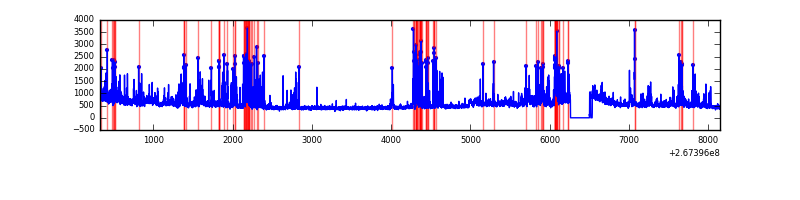 |
| C | 7821 | 7563 | 0 | 0 | 0.00% | 0.00% | 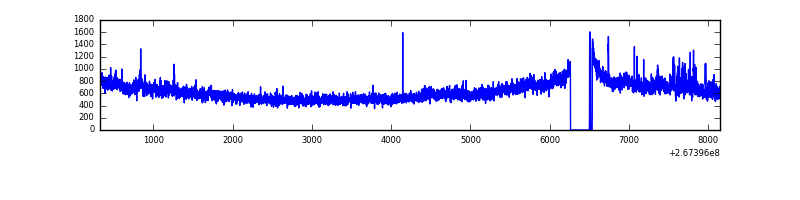 |
| D | 7821 | 7563 | 52 | 52 | 0.66% | 0.69% | 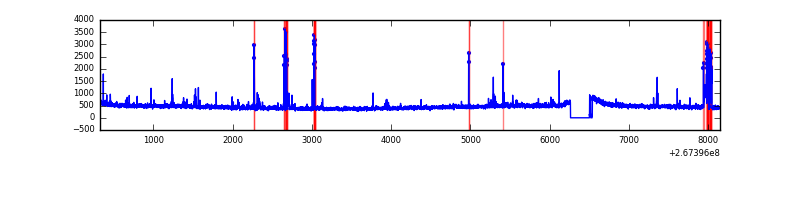 |
Top three noisy pixels from each quadrant. If the there are fewer than three noisy pixels in the level2.evt file, extra rows are filled as -1
| Pixel properties | Quadrant properties | ||||||
|---|---|---|---|---|---|---|---|
| Quadrant | DetID | PixID | Counts | Sigma | Mean | Median | Sigma |
| A | 14 | 237 | 554211 | 2987.16 | 900 | 880 | 185.2 |
| A | 0 | 23 | 108445 | 580.69 | 900 | 880 | 185.2 |
| A | 12 | 189 | 78373 | 418.35 | 900 | 880 | 185.2 |
| B | 3 | 64 | 846181 | 4923.72 | 902 | 878 | 171.7 |
| B | 0 | 219 | 192521 | 1116.28 | 902 | 878 | 171.7 |
| B | 0 | 229 | 43735 | 249.63 | 902 | 878 | 171.7 |
| C | 3 | 233 | 1270683 | 6237.46 | 879 | 879 | 203.6 |
| C | 3 | 232 | 22149 | 104.48 | 879 | 879 | 203.6 |
| C | 0 | 207 | 13823 | 63.58 | 879 | 879 | 203.6 |
| D | 15 | 0 | 225328 | 1035.65 | 886 | 857 | 216.7 |
| D | 2 | 234 | 31650 | 142.07 | 886 | 857 | 216.7 |
| D | 10 | 70 | 29740 | 133.26 | 886 | 857 | 216.7 |
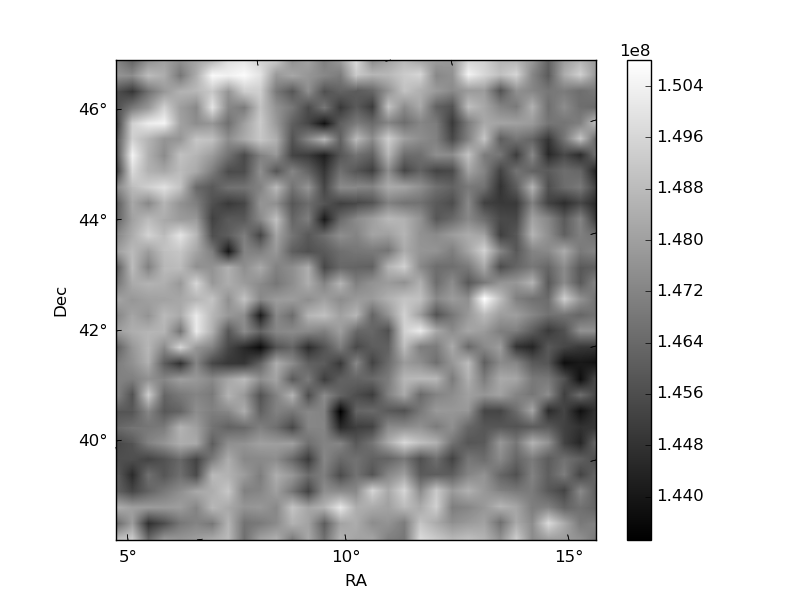
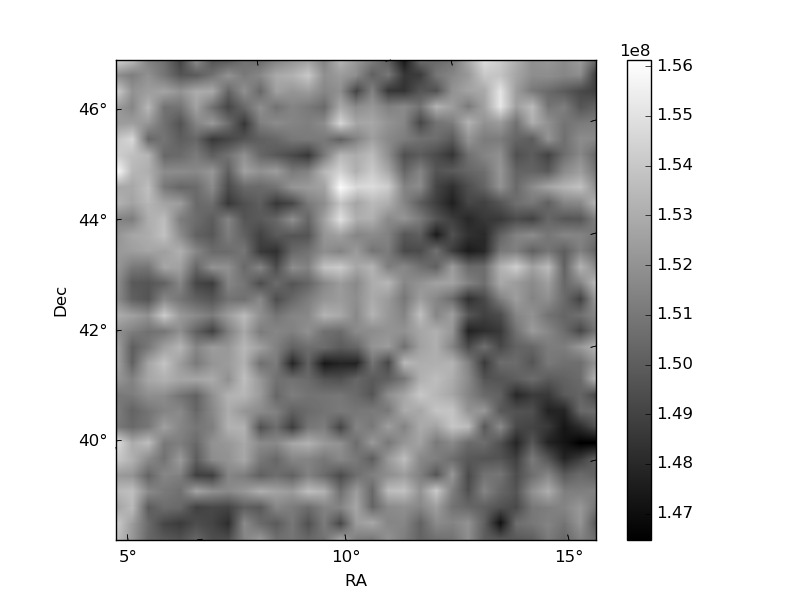
Histogram calculated using DETX and DETY for each event in the final _common_clean file
| Quadrant A | 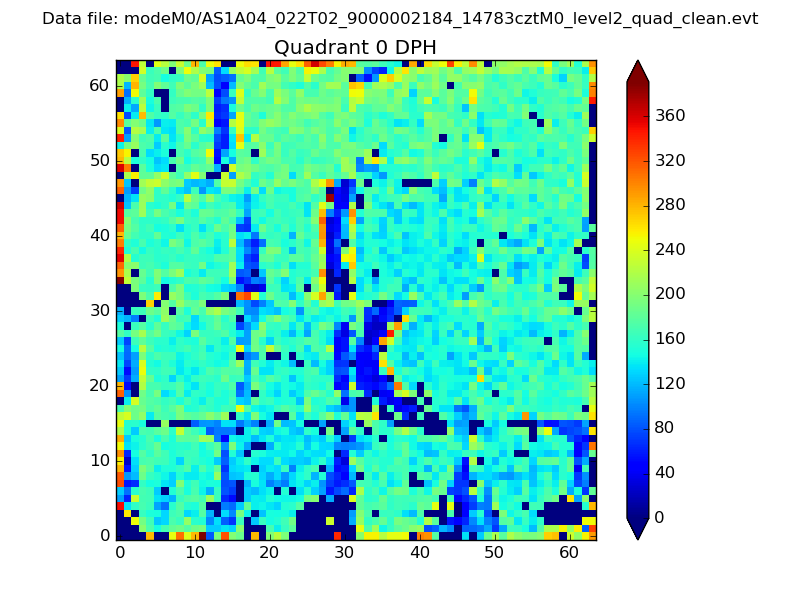 |
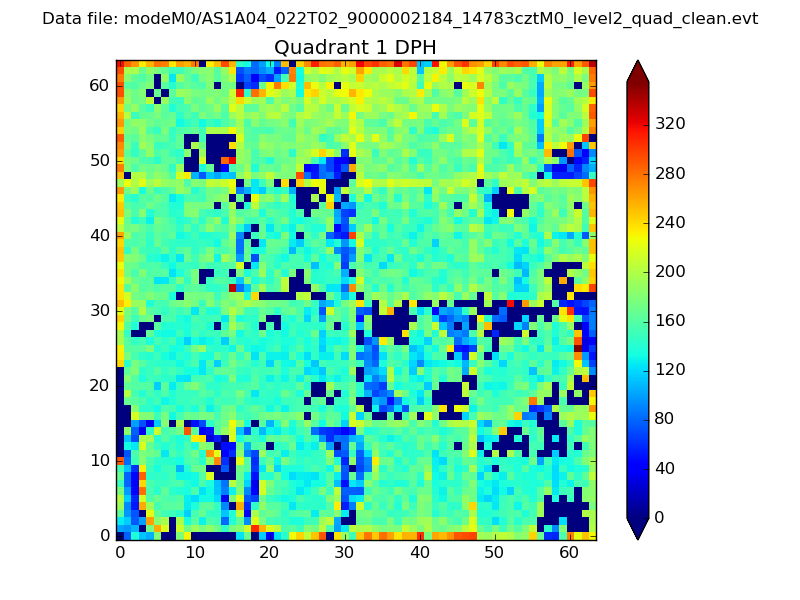 |
Quadrant B |
|---|---|---|---|
| Quadrant D |  |
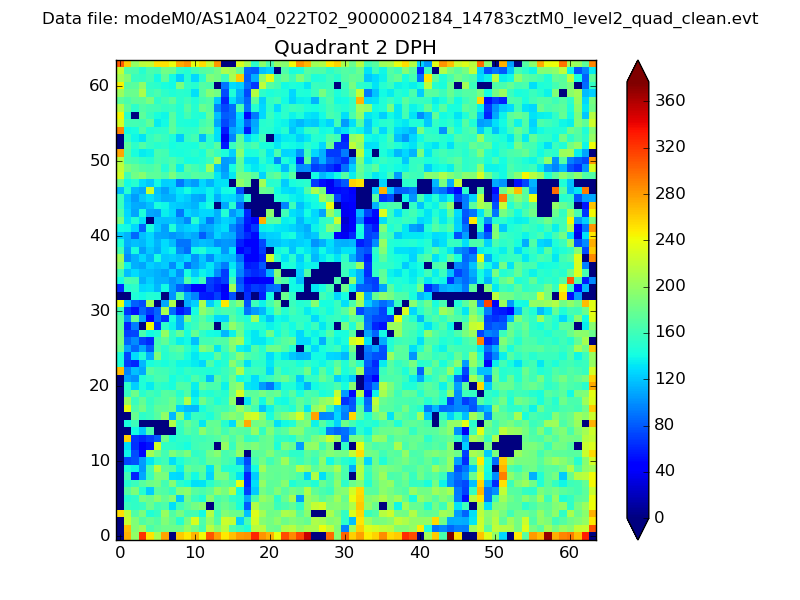 |
Quadrant C |
| Plot type | Count rate plots | Images |
|---|---|---|
| Comparison with Poisson distribution Blue bars denote a histogram of data divided into 1 sec bins. Red curve is a Poisson curve with rate = median count rate of data. |
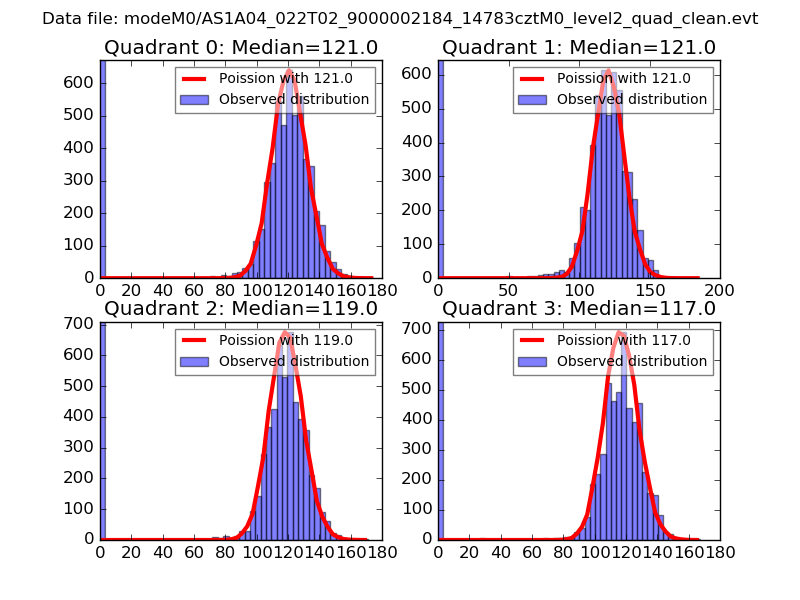 |
 |
| Quadrant-wise count rates Data is divided into 100 sec bins |
 |
|
| Module-wise count rates for Quadrant A Data is divided into 100 sec bins |
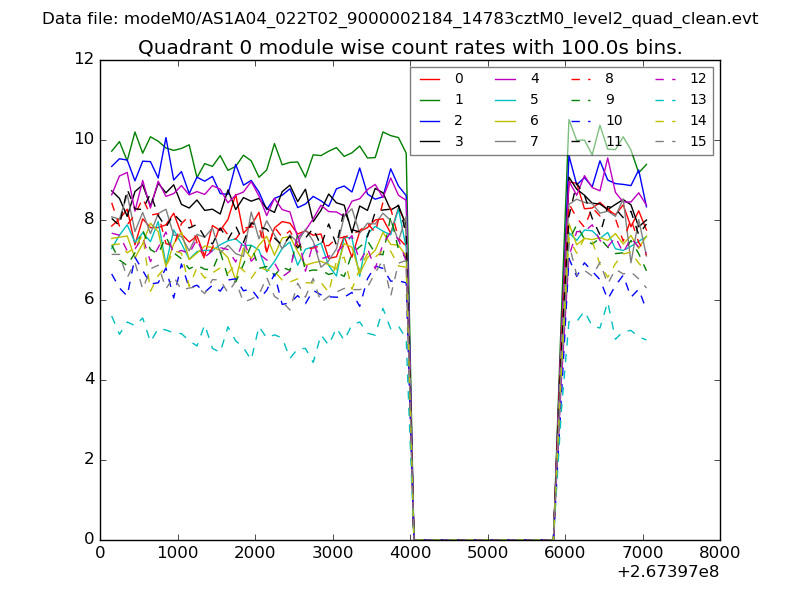 |
 |
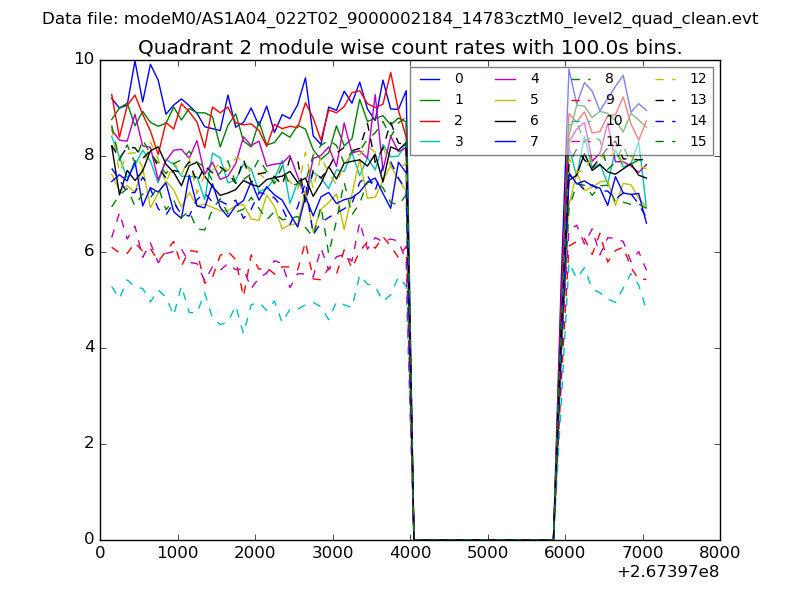
| Module-wise count rates for Quadrant B Data is divided into 100 sec bins |
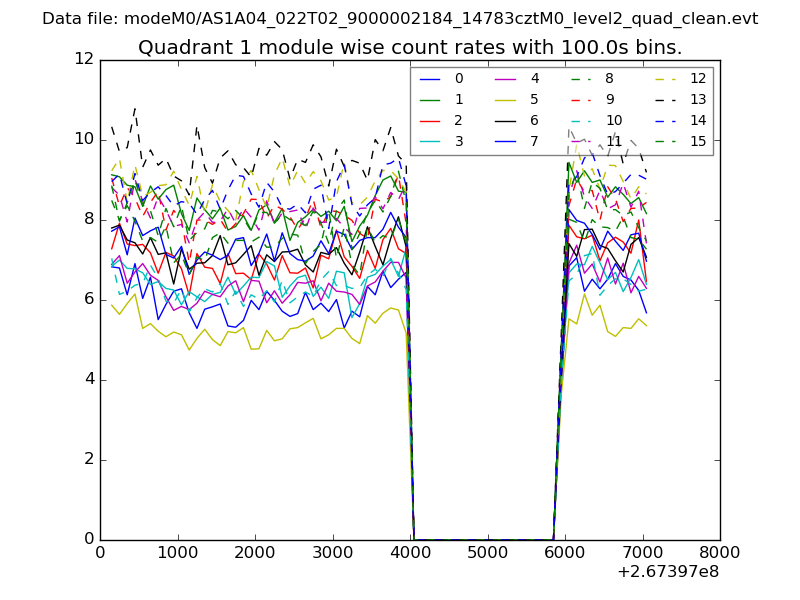 |
 |
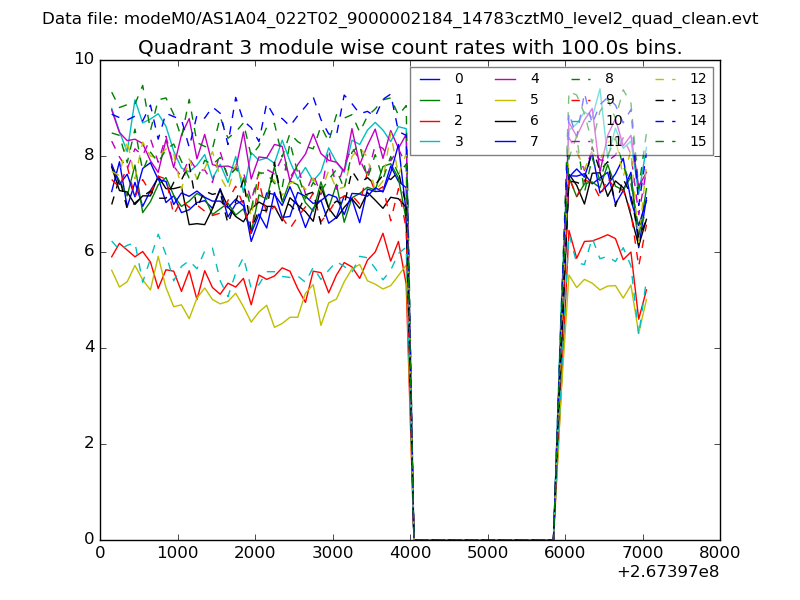
| Module-wise count rates for Quadrant C Data is divided into 100 sec bins |
 |
 |
| Module-wise count rates for Quadrant D Data is divided into 100 sec bins |
 |
 |
| Parameter | Plot |
|---|---|
| CZT HV Monitor | 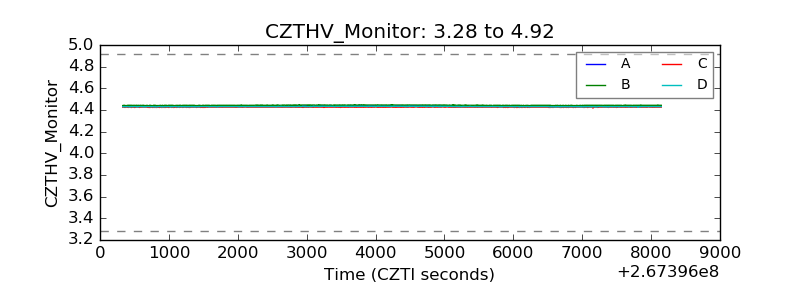 |
| D_VDD | 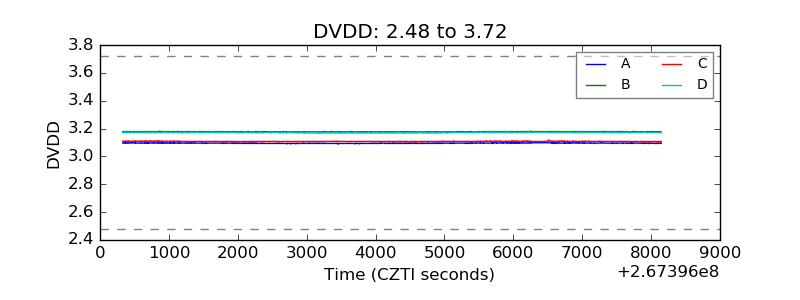 |
| Temperature 1 | 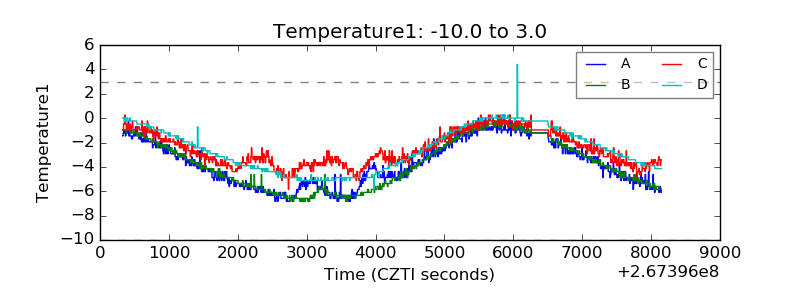 |
| Veto HV Monitor | 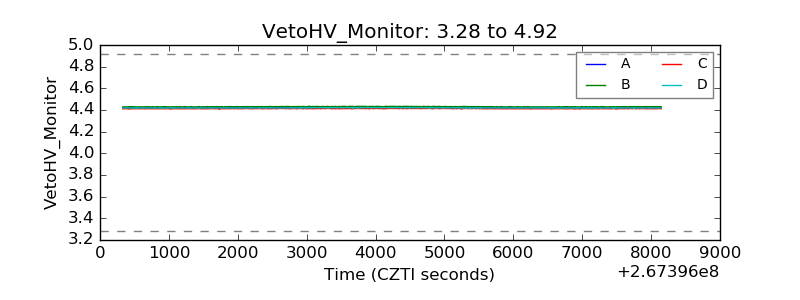 |
| Veto LLD | 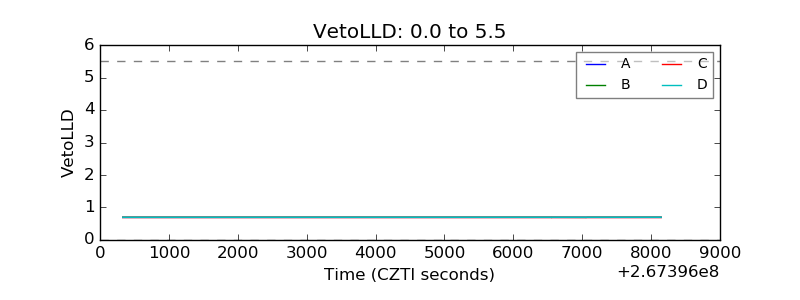 |
| Alpha Counter | 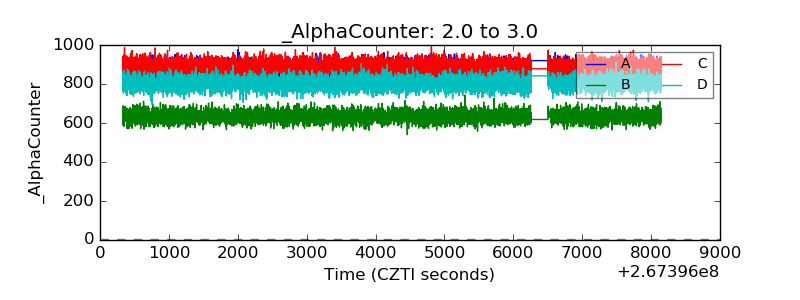 |
| _CPM_Rate | 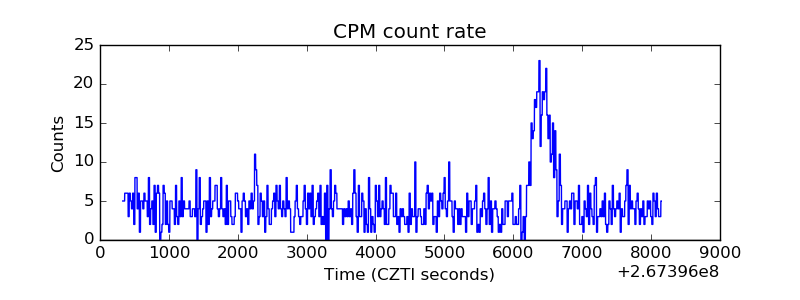 |
| CZT Counter |  |
| +2.5 Volts monitor |  |
| +5 Volts monitor |  |
| _ROLL_ROT | 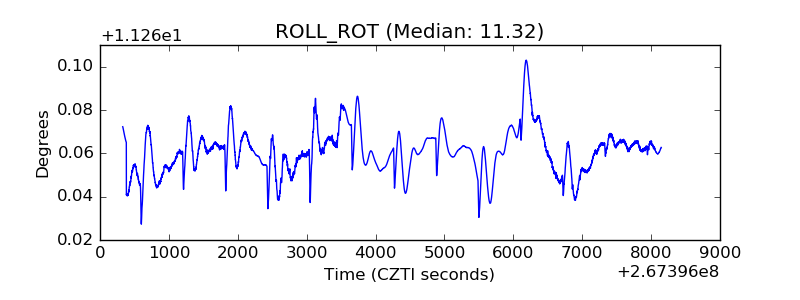 |
| _Roll_DEC | 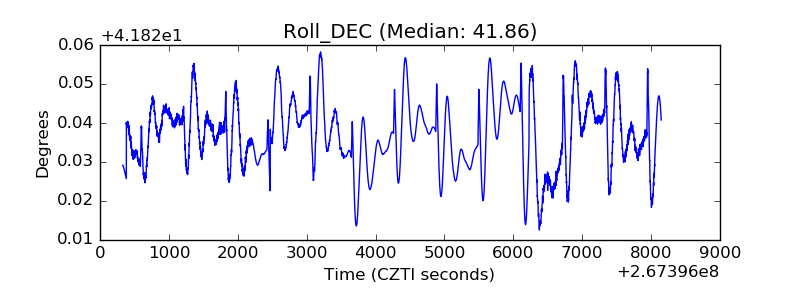 |
| _Roll_RA |  |
| Veto Counter | 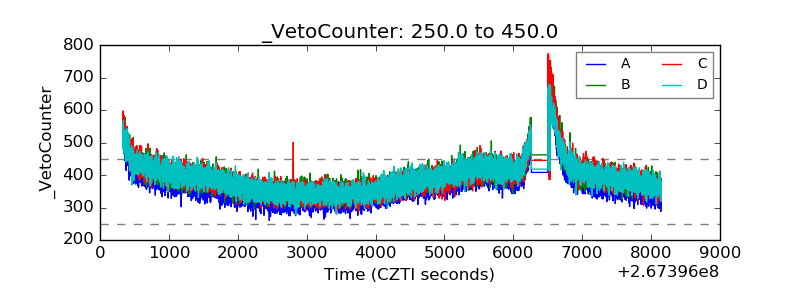 |