| Param | Original file | Final file |
|---|---|---|
| Filename | modeM0/AS1A04_022T02_9000002184_14786cztM0_level2.evt | modeM0/AS1A04_022T02_9000002184_14786cztM0_level2_quad_clean.evt |
| Size (bytes) | 925,634,880 | 168,632,640 |
| Size | 882.8 MB | 160.8 MB |
| Events in quadrant A | 6,040,853 | 1,071,962 |
| Events in quadrant B | 8,055,864 | 1,051,850 |
| Events in quadrant C | 6,864,930 | 1,061,087 |
| Events in quadrant D | 6,204,511 | 1,036,906 |
| Mode M0 | |||
|---|---|---|---|
| Quadrant | BADHDUFLAG | Total packets | Discarded packets |
| A | 0 | 26775 | 4 |
| B | 0 | 32667 | 3 |
| C | 0 | 28492 | 3 |
| D | 0 | 27972 | 3 |
| Mode M9 | |||
|---|---|---|---|
| Quadrant | BADHDUFLAG | Total packets | Discarded packets |
| A | 0 | 17 | 0 |
| B | 0 | 17 | 0 |
| C | 0 | 17 | 0 |
| D | 0 | 18 | 0 |
| Mode SS | |||
|---|---|---|---|
| Quadrant | BADHDUFLAG | Total packets | Discarded packets |
| A | 0 | 258 | 0 |
| B | 0 | 258 | 0 |
| C | 0 | 258 | 0 |
| D | 0 | 258 | 0 |
| Quadrant | Total seconds | Saturated seconds | Saturation percentage |
|---|---|---|---|
| A | 12819 | 52 | 0.405648% |
| B | 12819 | 555 | 4.329511% |
| C | 12819 | 51 | 0.397847% |
| D | 12819 | 147 | 1.146735% |
Noise dominated data is calculated using 1-second bins in cleaned event files. If a bin has >2000 counts, and if more than 50% of those come from <1% of pixels, then it is considered to be noise-dominated and hence unusable.
| Quadrant | # 1 sec bins | Bins with >0 counts | Bins with >2000 counts | High rate bins dominated by noise | Noise dominated (total time) | Noise dominated (detector-on time) | Marked lightcurve |
|---|---|---|---|---|---|---|---|
| A | 14160 | 12822 | 2 | 2 | 0.01% | 0.02% | 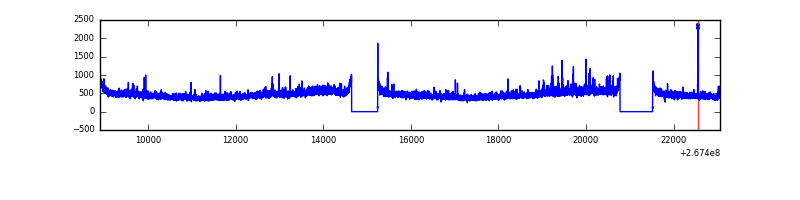 |
| B | 14160 | 12822 | 347 | 347 | 2.45% | 2.71% | 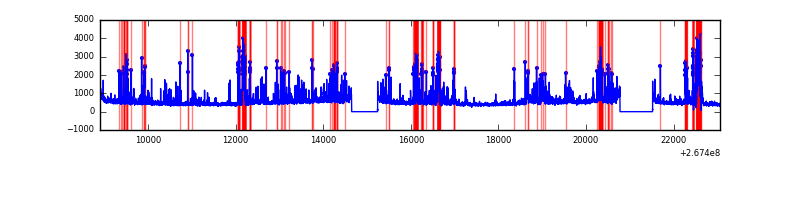 |
| C | 14160 | 12822 | 11 | 11 | 0.08% | 0.09% | 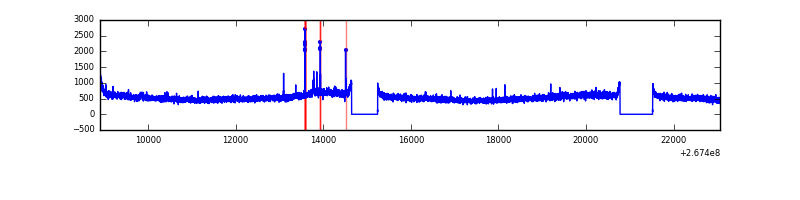 |
| D | 14160 | 12822 | 120 | 120 | 0.85% | 0.94% | 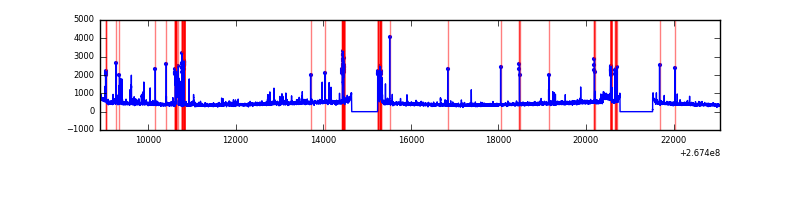 |
Top three noisy pixels from each quadrant. If the there are fewer than three noisy pixels in the level2.evt file, extra rows are filled as -1
| Pixel properties | Quadrant properties | ||||||
|---|---|---|---|---|---|---|---|
| Quadrant | DetID | PixID | Counts | Sigma | Mean | Median | Sigma |
| A | 12 | 189 | 172018 | 559.26 | 1497 | 1464 | 305.0 |
| A | 3 | 1 | 101891 | 329.31 | 1497 | 1464 | 305.0 |
| A | 9 | 143 | 18851 | 57.01 | 1497 | 1464 | 305.0 |
| B | 10 | 16 | 1016844 | 3608.49 | 1476 | 1437 | 281.4 |
| B | 3 | 64 | 1012653 | 3593.6 | 1476 | 1437 | 281.4 |
| B | 0 | 228 | 59324 | 205.72 | 1476 | 1437 | 281.4 |
| C | 3 | 233 | 1173531 | 3527.25 | 1445 | 1451 | 332.3 |
| C | 0 | 207 | 45034 | 131.16 | 1445 | 1451 | 332.3 |
| C | 13 | 61 | 10483 | 27.18 | 1445 | 1451 | 332.3 |
| D | 15 | 0 | 615643 | 1753.57 | 1446 | 1400 | 350.3 |
| D | 2 | 234 | 49145 | 136.3 | 1446 | 1400 | 350.3 |
| D | 2 | 120 | 30349 | 82.64 | 1446 | 1400 | 350.3 |
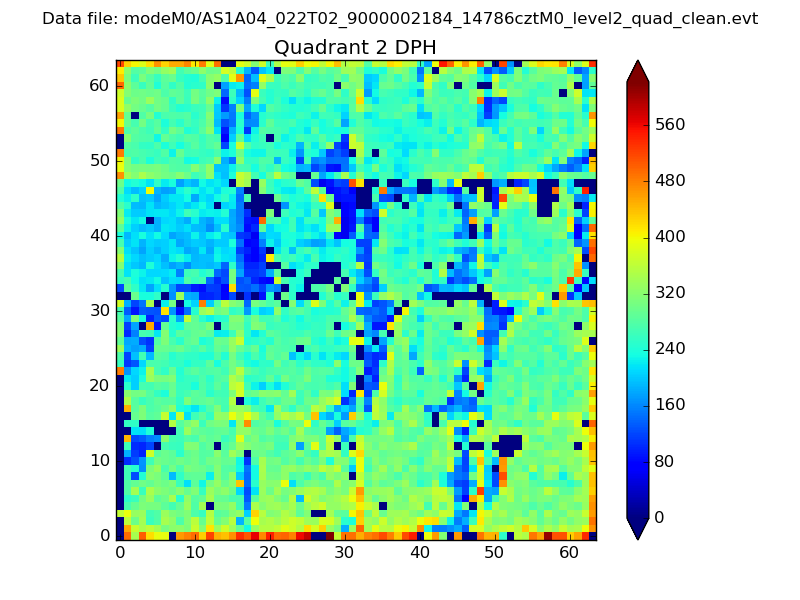
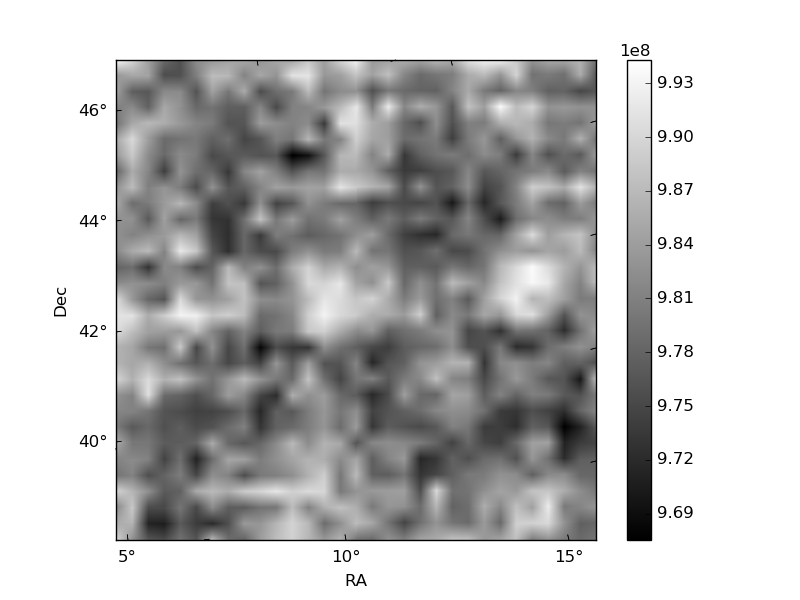
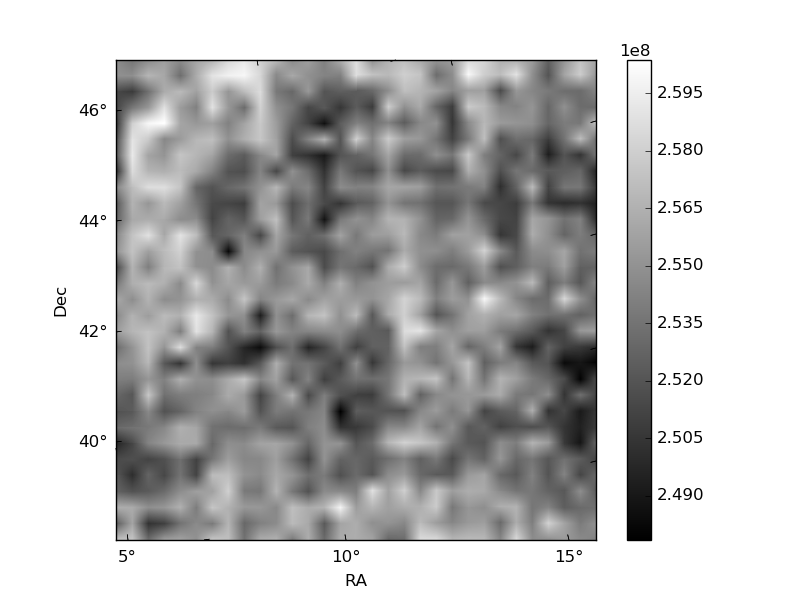
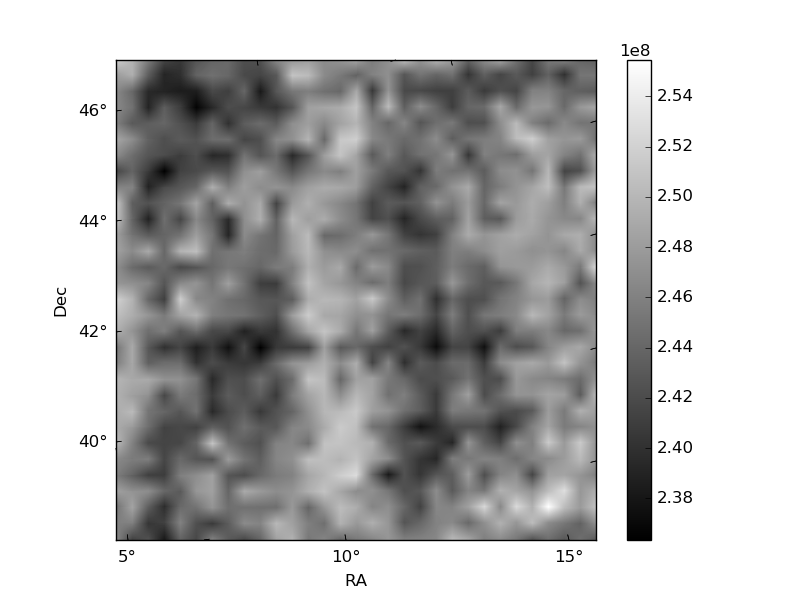
Histogram calculated using DETX and DETY for each event in the final _common_clean file
| Quadrant A | 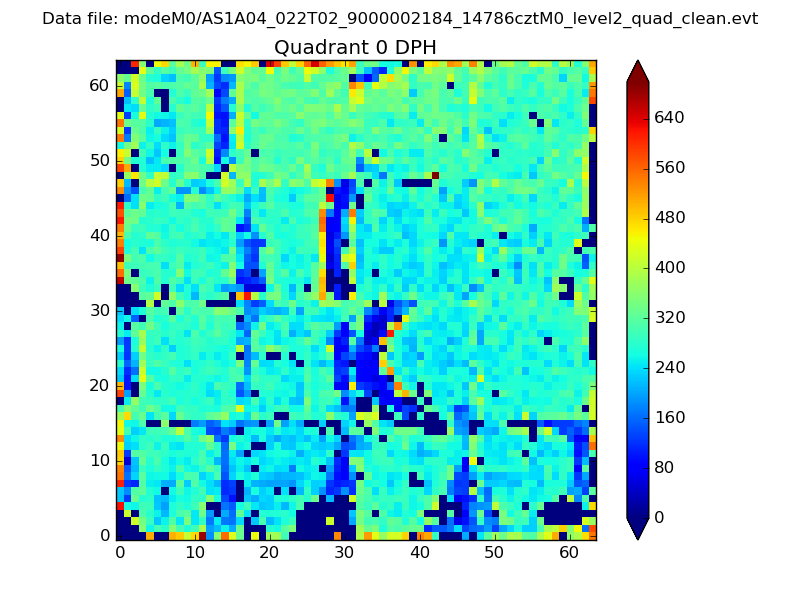 |
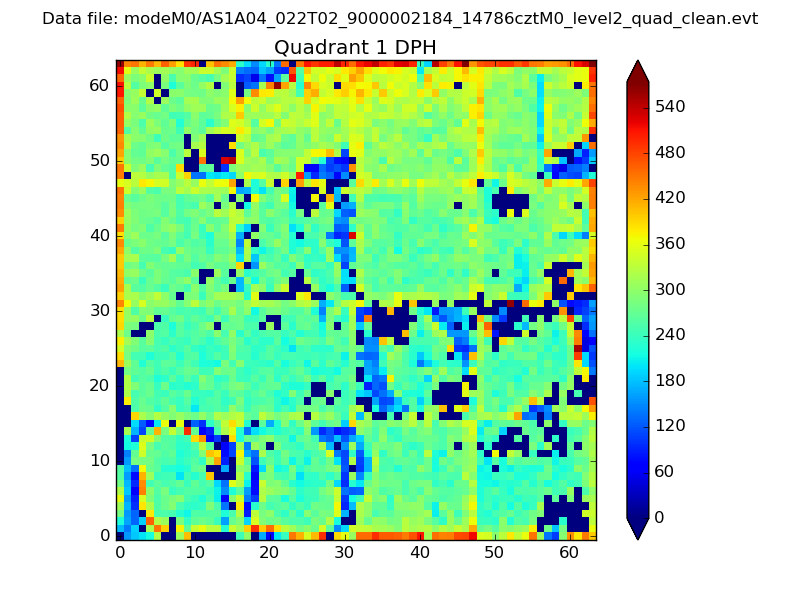 |
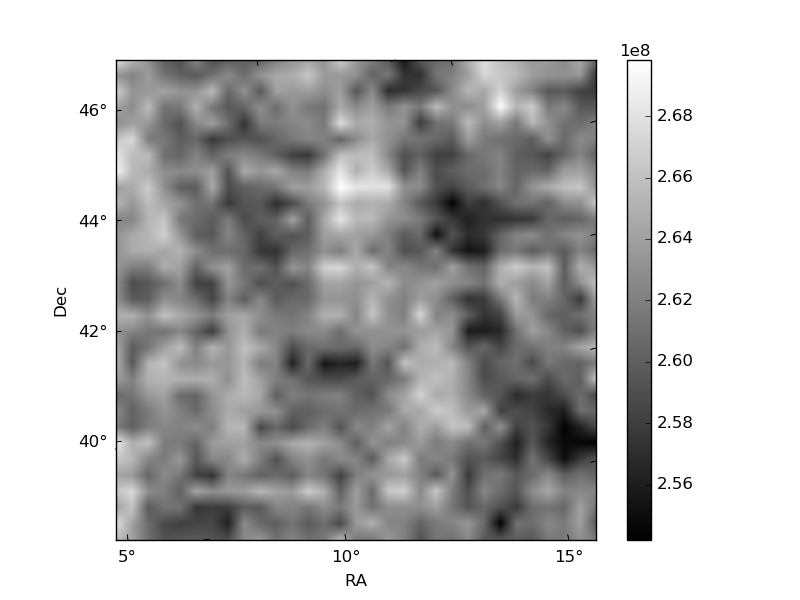
Quadrant B |
|---|---|---|---|
| Quadrant D | 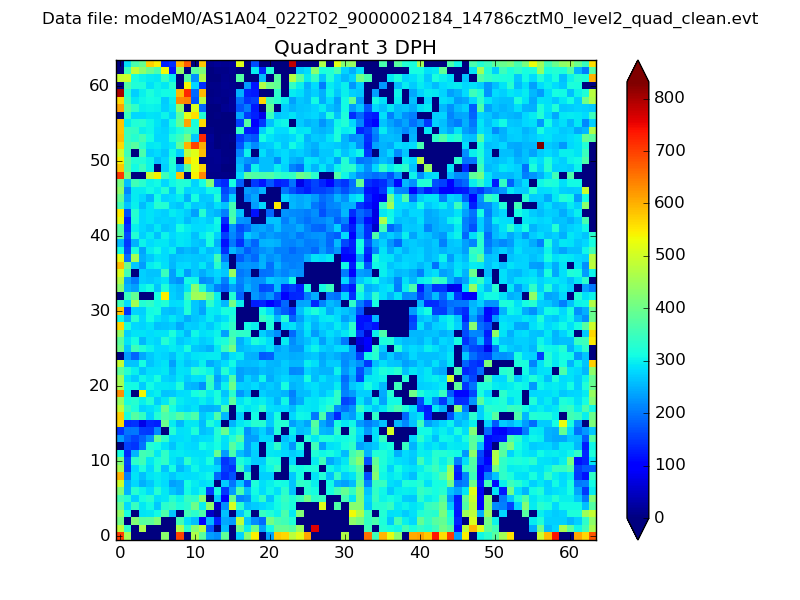 |
 |
Quadrant C |
| Plot type | Count rate plots | Images |
|---|---|---|
| Comparison with Poisson distribution Blue bars denote a histogram of data divided into 1 sec bins. Red curve is a Poisson curve with rate = median count rate of data. |
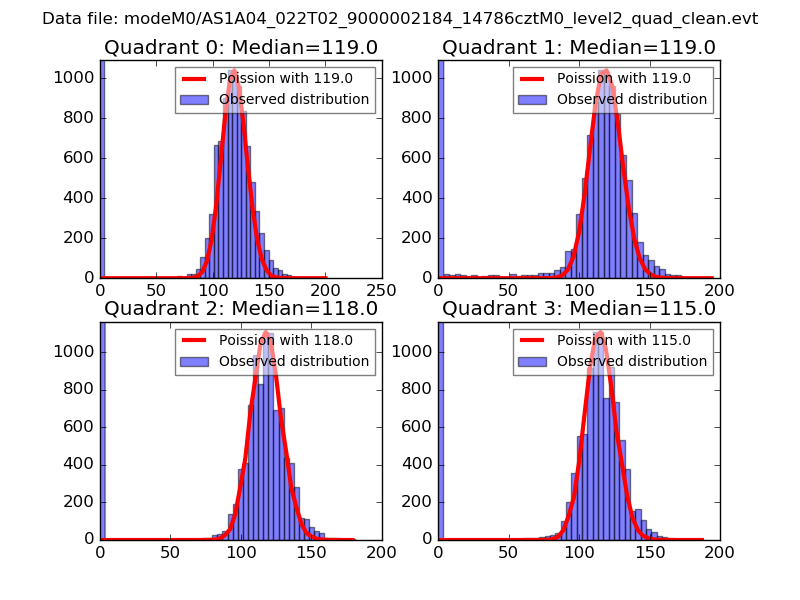 |
 |
| Quadrant-wise count rates Data is divided into 100 sec bins |
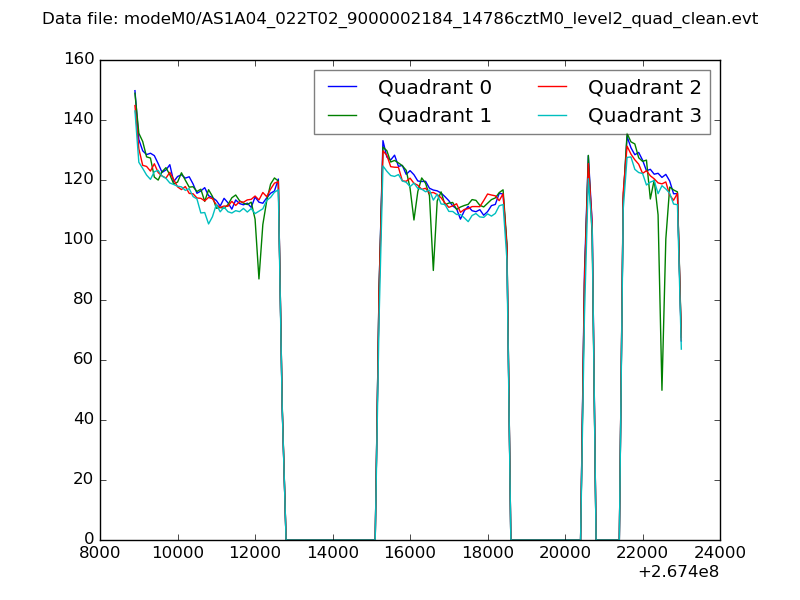 |
|
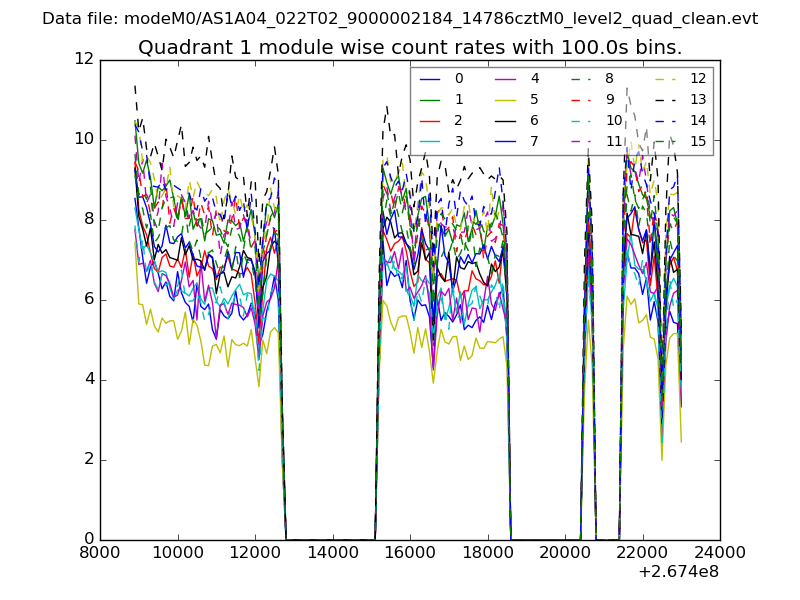
| Module-wise count rates for Quadrant A Data is divided into 100 sec bins |
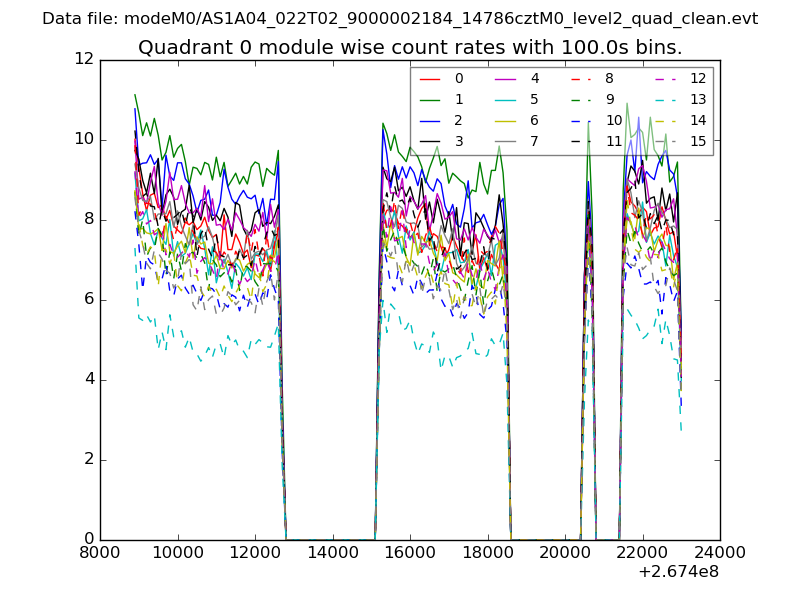 |
 |
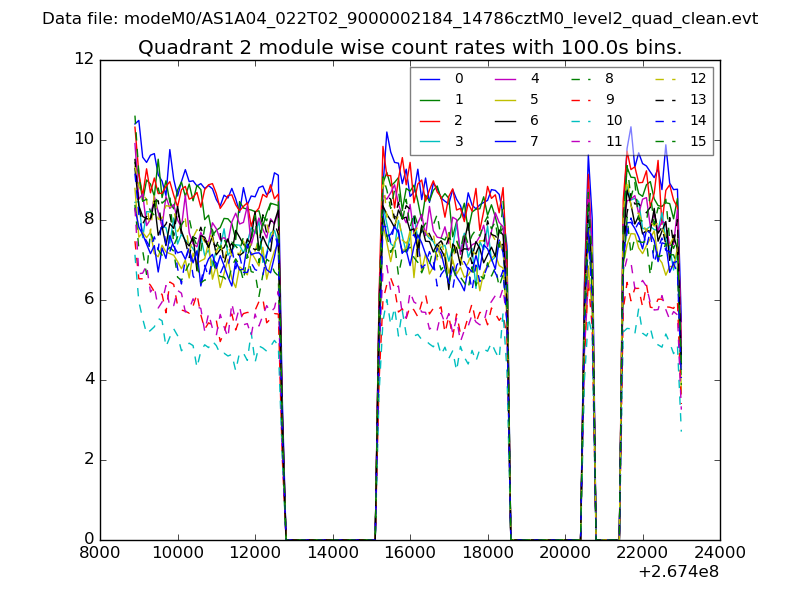
| Module-wise count rates for Quadrant B Data is divided into 100 sec bins |
 |
 |
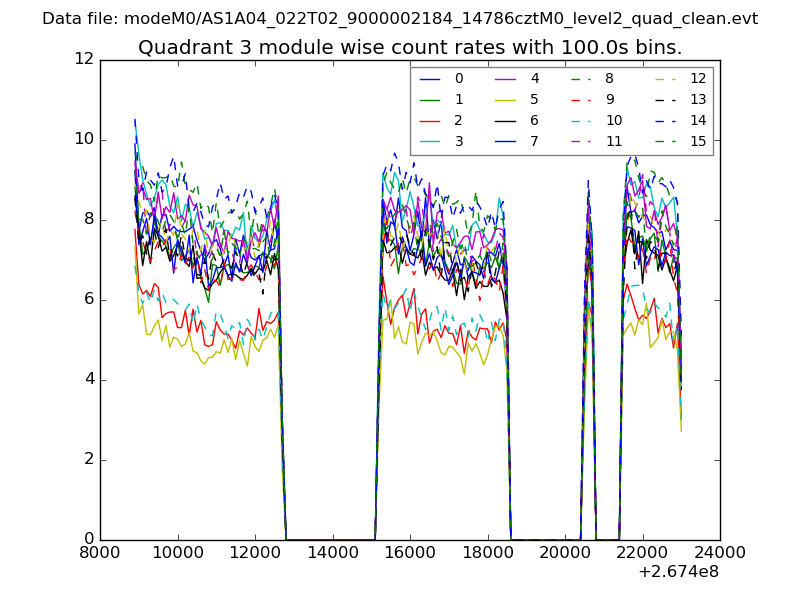
| Module-wise count rates for Quadrant C Data is divided into 100 sec bins |
 |
 |
| Module-wise count rates for Quadrant D Data is divided into 100 sec bins |
 |
 |
| Parameter | Plot |
|---|---|
| CZT HV Monitor | 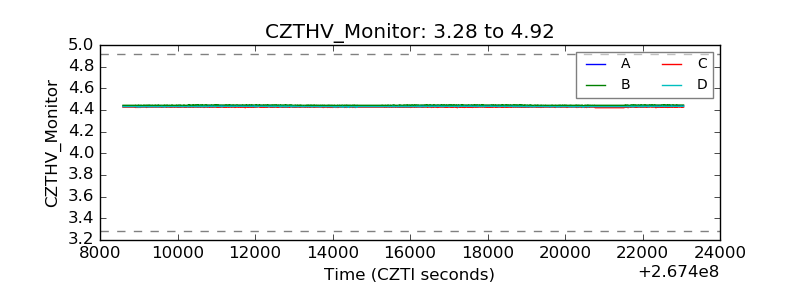 |
| D_VDD | 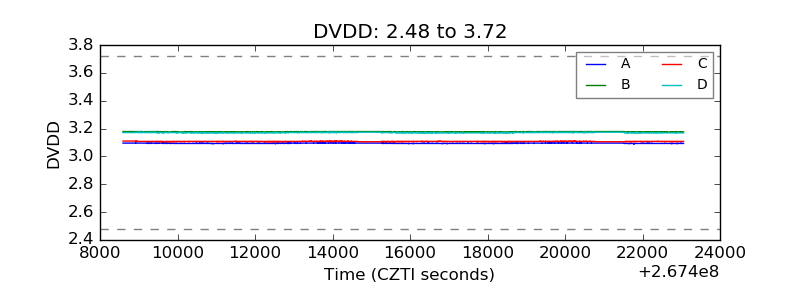 |
| Temperature 1 | 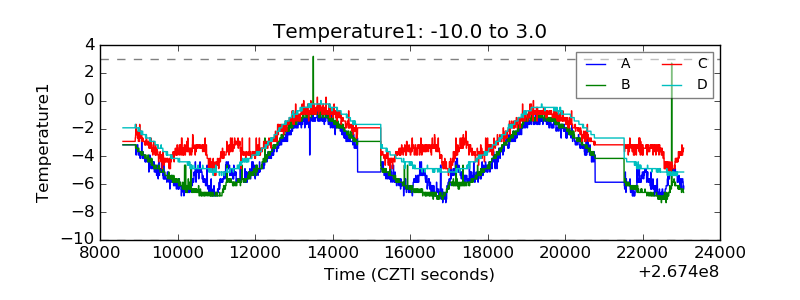 |
| Veto HV Monitor | 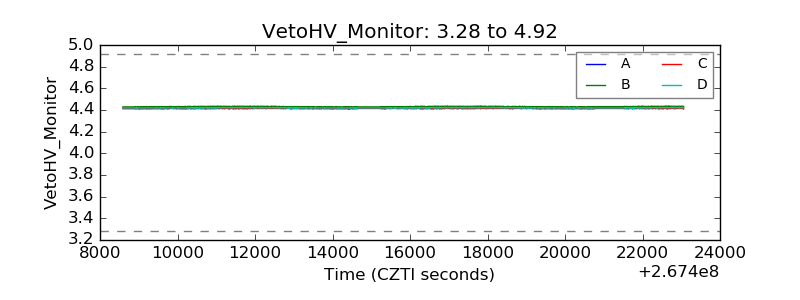 |
| Veto LLD | 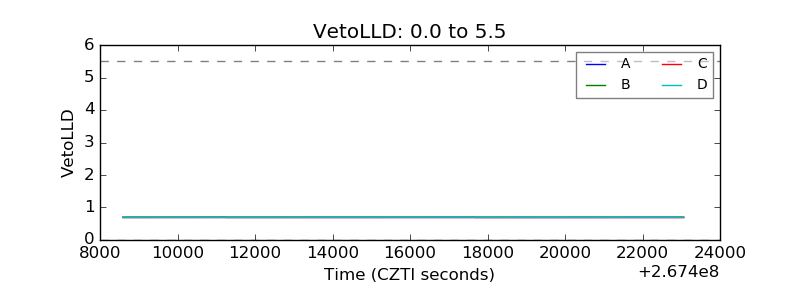 |
| Alpha Counter | 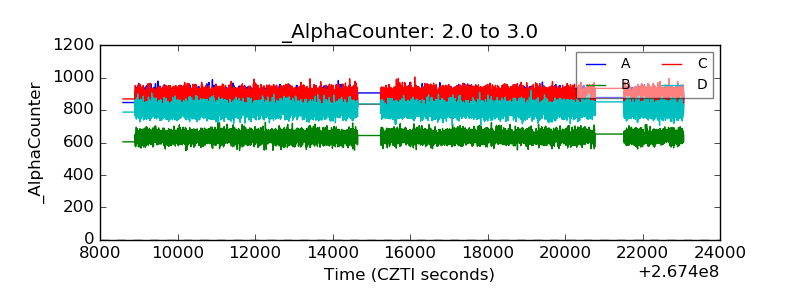 |
| _CPM_Rate | 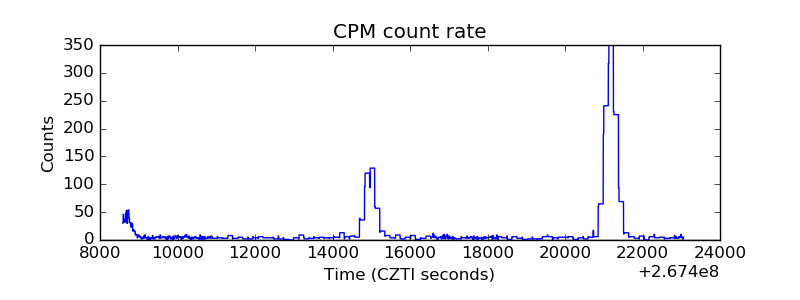 |
| CZT Counter | 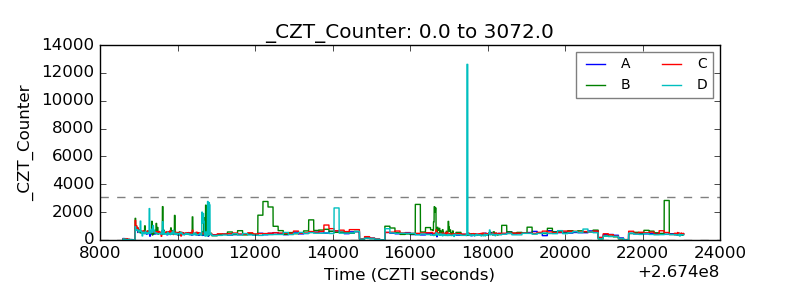 |
| +2.5 Volts monitor |  |
| +5 Volts monitor |  |
| _ROLL_ROT | 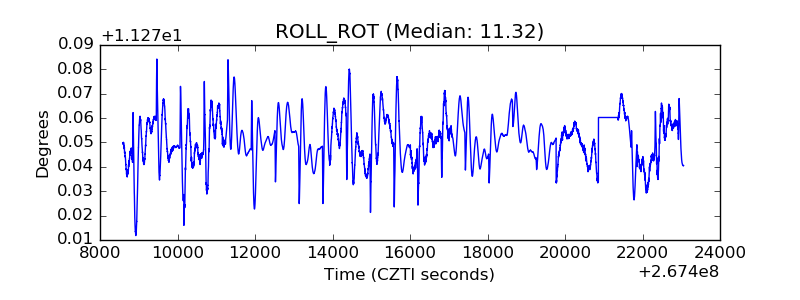 |
| _Roll_DEC | 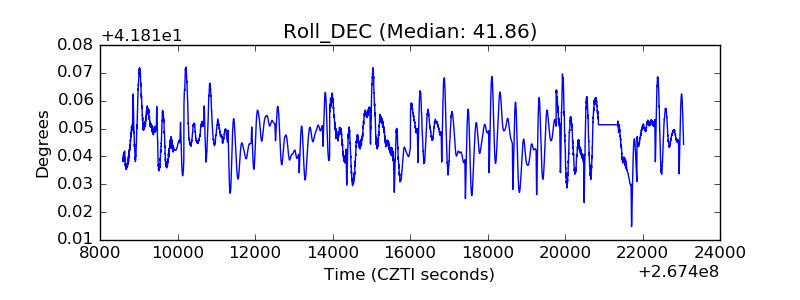 |
| _Roll_RA | 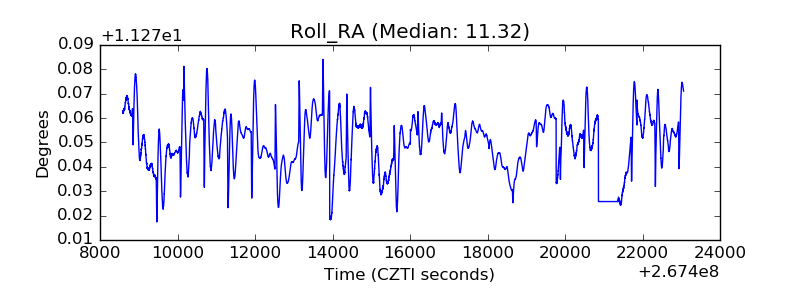 |
| Veto Counter | 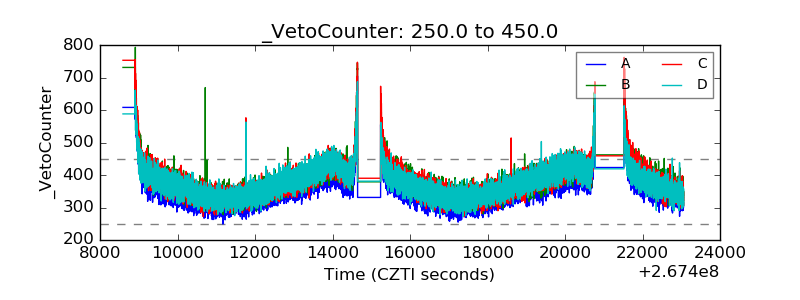 |