| Param | Original file | Final file |
|---|---|---|
| Filename | modeM0/AS1A04_022T02_9000002184_14789cztM0_level2.evt | modeM0/AS1A04_022T02_9000002184_14789cztM0_level2_quad_clean.evt |
| Size (bytes) | 470,347,200 | 98,455,680 |
| Size | 448.6 MB | 93.9 MB |
| Events in quadrant A | 3,245,188 | 644,444 |
| Events in quadrant B | 3,652,773 | 644,528 |
| Events in quadrant C | 3,737,613 | 626,733 |
| Events in quadrant D | 3,166,479 | 611,588 |
| Mode M0 | |||
|---|---|---|---|
| Quadrant | BADHDUFLAG | Total packets | Discarded packets |
| A | 0 | 13633 | 3 |
| B | 0 | 14951 | 2 |
| C | 0 | 15163 | 2 |
| D | 0 | 13802 | 2 |
| Mode M9 | |||
|---|---|---|---|
| Quadrant | BADHDUFLAG | Total packets | Discarded packets |
| A | 0 | 12 | 0 |
| B | 0 | 12 | 0 |
| C | 0 | 12 | 0 |
| D | 0 | 13 | 0 |
| Mode SS | |||
|---|---|---|---|
| Quadrant | BADHDUFLAG | Total packets | Discarded packets |
| A | 0 | 132 | 0 |
| B | 0 | 132 | 0 |
| C | 0 | 132 | 0 |
| D | 0 | 132 | 0 |
| Quadrant | Total seconds | Saturated seconds | Saturation percentage |
|---|---|---|---|
| A | 6516 | 51 | 0.782689% |
| B | 6516 | 129 | 1.979742% |
| C | 6516 | 41 | 0.629220% |
| D | 6516 | 77 | 1.181707% |
Noise dominated data is calculated using 1-second bins in cleaned event files. If a bin has >2000 counts, and if more than 50% of those come from <1% of pixels, then it is considered to be noise-dominated and hence unusable.
| Quadrant | # 1 sec bins | Bins with >0 counts | Bins with >2000 counts | High rate bins dominated by noise | Noise dominated (total time) | Noise dominated (detector-on time) | Marked lightcurve |
|---|---|---|---|---|---|---|---|
| A | 7692 | 6518 | 2 | 2 | 0.03% | 0.03% | 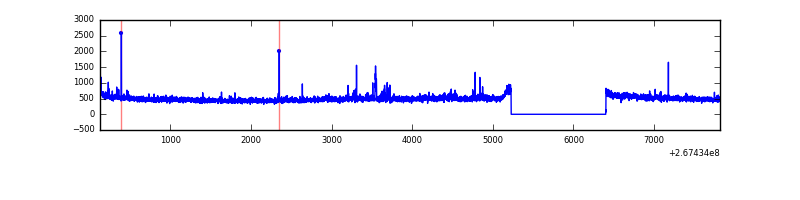 |
| B | 7692 | 6518 | 38 | 38 | 0.49% | 0.58% | 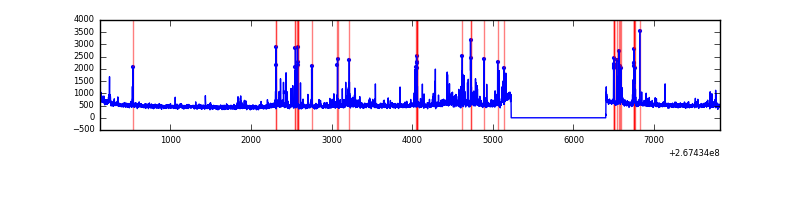 |
| C | 7692 | 6518 | 0 | 0 | 0.00% | 0.00% | 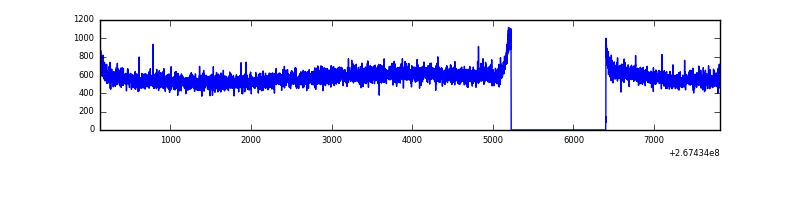 |
| D | 7692 | 6518 | 37 | 37 | 0.48% | 0.57% | 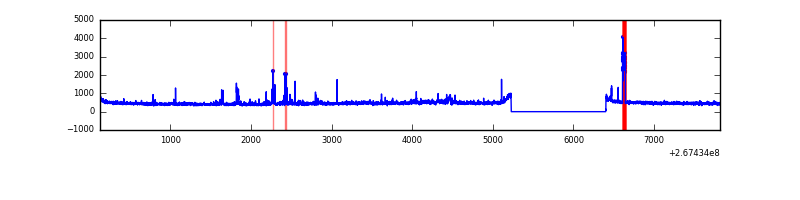 |
Top three noisy pixels from each quadrant. If the there are fewer than three noisy pixels in the level2.evt file, extra rows are filled as -1
| Pixel properties | Quadrant properties | ||||||
|---|---|---|---|---|---|---|---|
| Quadrant | DetID | PixID | Counts | Sigma | Mean | Median | Sigma |
| A | 12 | 189 | 60218 | 362.18 | 812 | 797 | 164.1 |
| A | 13 | 248 | 20666 | 121.1 | 812 | 797 | 164.1 |
| A | 9 | 143 | 15539 | 89.85 | 812 | 797 | 164.1 |
| B | 10 | 16 | 233827 | 1545.0 | 801 | 782 | 150.8 |
| B | 3 | 64 | 155672 | 1026.86 | 801 | 782 | 150.8 |
| B | 0 | 219 | 43184 | 281.11 | 801 | 782 | 150.8 |
| C | 3 | 233 | 733743 | 4147.88 | 769 | 772 | 176.7 |
| C | 13 | 61 | 5547 | 27.02 | 769 | 772 | 176.7 |
| C | 7 | 247 | 4517 | 21.19 | 769 | 772 | 176.7 |
| D | 15 | 0 | 138191 | 684.22 | 767 | 748 | 200.9 |
| D | 12 | 4 | 59164 | 290.81 | 767 | 748 | 200.9 |
| D | 2 | 234 | 23055 | 111.05 | 767 | 748 | 200.9 |
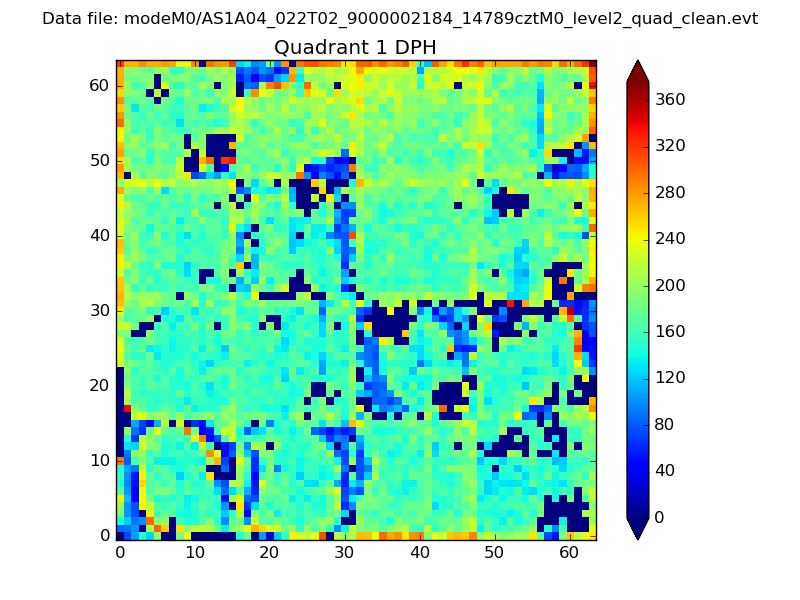
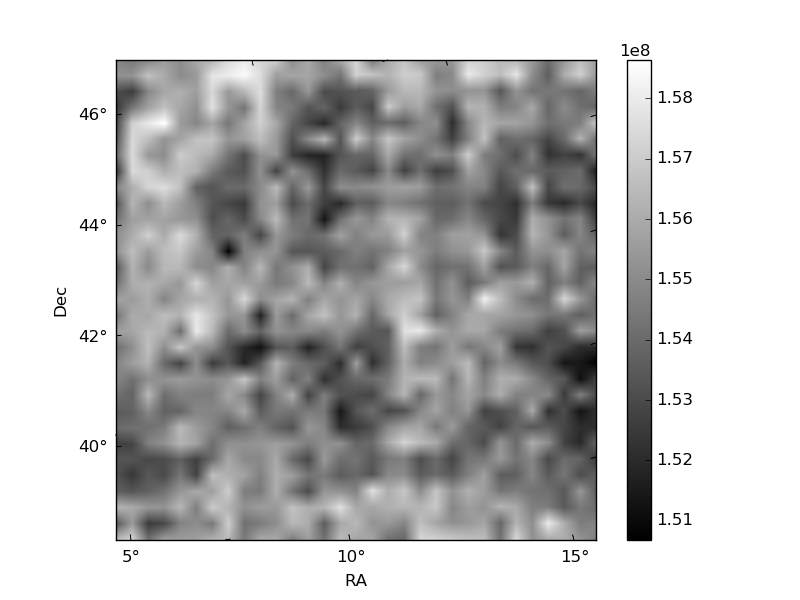
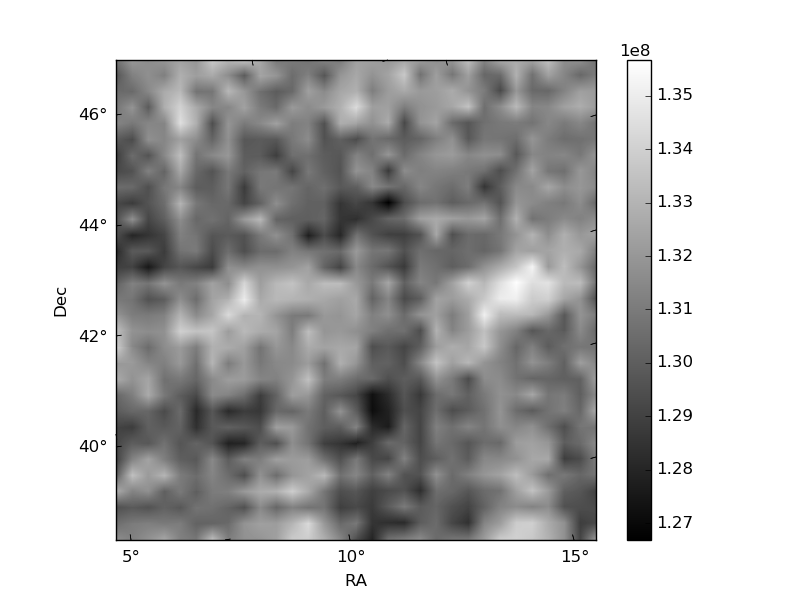
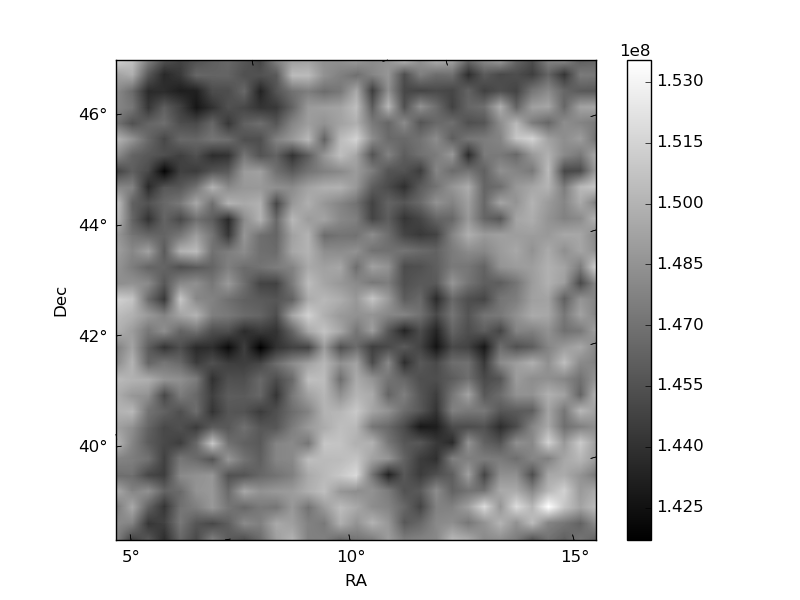
Histogram calculated using DETX and DETY for each event in the final _common_clean file
| Quadrant A |  |
 |
Quadrant B |
|---|---|---|---|
| Quadrant D | 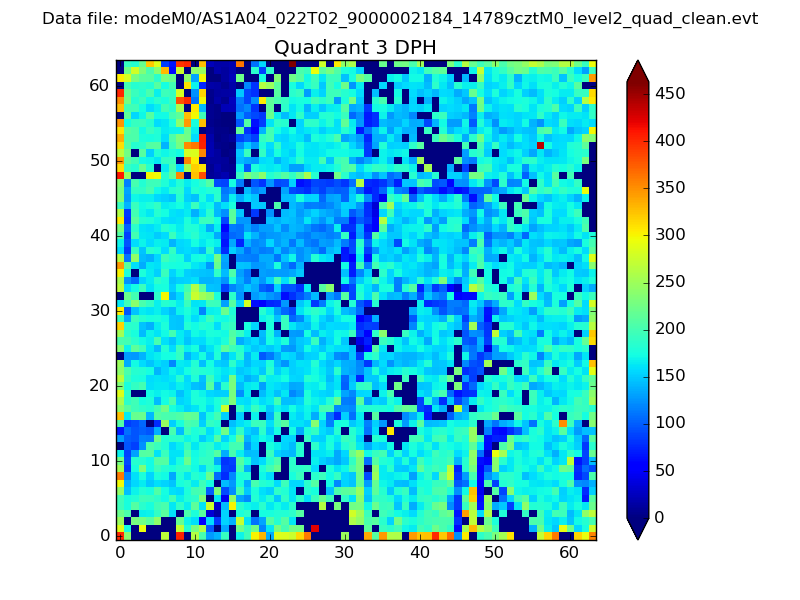 |
 |
Quadrant C |
| Plot type | Count rate plots | Images |
|---|---|---|
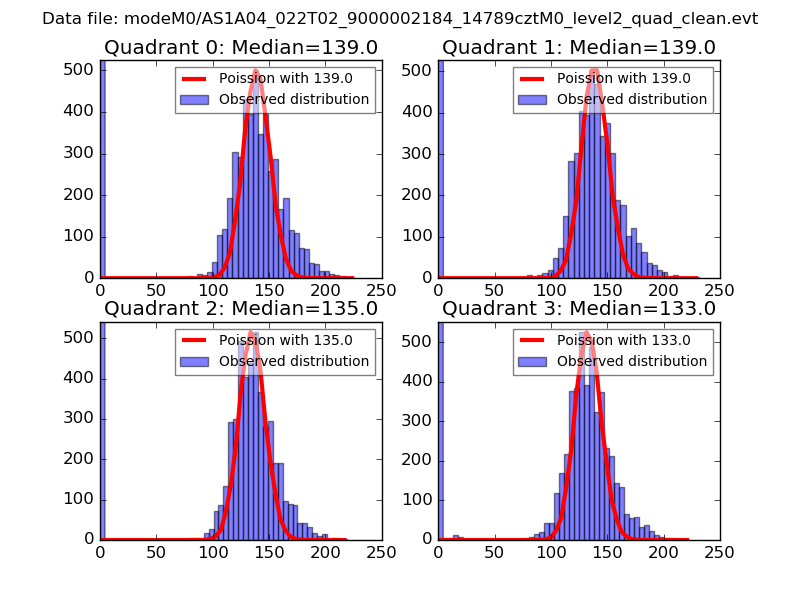
| Comparison with Poisson distribution Blue bars denote a histogram of data divided into 1 sec bins. Red curve is a Poisson curve with rate = median count rate of data. |
 |
 |
| Quadrant-wise count rates Data is divided into 100 sec bins |
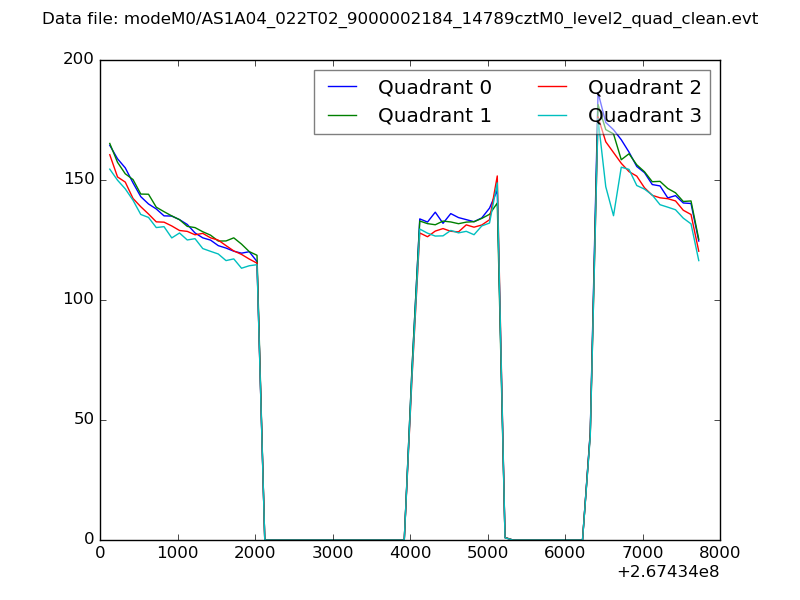 |
|
| Module-wise count rates for Quadrant A Data is divided into 100 sec bins |
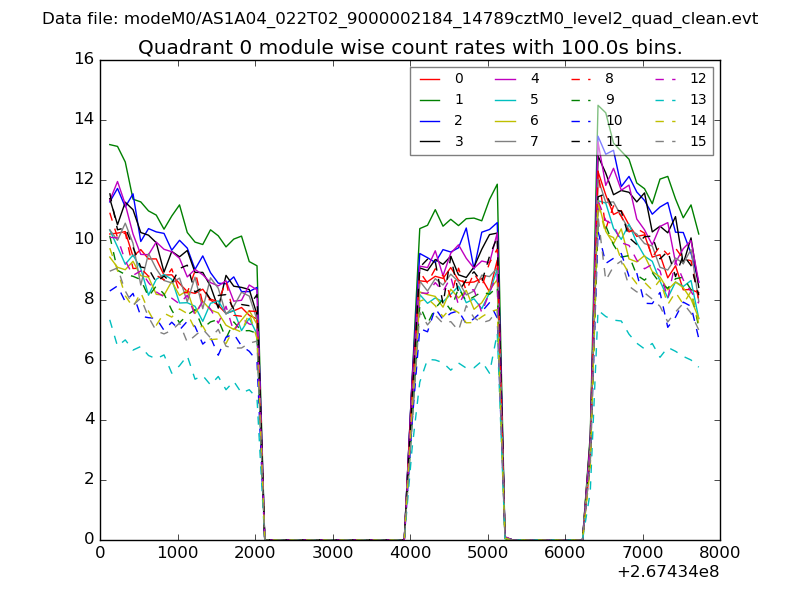 |
 |
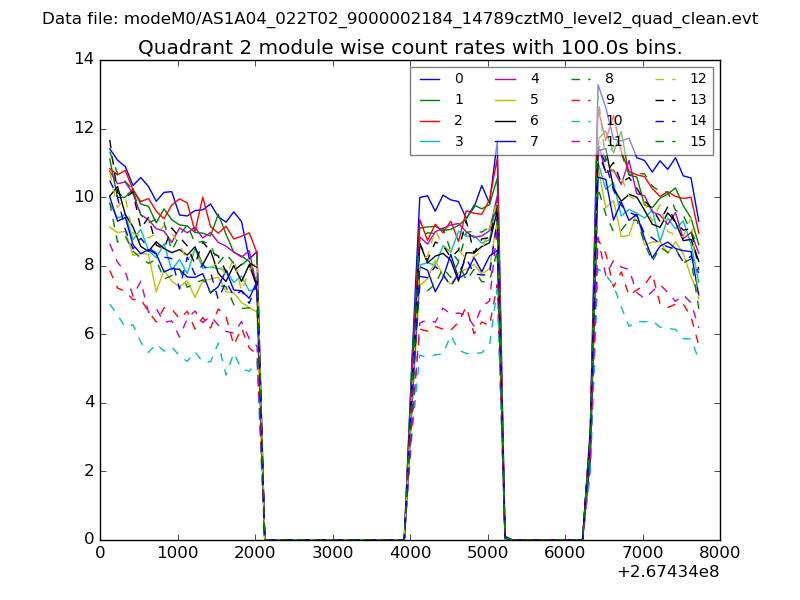
| Module-wise count rates for Quadrant B Data is divided into 100 sec bins |
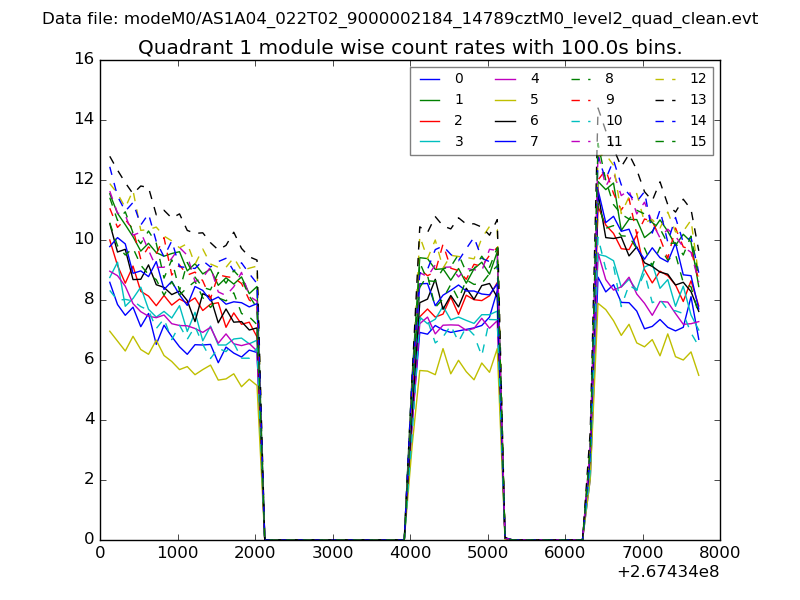 |
 |
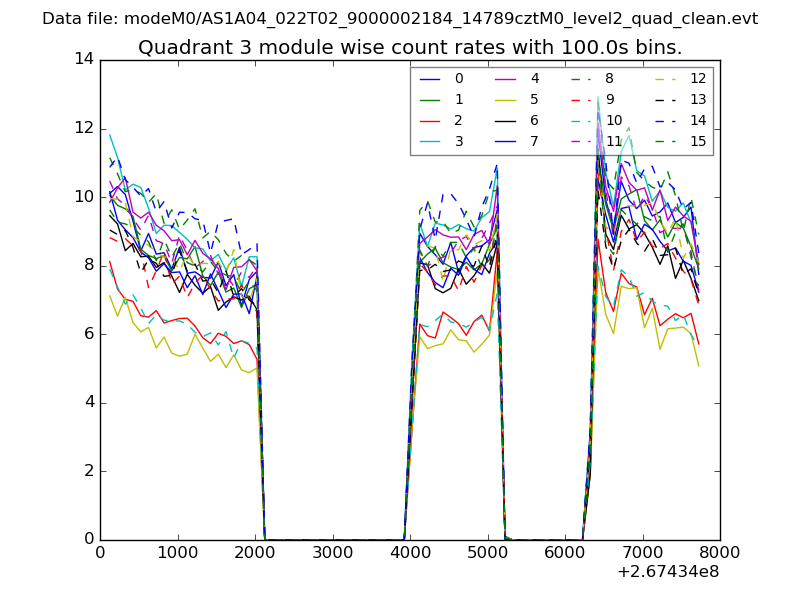
| Module-wise count rates for Quadrant C Data is divided into 100 sec bins |
 |
 |
| Module-wise count rates for Quadrant D Data is divided into 100 sec bins |
 |
 |
| Parameter | Plot |
|---|---|
| CZT HV Monitor | 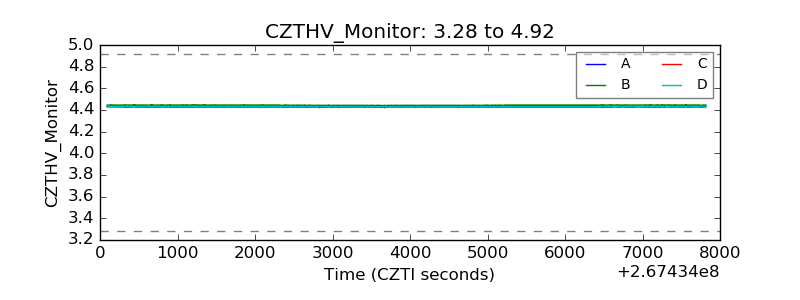 |
| D_VDD | 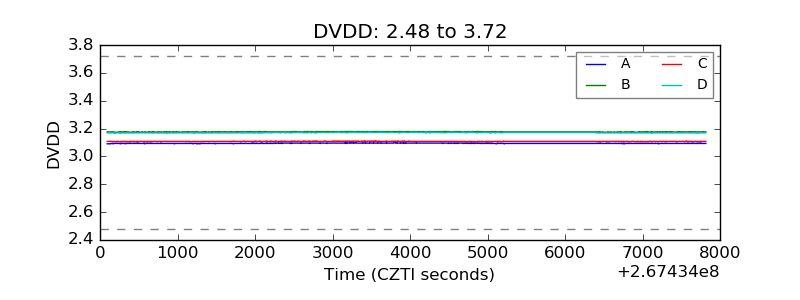 |
| Temperature 1 | 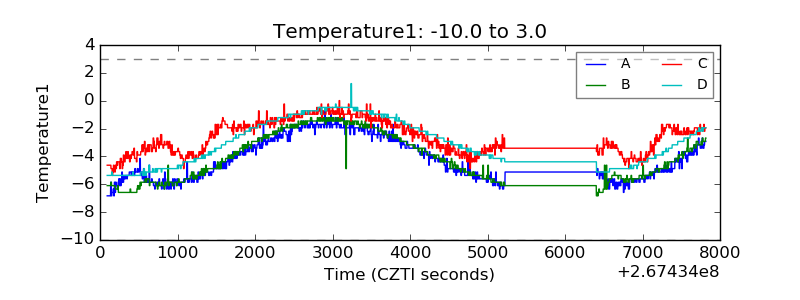 |
| Veto HV Monitor | 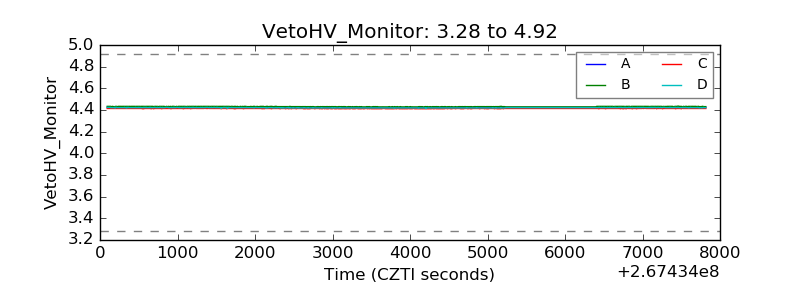 |
| Veto LLD | 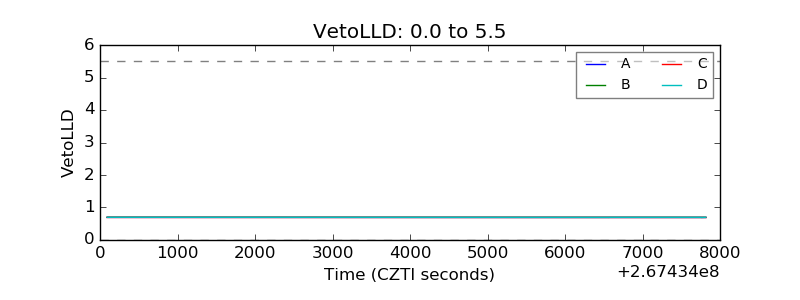 |
| Alpha Counter | 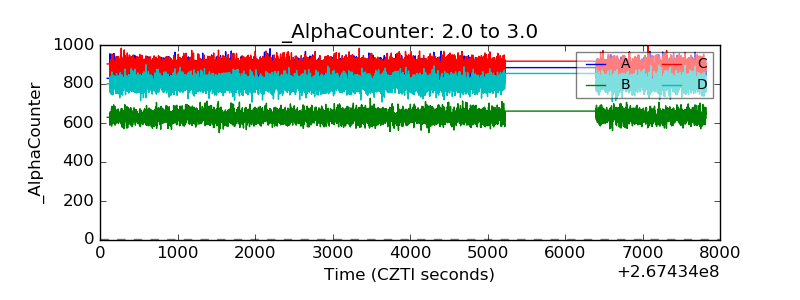 |
| _CPM_Rate | 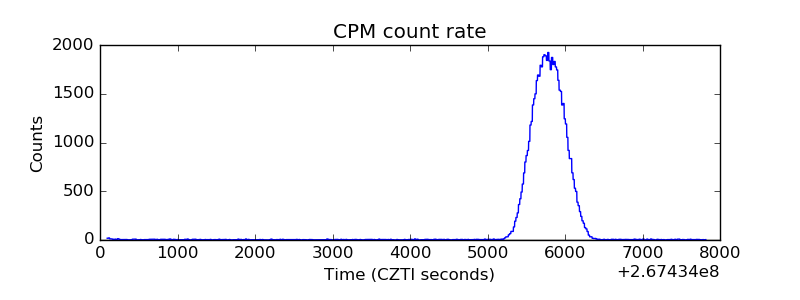 |
| CZT Counter | 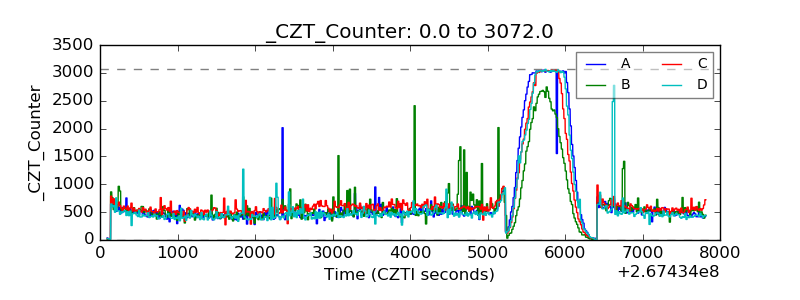 |
| +2.5 Volts monitor |  |
| +5 Volts monitor |  |
| _ROLL_ROT | 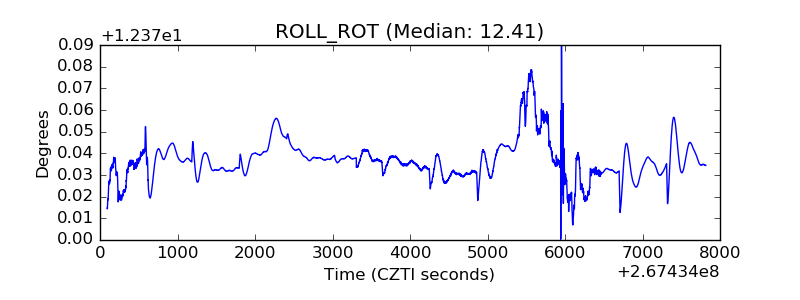 |
| _Roll_DEC | 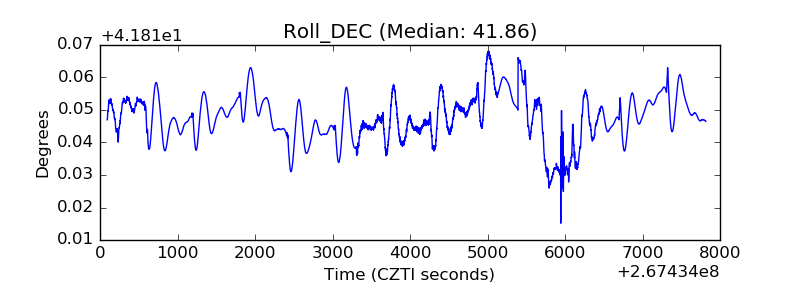 |
| _Roll_RA | 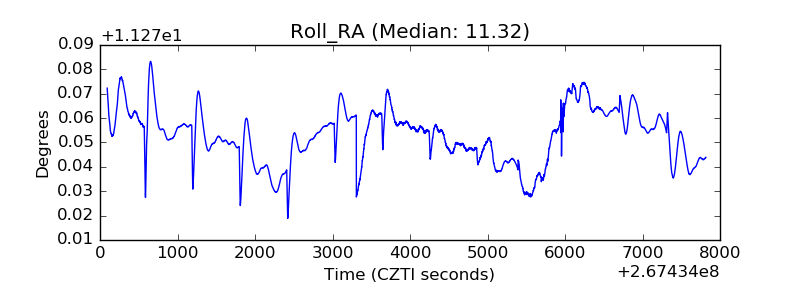 |
| Veto Counter | 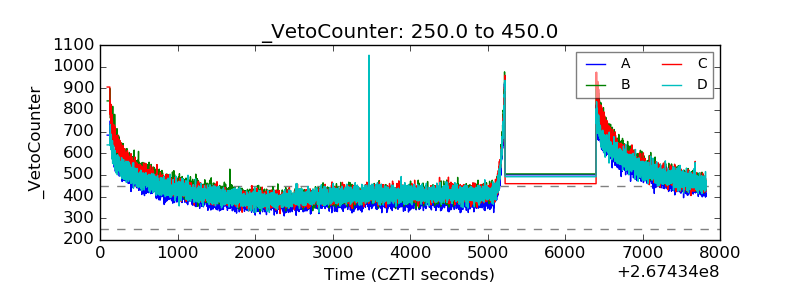 |