| Param | Original file | Final file |
|---|---|---|
| Filename | modeM0/AS1A04_022T02_9000002184_14791cztM0_level2.evt | modeM0/AS1A04_022T02_9000002184_14791cztM0_level2_quad_clean.evt |
| Size (bytes) | 1,203,854,400 | 211,921,920 |
| Size | 1.1 GB | 202.1 MB |
| Events in quadrant A | 7,766,111 | 1,363,712 |
| Events in quadrant B | 10,766,147 | 1,340,580 |
| Events in quadrant C | 9,262,382 | 1,329,154 |
| Events in quadrant D | 7,605,959 | 1,303,884 |
| Mode M0 | |||
|---|---|---|---|
| Quadrant | BADHDUFLAG | Total packets | Discarded packets |
| A | 0 | 32802 | 4 |
| B | 0 | 42281 | 3 |
| C | 0 | 38137 | 3 |
| D | 0 | 33153 | 3 |
| Mode M9 | |||
|---|---|---|---|
| Quadrant | BADHDUFLAG | Total packets | Discarded packets |
| A | 0 | 35 | 0 |
| B | 0 | 35 | 0 |
| C | 0 | 35 | 0 |
| D | 0 | 35 | 0 |
| Mode SS | |||
|---|---|---|---|
| Quadrant | BADHDUFLAG | Total packets | Discarded packets |
| A | 0 | 318 | 0 |
| B | 0 | 318 | 0 |
| C | 0 | 318 | 0 |
| D | 0 | 318 | 0 |
| Quadrant | Total seconds | Saturated seconds | Saturation percentage |
|---|---|---|---|
| A | 15676 | 161 | 1.027048% |
| B | 15676 | 785 | 5.007655% |
| C | 15676 | 129 | 0.822914% |
| D | 15676 | 172 | 1.097219% |
Noise dominated data is calculated using 1-second bins in cleaned event files. If a bin has >2000 counts, and if more than 50% of those come from <1% of pixels, then it is considered to be noise-dominated and hence unusable.
| Quadrant | # 1 sec bins | Bins with >0 counts | Bins with >2000 counts | High rate bins dominated by noise | Noise dominated (total time) | Noise dominated (detector-on time) | Marked lightcurve |
|---|---|---|---|---|---|---|---|
| A | 19147 | 15680 | 3 | 3 | 0.02% | 0.02% | 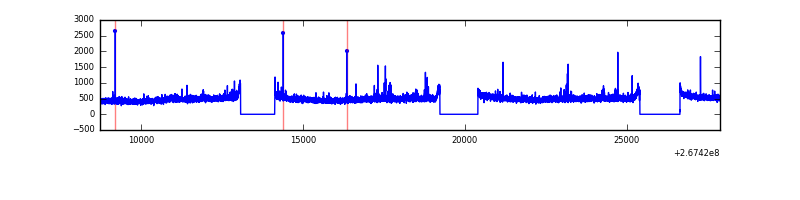 |
| B | 19147 | 15680 | 387 | 387 | 2.02% | 2.47% | 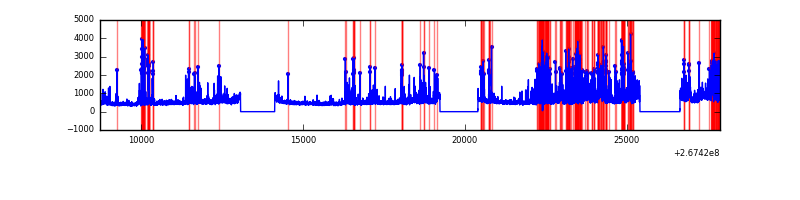 |
| C | 19147 | 15680 | 4 | 4 | 0.02% | 0.03% | 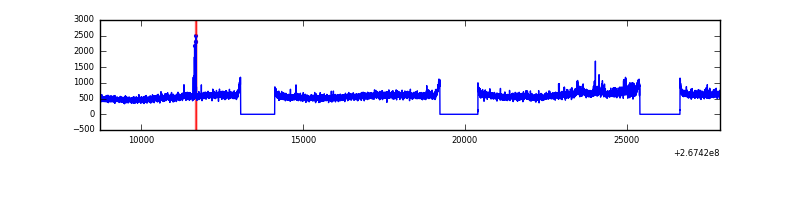 |
| D | 19147 | 15680 | 76 | 76 | 0.40% | 0.48% | 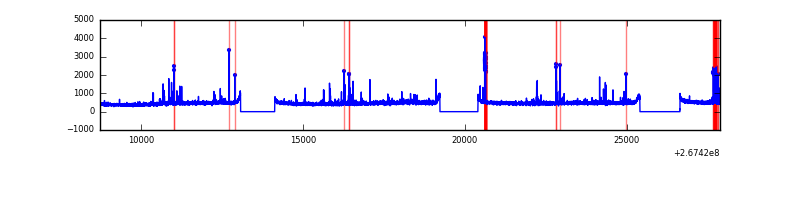 |
Top three noisy pixels from each quadrant. If the there are fewer than three noisy pixels in the level2.evt file, extra rows are filled as -1
| Pixel properties | Quadrant properties | ||||||
|---|---|---|---|---|---|---|---|
| Quadrant | DetID | PixID | Counts | Sigma | Mean | Median | Sigma |
| A | 12 | 189 | 168708 | 428.85 | 1951 | 1917 | 388.9 |
| A | 13 | 248 | 40176 | 98.37 | 1951 | 1917 | 388.9 |
| A | 9 | 143 | 27744 | 66.41 | 1951 | 1917 | 388.9 |
| B | 10 | 16 | 2044292 | 5744.15 | 1900 | 1853 | 355.6 |
| B | 3 | 64 | 948031 | 2661.03 | 1900 | 1853 | 355.6 |
| B | 0 | 229 | 89257 | 245.81 | 1900 | 1853 | 355.6 |
| C | 3 | 233 | 1990941 | 4719.79 | 1851 | 1860 | 421.4 |
| C | 14 | 234 | 40760 | 92.3 | 1851 | 1860 | 421.4 |
| C | 13 | 61 | 13464 | 27.53 | 1851 | 1860 | 421.4 |
| D | 15 | 0 | 268817 | 541.74 | 1859 | 1815 | 492.9 |
| D | 12 | 4 | 64564 | 127.32 | 1859 | 1815 | 492.9 |
| D | 2 | 234 | 60446 | 118.96 | 1859 | 1815 | 492.9 |
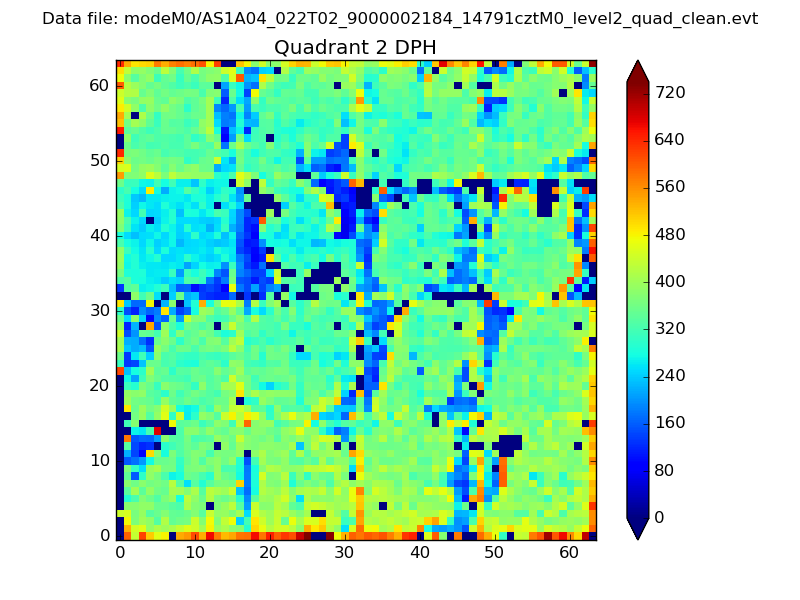
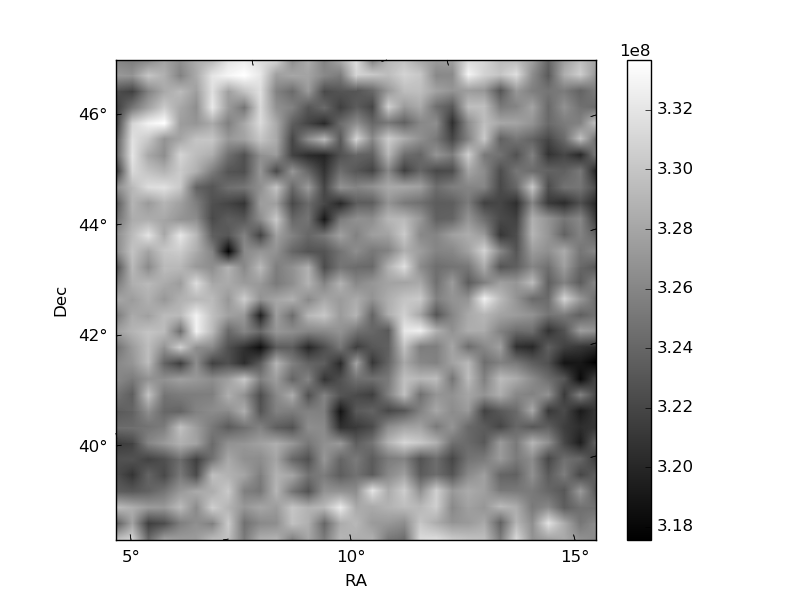
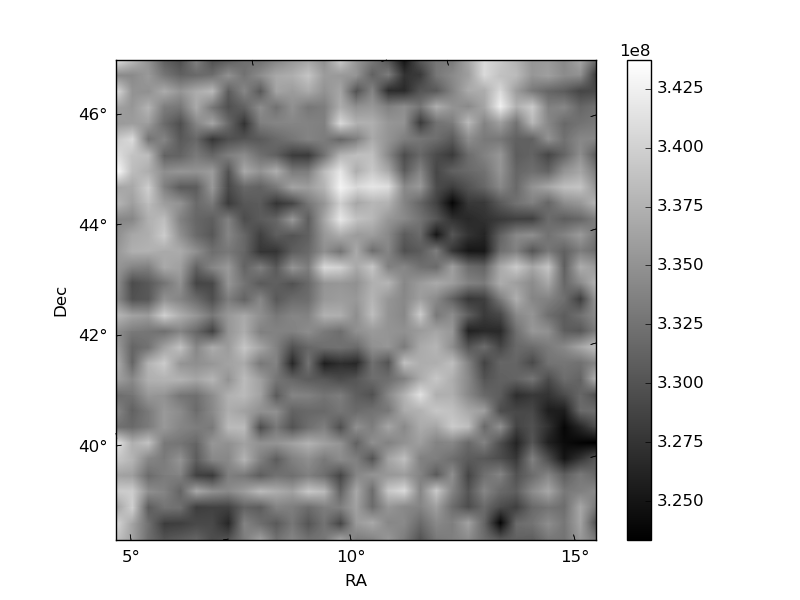
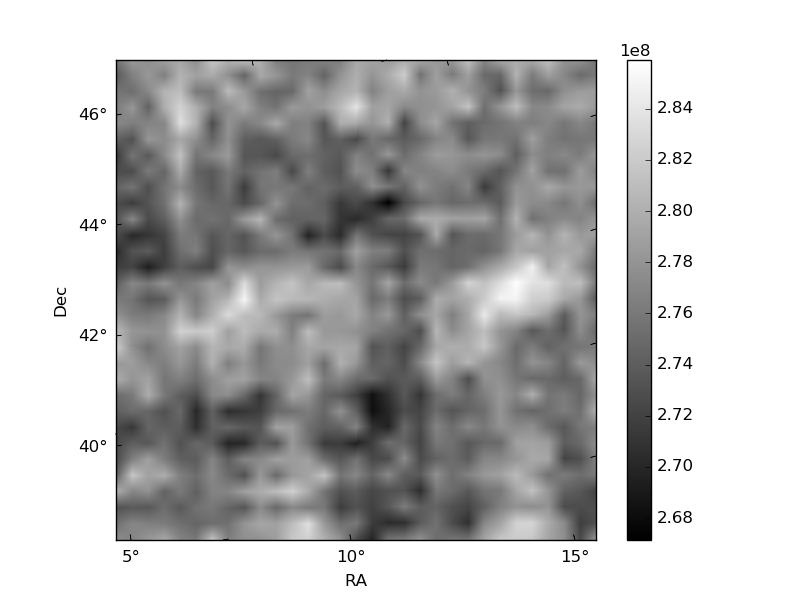
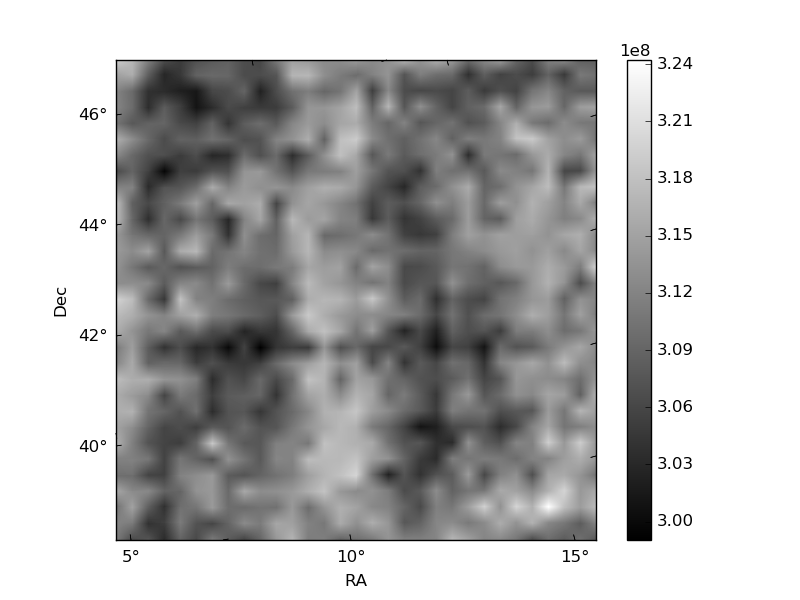
Histogram calculated using DETX and DETY for each event in the final _common_clean file
| Quadrant A | 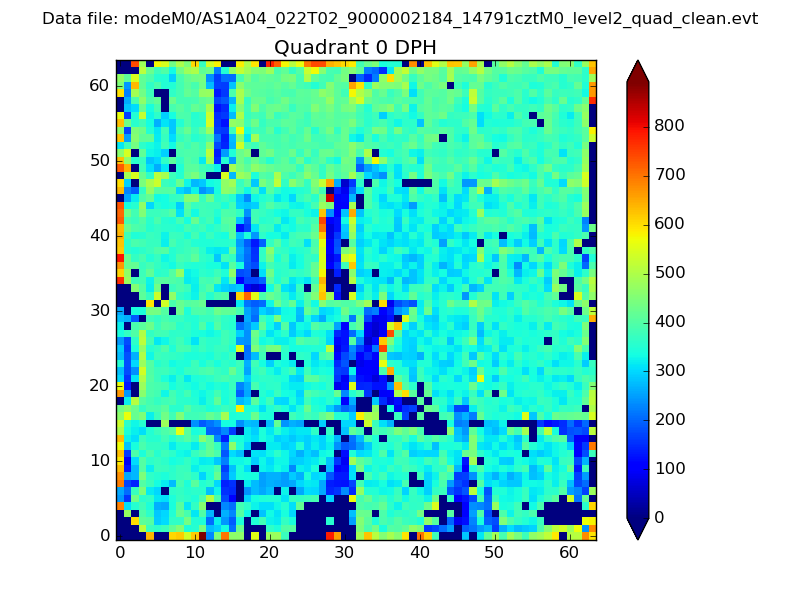 |
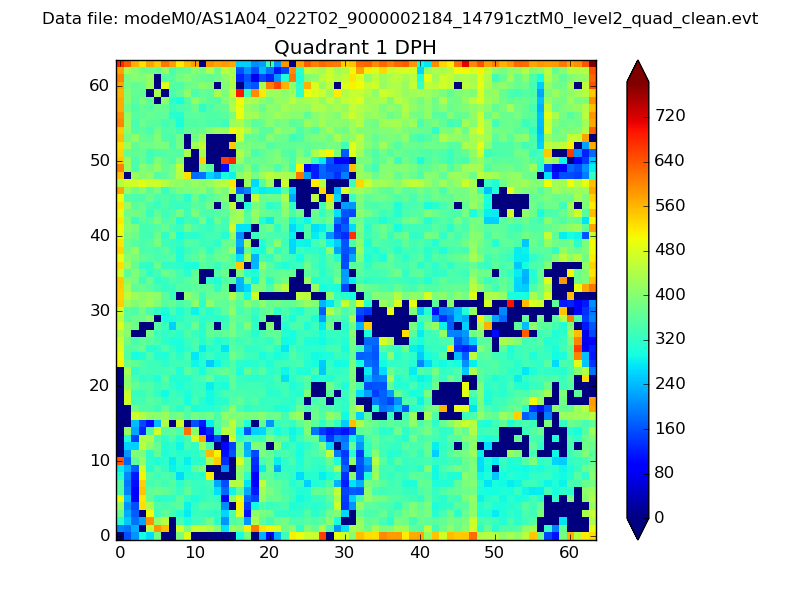 |
Quadrant B |
|---|---|---|---|
| Quadrant D | 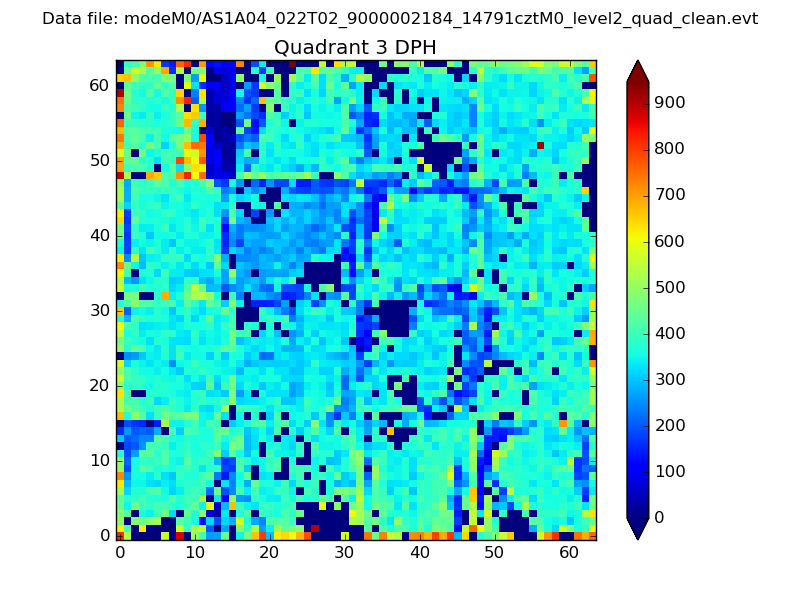 |
 |
Quadrant C |
| Plot type | Count rate plots | Images |
|---|---|---|
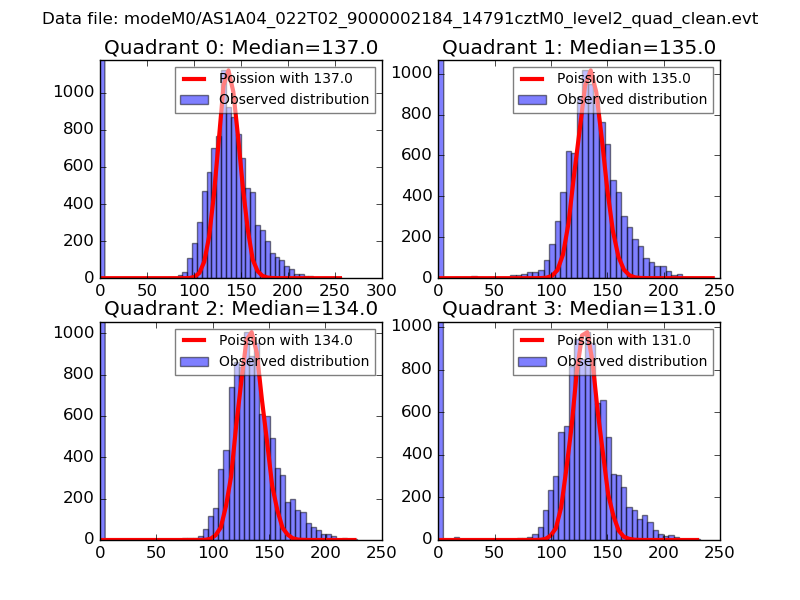
| Comparison with Poisson distribution Blue bars denote a histogram of data divided into 1 sec bins. Red curve is a Poisson curve with rate = median count rate of data. |
 |
 |
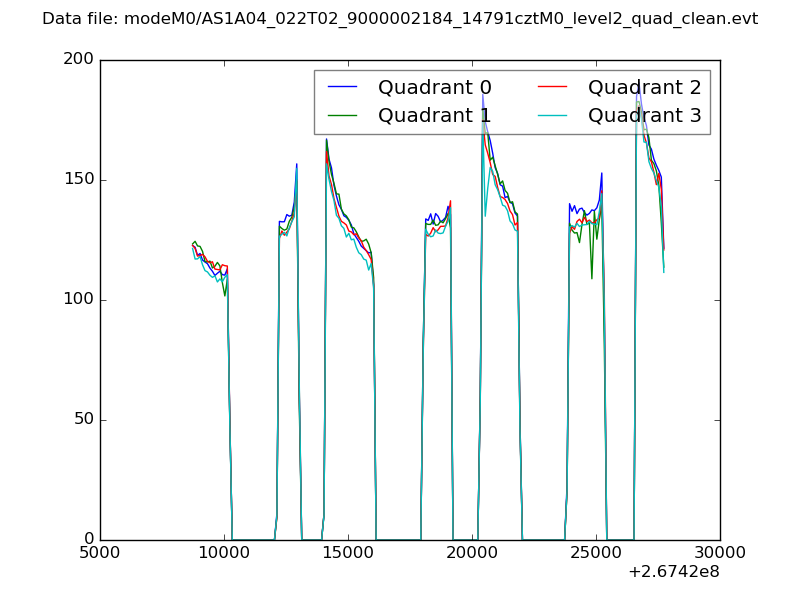
| Quadrant-wise count rates Data is divided into 100 sec bins |
 |
|
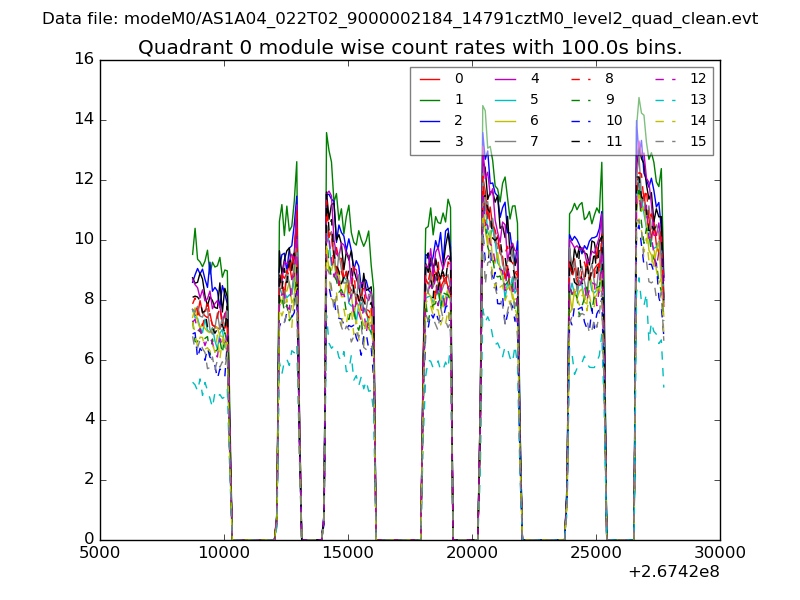
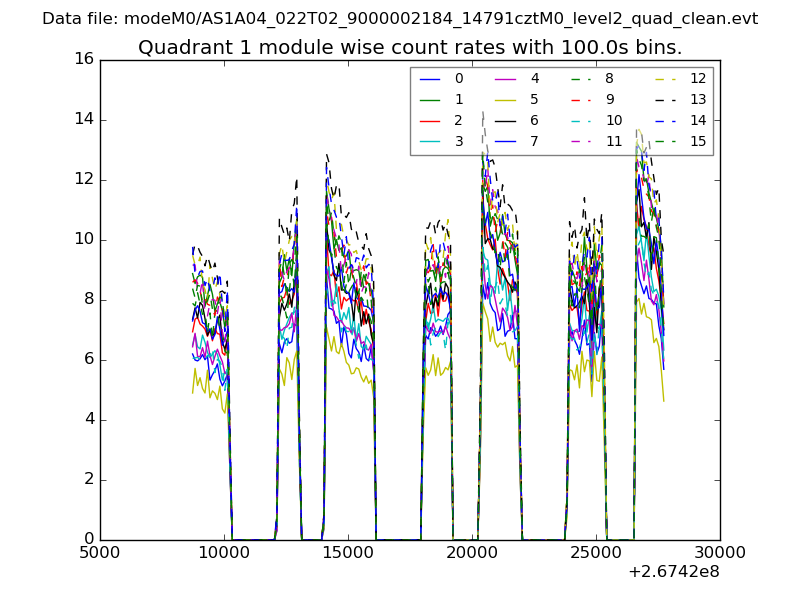
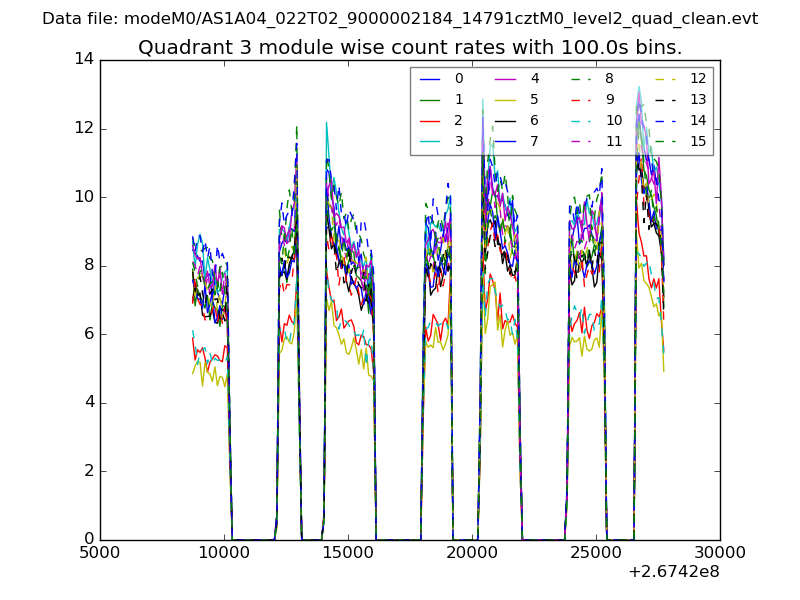
| Module-wise count rates for Quadrant A Data is divided into 100 sec bins |
 |
 |
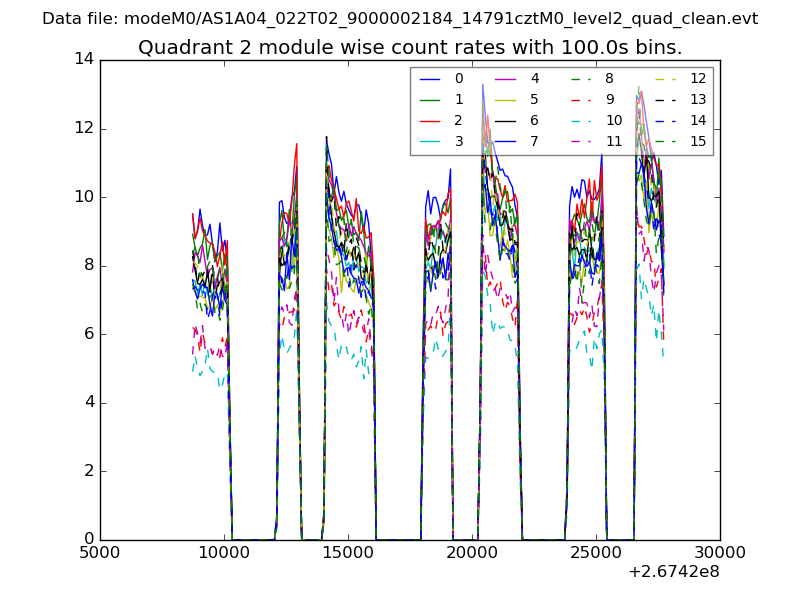
| Module-wise count rates for Quadrant B Data is divided into 100 sec bins |
 |
 |
| Module-wise count rates for Quadrant C Data is divided into 100 sec bins |
 |
 |
| Module-wise count rates for Quadrant D Data is divided into 100 sec bins |
 |
 |
| Parameter | Plot |
|---|---|
| CZT HV Monitor | 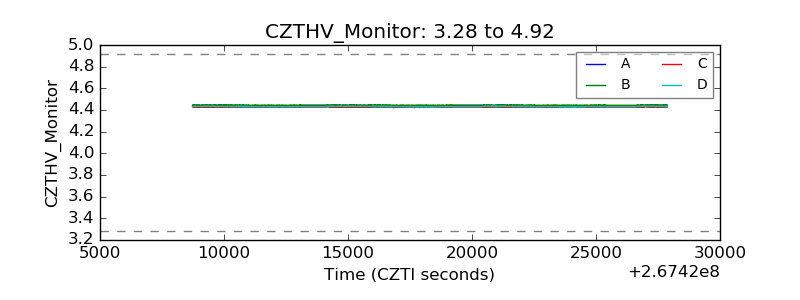 |
| D_VDD | 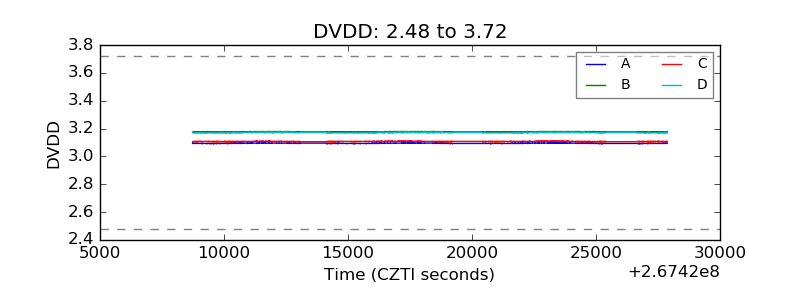 |
| Temperature 1 | 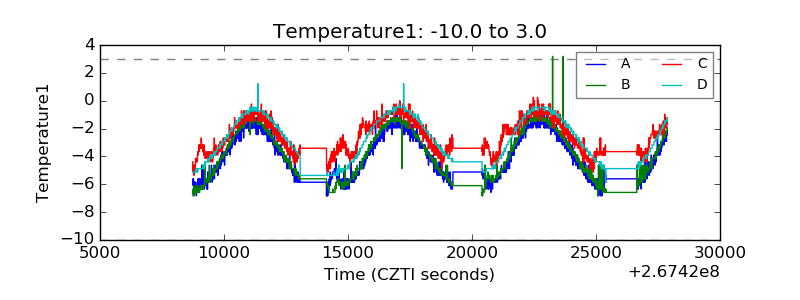 |
| Veto HV Monitor | 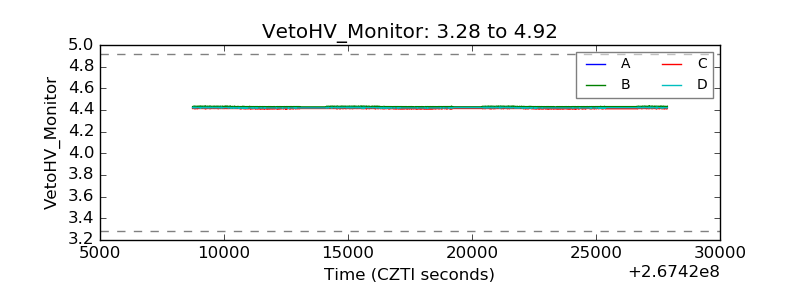 |
| Veto LLD | 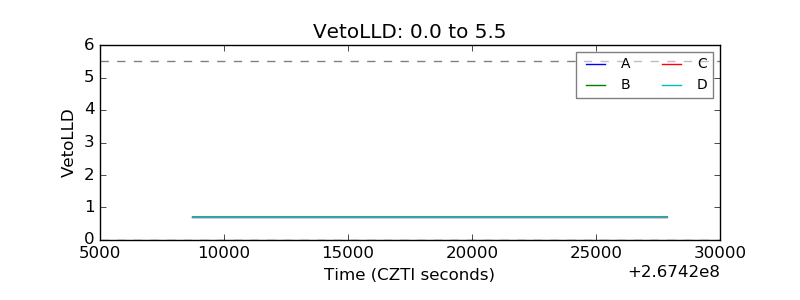 |
| Alpha Counter | 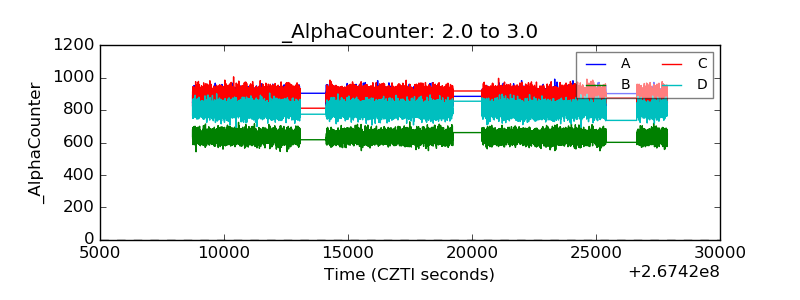 |
| _CPM_Rate | 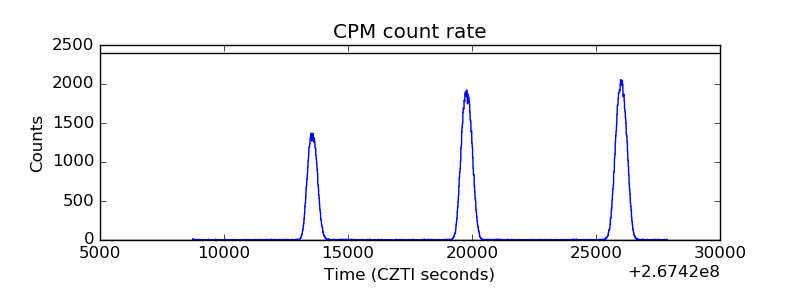 |
| CZT Counter | 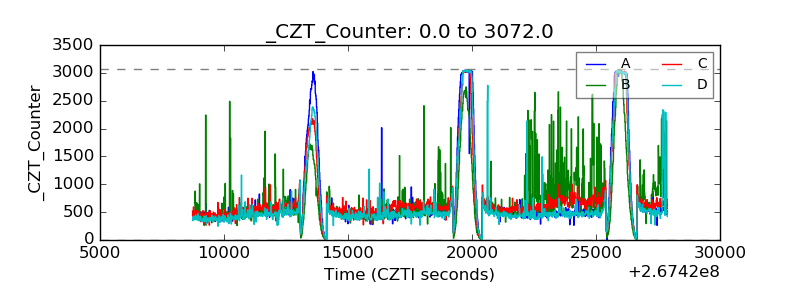 |
| +2.5 Volts monitor |  |
| +5 Volts monitor |  |
| _ROLL_ROT | 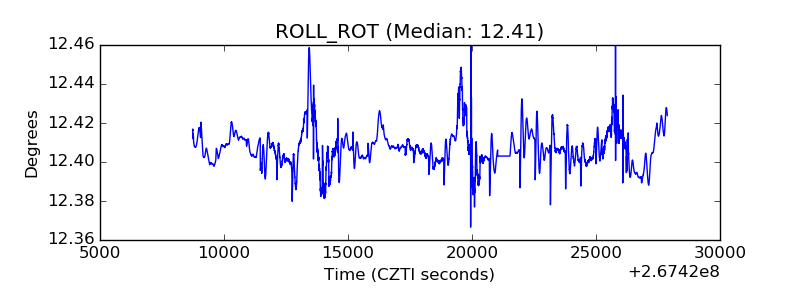 |
| _Roll_DEC | 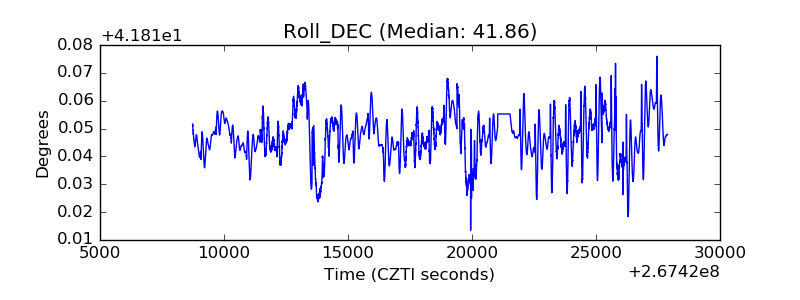 |
| _Roll_RA | 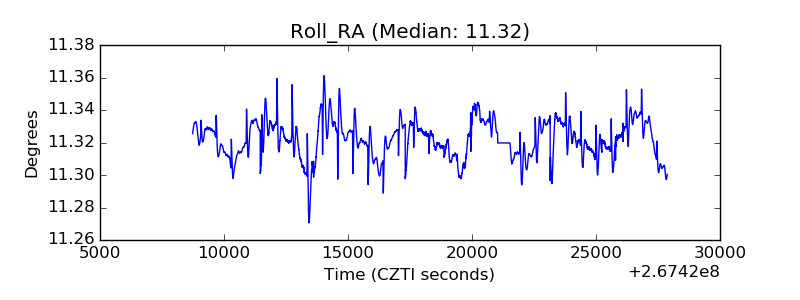 |
| Veto Counter | 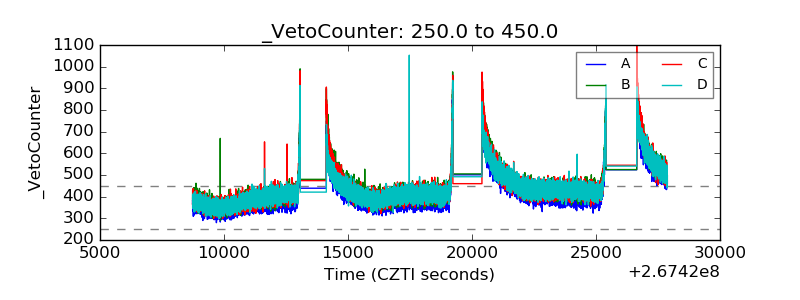 |