| Param | Original file | Final file |
|---|---|---|
| Filename | modeM0/AS1A04_022T02_9000002184_14792cztM0_level2.evt | modeM0/AS1A04_022T02_9000002184_14792cztM0_level2_quad_clean.evt |
| Size (bytes) | 535,726,080 | 86,290,560 |
| Size | 510.9 MB | 82.3 MB |
| Events in quadrant A | 3,249,210 | 565,107 |
| Events in quadrant B | 5,353,181 | 531,780 |
| Events in quadrant C | 3,874,281 | 547,959 |
| Events in quadrant D | 3,334,009 | 541,679 |
| Mode M0 | |||
|---|---|---|---|
| Quadrant | BADHDUFLAG | Total packets | Discarded packets |
| A | 0 | 13183 | 2 |
| B | 0 | 20070 | 1 |
| C | 0 | 16540 | 1 |
| D | 0 | 13609 | 1 |
| Mode M9 | |||
|---|---|---|---|
| Quadrant | BADHDUFLAG | Total packets | Discarded packets |
| A | 0 | 13 | 0 |
| B | 0 | 13 | 0 |
| C | 0 | 13 | 0 |
| D | 0 | 13 | 0 |
| Mode SS | |||
|---|---|---|---|
| Quadrant | BADHDUFLAG | Total packets | Discarded packets |
| A | 0 | 124 | 0 |
| B | 0 | 124 | 0 |
| C | 0 | 124 | 0 |
| D | 0 | 124 | 0 |
| Quadrant | Total seconds | Saturated seconds | Saturation percentage |
|---|---|---|---|
| A | 6108 | 95 | 1.555337% |
| B | 6108 | 612 | 10.019646% |
| C | 6108 | 81 | 1.326130% |
| D | 6108 | 130 | 2.128356% |
Noise dominated data is calculated using 1-second bins in cleaned event files. If a bin has >2000 counts, and if more than 50% of those come from <1% of pixels, then it is considered to be noise-dominated and hence unusable.
| Quadrant | # 1 sec bins | Bins with >0 counts | Bins with >2000 counts | High rate bins dominated by noise | Noise dominated (total time) | Noise dominated (detector-on time) | Marked lightcurve |
|---|---|---|---|---|---|---|---|
| A | 7410 | 6111 | 0 | 0 | 0.00% | 0.00% | 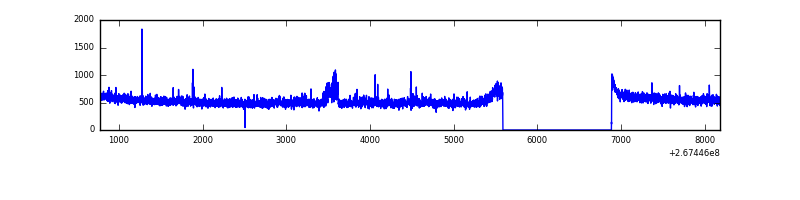 |
| B | 7410 | 6111 | 389 | 389 | 5.25% | 6.37% | 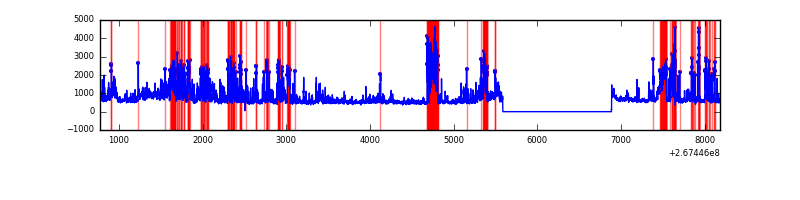 |
| C | 7410 | 6111 | 0 | 0 | 0.00% | 0.00% | 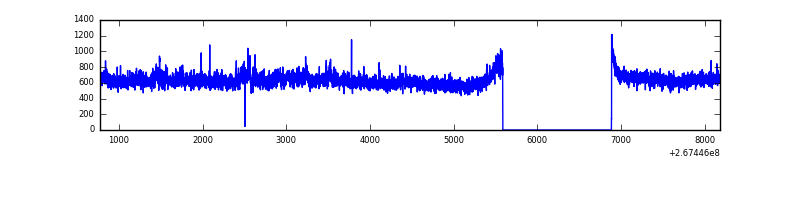 |
| D | 7410 | 6111 | 65 | 65 | 0.88% | 1.06% | 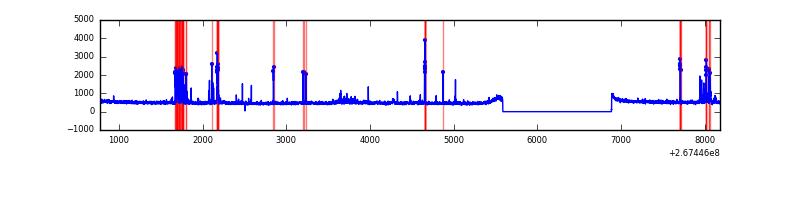 |
Top three noisy pixels from each quadrant. If the there are fewer than three noisy pixels in the level2.evt file, extra rows are filled as -1
| Pixel properties | Quadrant properties | ||||||
|---|---|---|---|---|---|---|---|
| Quadrant | DetID | PixID | Counts | Sigma | Mean | Median | Sigma |
| A | 12 | 189 | 69802 | 417.25 | 823 | 809 | 165.4 |
| A | 9 | 143 | 14255 | 81.32 | 823 | 809 | 165.4 |
| A | 0 | 226 | 7479 | 40.34 | 823 | 809 | 165.4 |
| B | 10 | 16 | 1350592 | 9393.78 | 774 | 758 | 143.7 |
| B | 3 | 64 | 595427 | 4138.43 | 774 | 758 | 143.7 |
| B | 0 | 229 | 277265 | 1924.27 | 774 | 758 | 143.7 |
| C | 3 | 233 | 845184 | 4776.18 | 776 | 784 | 176.8 |
| C | 13 | 61 | 5562 | 27.03 | 776 | 784 | 176.8 |
| C | 3 | 232 | 2244 | 8.26 | 776 | 784 | 176.8 |
| D | 15 | 0 | 165549 | 787.53 | 784 | 767 | 209.2 |
| D | 13 | 172 | 63540 | 300.01 | 784 | 767 | 209.2 |
| D | 2 | 33 | 39923 | 187.13 | 784 | 767 | 209.2 |
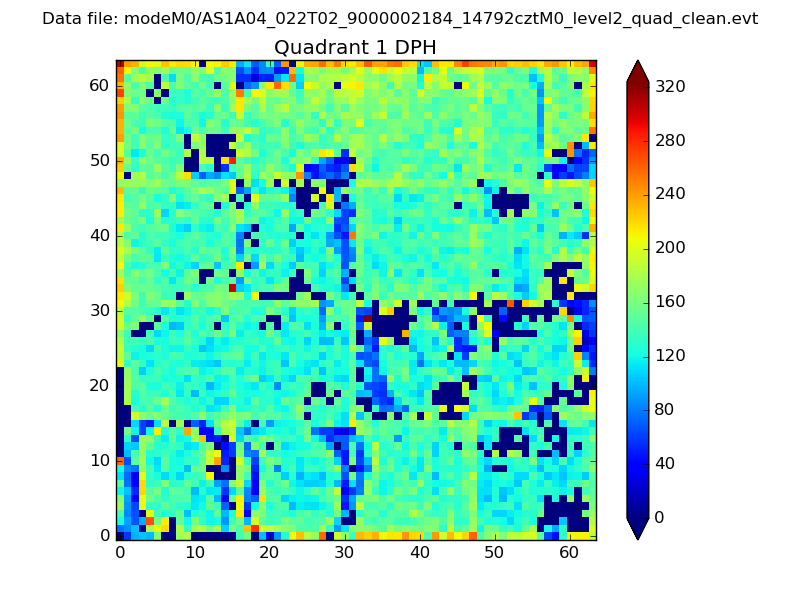
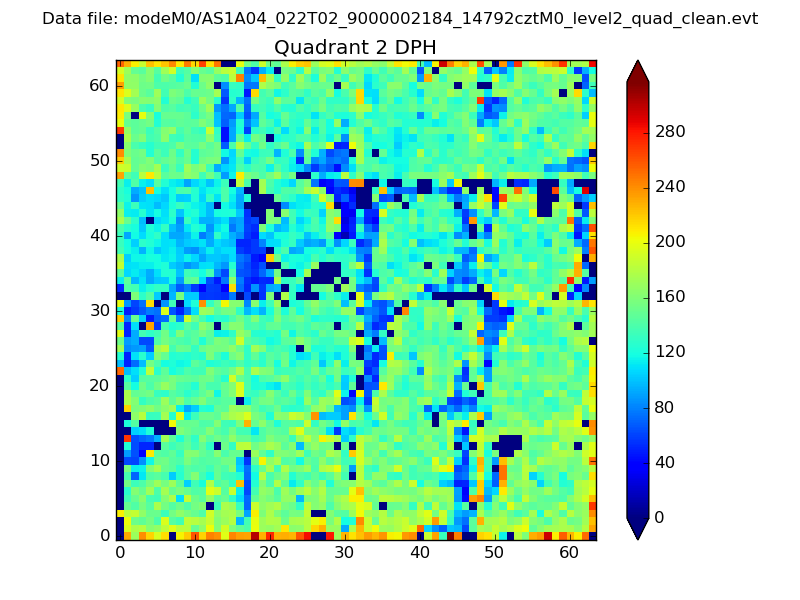
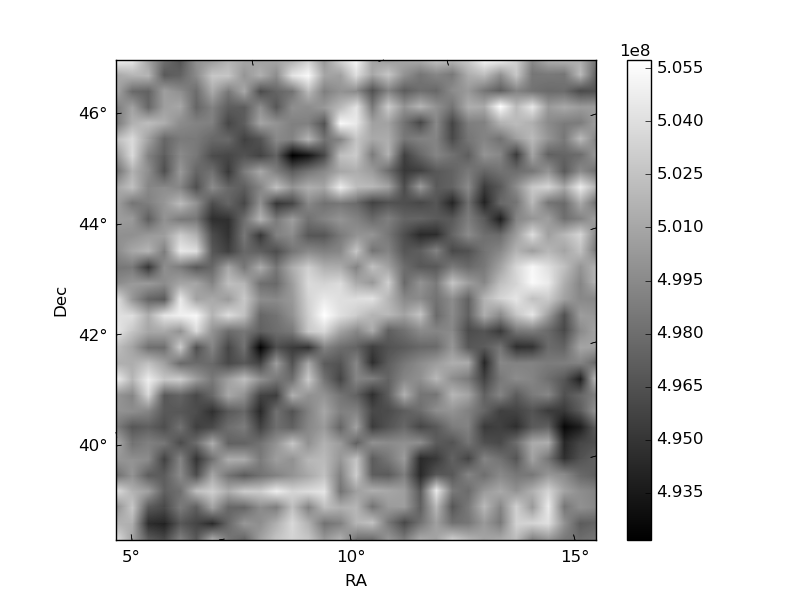
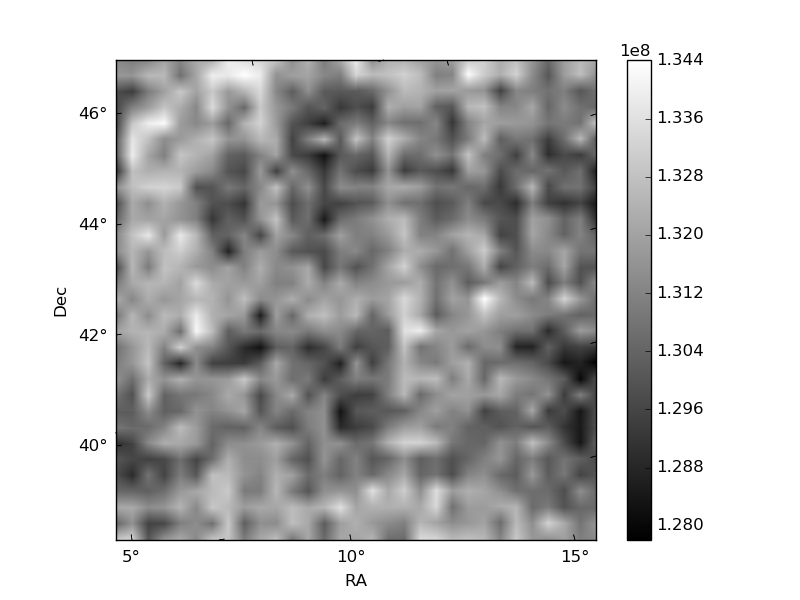
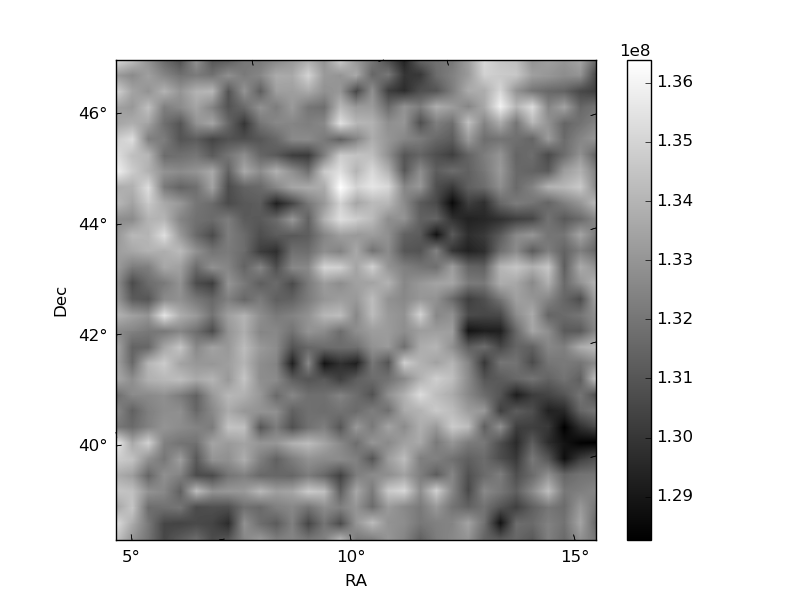
Histogram calculated using DETX and DETY for each event in the final _common_clean file
| Quadrant A |  |
 |
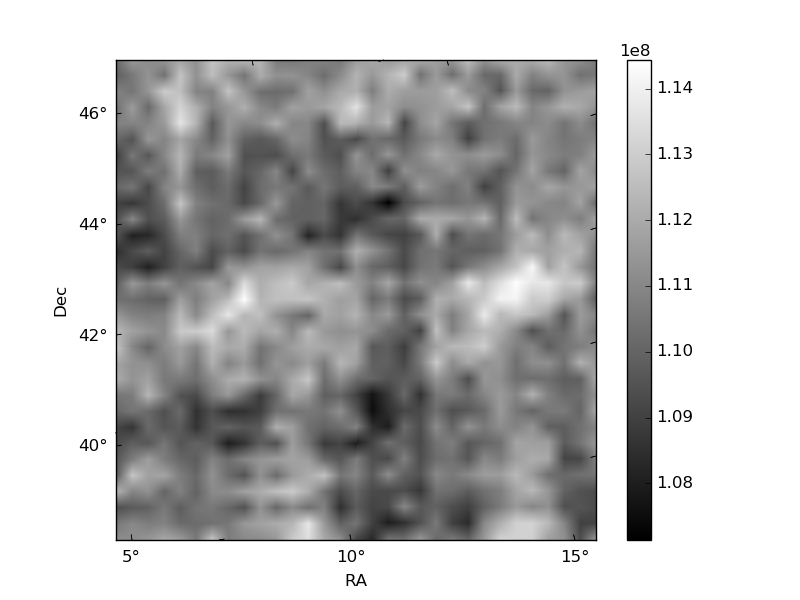
Quadrant B |
|---|---|---|---|
| Quadrant D | 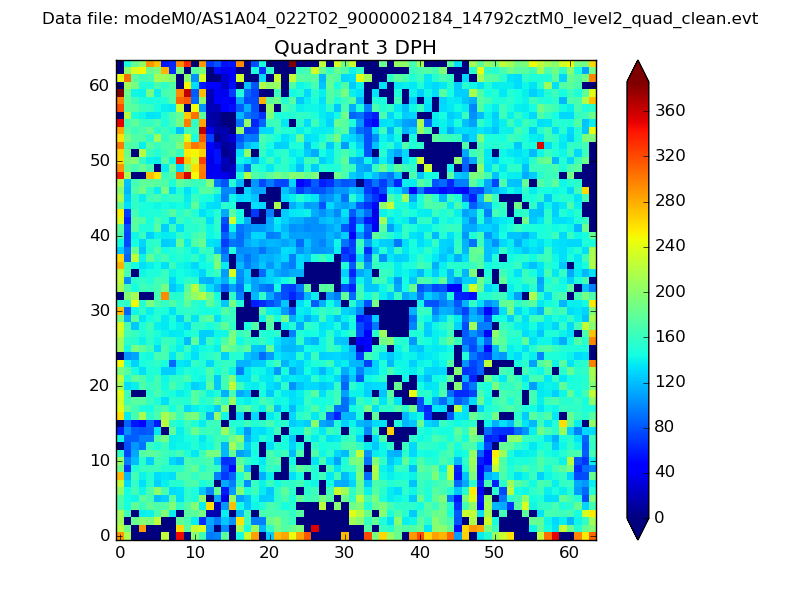 |
 |
Quadrant C |
| Plot type | Count rate plots | Images |
|---|---|---|
| Comparison with Poisson distribution Blue bars denote a histogram of data divided into 1 sec bins. Red curve is a Poisson curve with rate = median count rate of data. |
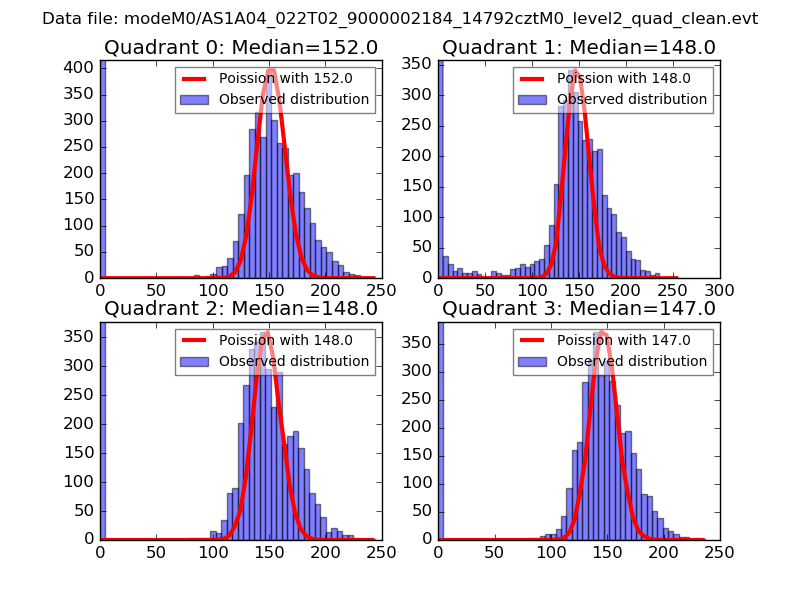 |
 |
| Quadrant-wise count rates Data is divided into 100 sec bins |
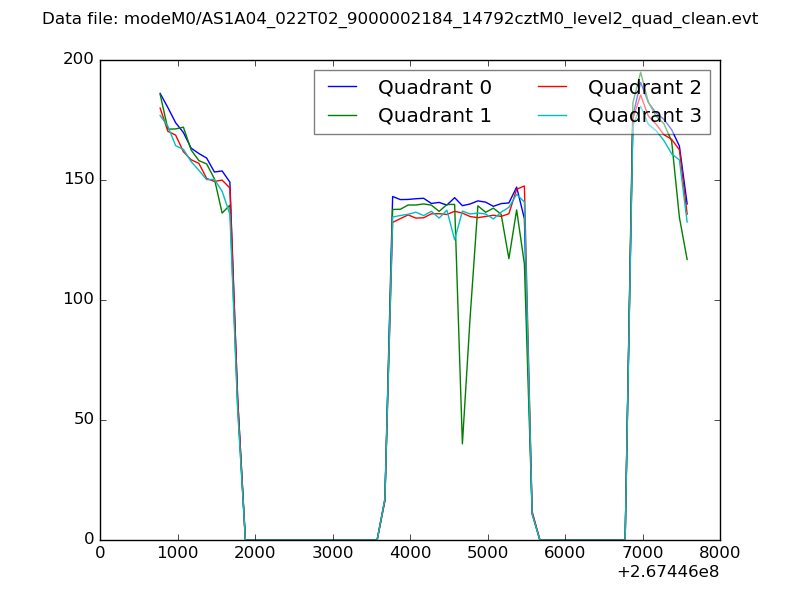 |
|
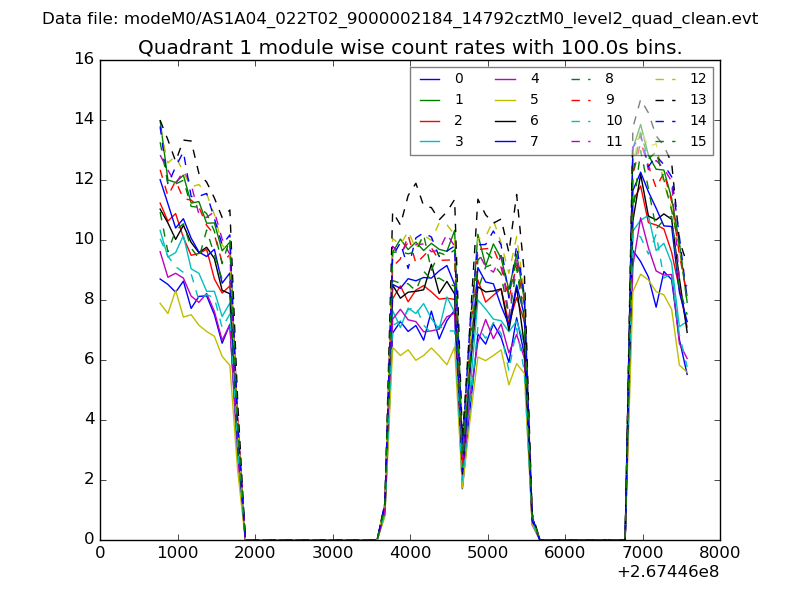
| Module-wise count rates for Quadrant A Data is divided into 100 sec bins |
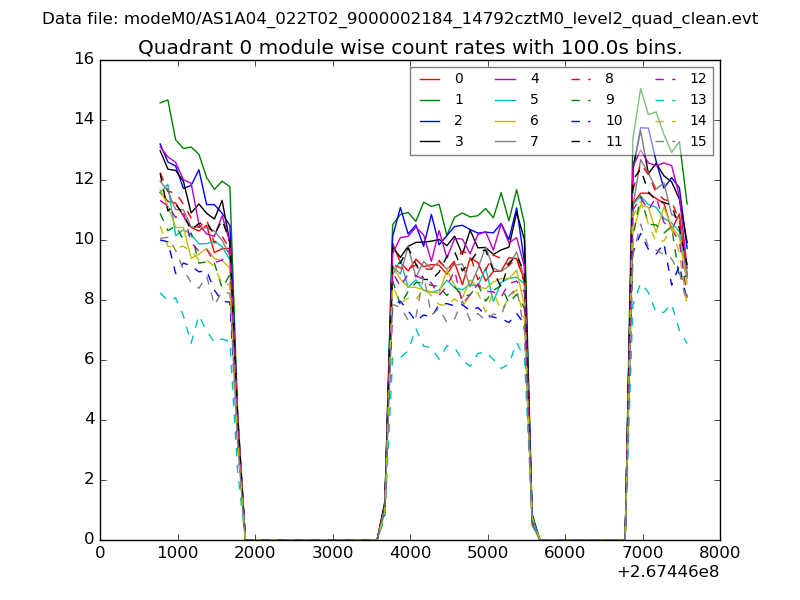 |
 |
| Module-wise count rates for Quadrant B Data is divided into 100 sec bins |
 |
 |
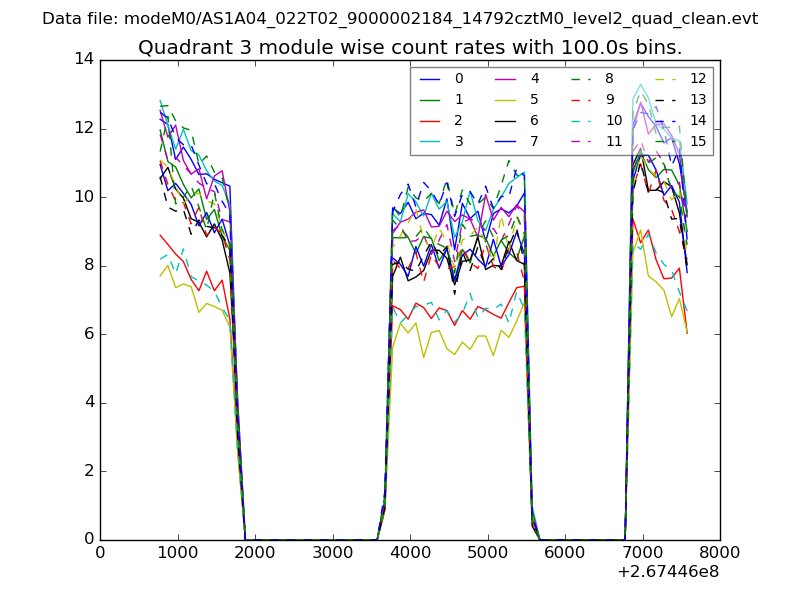
| Module-wise count rates for Quadrant C Data is divided into 100 sec bins |
 |
 |
| Module-wise count rates for Quadrant D Data is divided into 100 sec bins |
 |
 |
| Parameter | Plot |
|---|---|
| CZT HV Monitor | 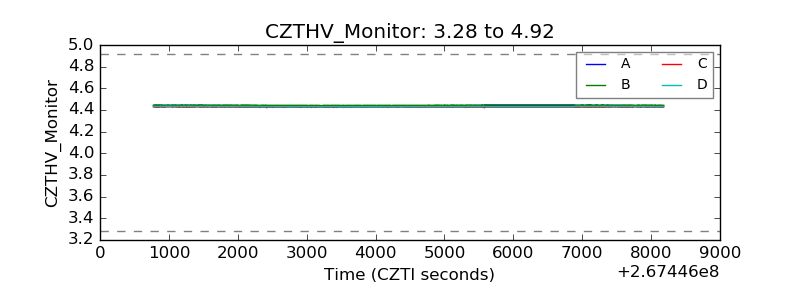 |
| D_VDD | 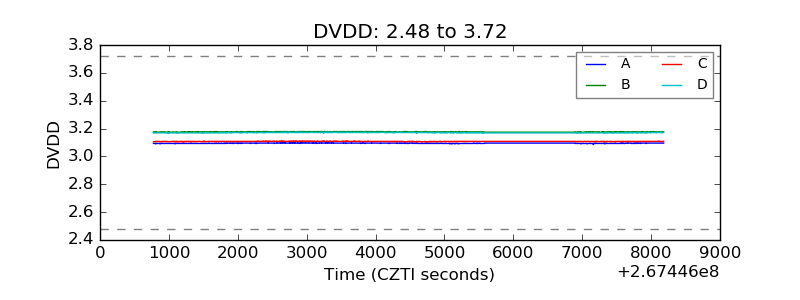 |
| Temperature 1 | 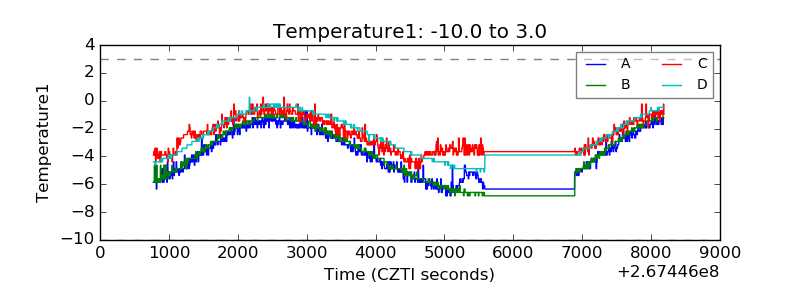 |
| Veto HV Monitor |  |
| Veto LLD | 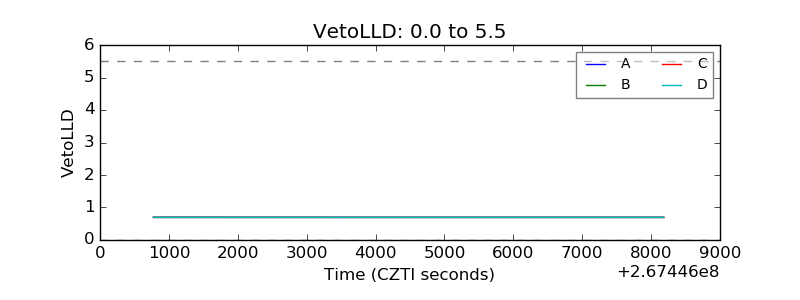 |
| Alpha Counter | 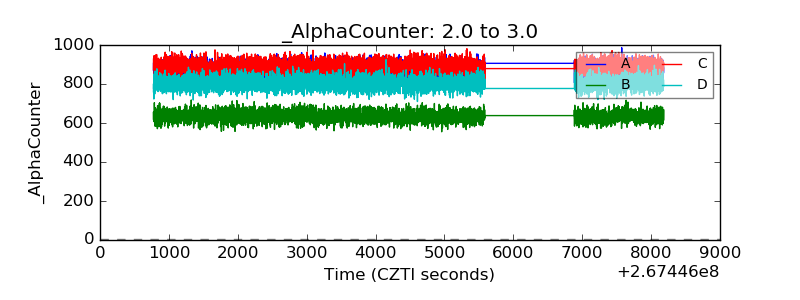 |
| _CPM_Rate | 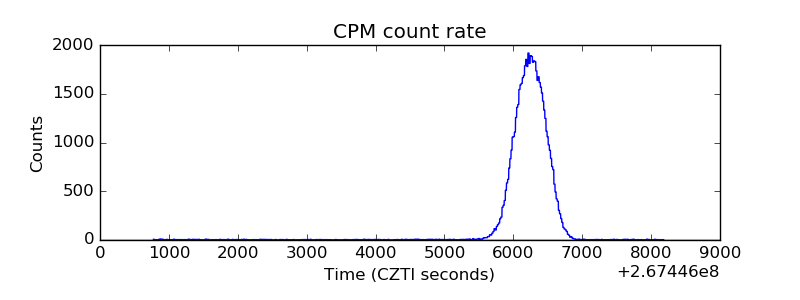 |
| CZT Counter | 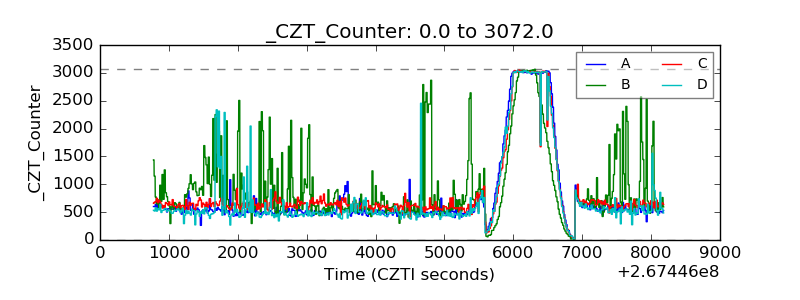 |
| +2.5 Volts monitor |  |
| +5 Volts monitor |  |
| _ROLL_ROT | 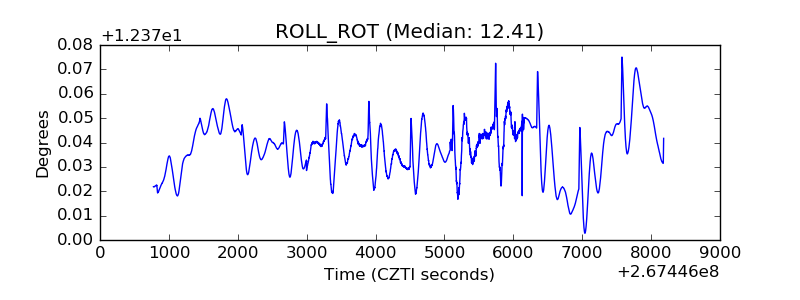 |
| _Roll_DEC | 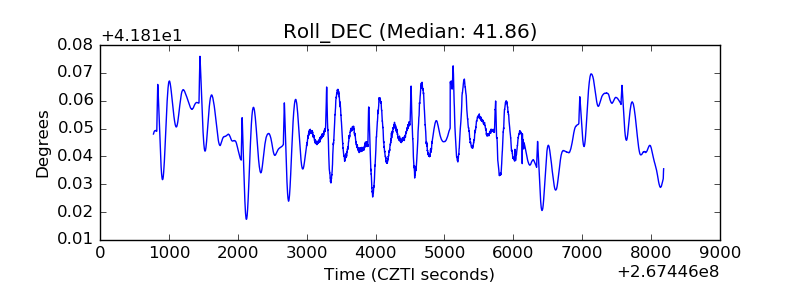 |
| _Roll_RA | 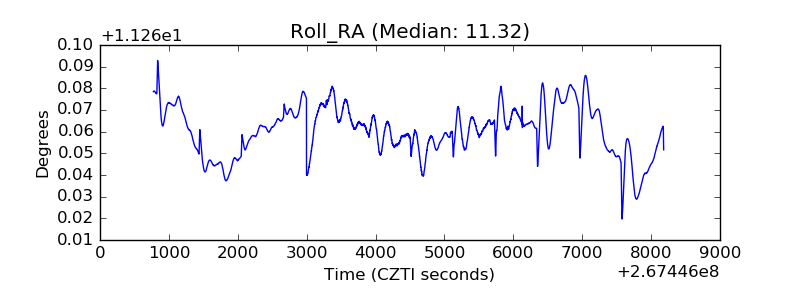 |
| Veto Counter |  |