| Param | Original file | Final file |
|---|---|---|
| Filename | modeM0/AS1A04_022T02_9000002184_14793cztM0_level2.evt | modeM0/AS1A04_022T02_9000002184_14793cztM0_level2_quad_clean.evt |
| Size (bytes) | 496,442,880 | 75,473,280 |
| Size | 473.4 MB | 72.0 MB |
| Events in quadrant A | 3,313,263 | 473,532 |
| Events in quadrant B | 4,092,007 | 459,260 |
| Events in quadrant C | 3,958,418 | 458,858 |
| Events in quadrant D | 3,242,086 | 452,307 |
| Mode M0 | |||
|---|---|---|---|
| Quadrant | BADHDUFLAG | Total packets | Discarded packets |
| A | 0 | 13433 | 2 |
| B | 0 | 16060 | 1 |
| C | 0 | 16866 | 1 |
| D | 0 | 13369 | 1 |
| Mode M9 | |||
|---|---|---|---|
| Quadrant | BADHDUFLAG | Total packets | Discarded packets |
| A | 0 | 13 | 0 |
| B | 0 | 13 | 0 |
| C | 0 | 13 | 0 |
| D | 0 | 13 | 0 |
| Mode SS | |||
|---|---|---|---|
| Quadrant | BADHDUFLAG | Total packets | Discarded packets |
| A | 0 | 128 | 0 |
| B | 0 | 128 | 0 |
| C | 0 | 128 | 0 |
| D | 0 | 128 | 0 |
| Quadrant | Total seconds | Saturated seconds | Saturation percentage |
|---|---|---|---|
| A | 6325 | 93 | 1.470356% |
| B | 6325 | 331 | 5.233202% |
| C | 6325 | 72 | 1.138340% |
| D | 6325 | 91 | 1.438735% |
Noise dominated data is calculated using 1-second bins in cleaned event files. If a bin has >2000 counts, and if more than 50% of those come from <1% of pixels, then it is considered to be noise-dominated and hence unusable.
| Quadrant | # 1 sec bins | Bins with >0 counts | Bins with >2000 counts | High rate bins dominated by noise | Noise dominated (total time) | Noise dominated (detector-on time) | Marked lightcurve |
|---|---|---|---|---|---|---|---|
| A | 7651 | 6327 | 1 | 1 | 0.01% | 0.02% | 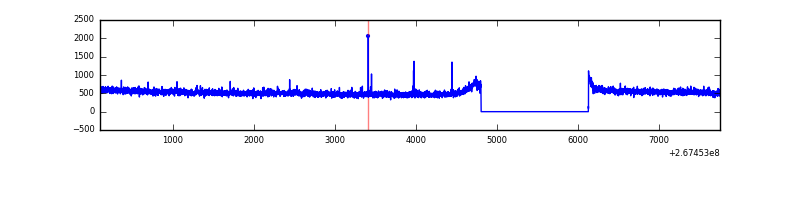 |
| B | 7651 | 6327 | 142 | 142 | 1.86% | 2.24% | 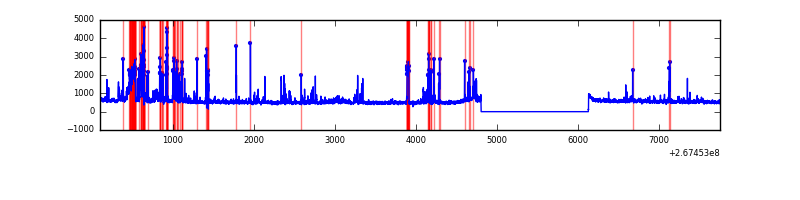 |
| C | 7651 | 6327 | 0 | 0 | 0.00% | 0.00% | 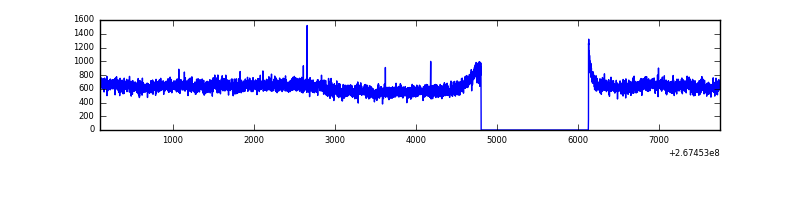 |
| D | 7651 | 6327 | 18 | 18 | 0.24% | 0.28% | 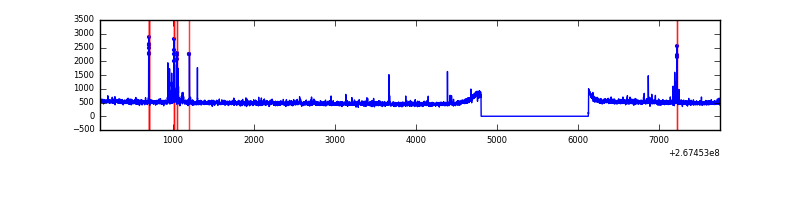 |
Top three noisy pixels from each quadrant. If the there are fewer than three noisy pixels in the level2.evt file, extra rows are filled as -1
| Pixel properties | Quadrant properties | ||||||
|---|---|---|---|---|---|---|---|
| Quadrant | DetID | PixID | Counts | Sigma | Mean | Median | Sigma |
| A | 12 | 189 | 42023 | 242.51 | 848 | 831 | 169.9 |
| A | 7 | 32 | 8800 | 46.92 | 848 | 831 | 169.9 |
| A | 0 | 226 | 7686 | 40.36 | 848 | 831 | 169.9 |
| B | 10 | 16 | 306988 | 2008.54 | 820 | 802 | 152.4 |
| B | 0 | 229 | 192341 | 1256.47 | 820 | 802 | 152.4 |
| B | 3 | 64 | 187899 | 1227.33 | 820 | 802 | 152.4 |
| C | 3 | 233 | 814405 | 4473.08 | 804 | 810 | 181.9 |
| C | 13 | 61 | 5818 | 27.53 | 804 | 810 | 181.9 |
| C | 3 | 232 | 3251 | 13.42 | 804 | 810 | 181.9 |
| D | 13 | 172 | 58714 | 267.39 | 813 | 798 | 216.6 |
| D | 2 | 120 | 26713 | 119.65 | 813 | 798 | 216.6 |
| D | 2 | 234 | 25558 | 114.32 | 813 | 798 | 216.6 |
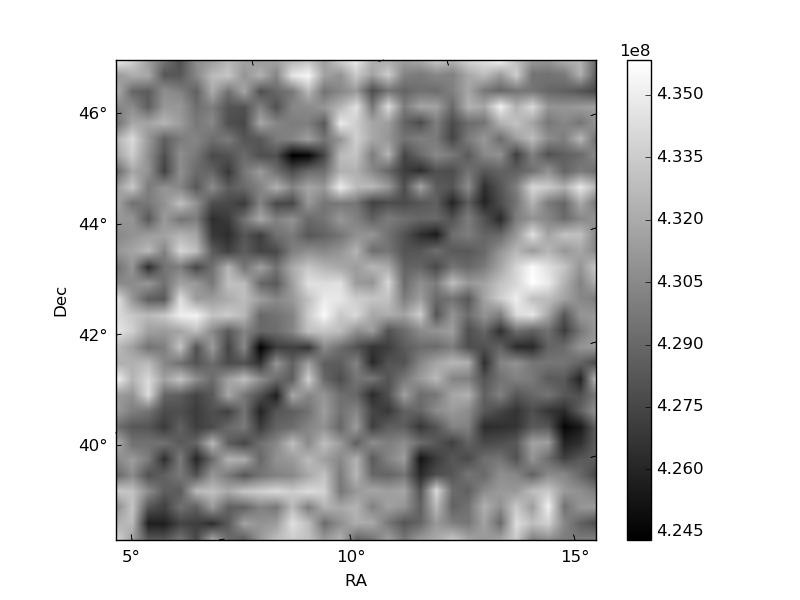
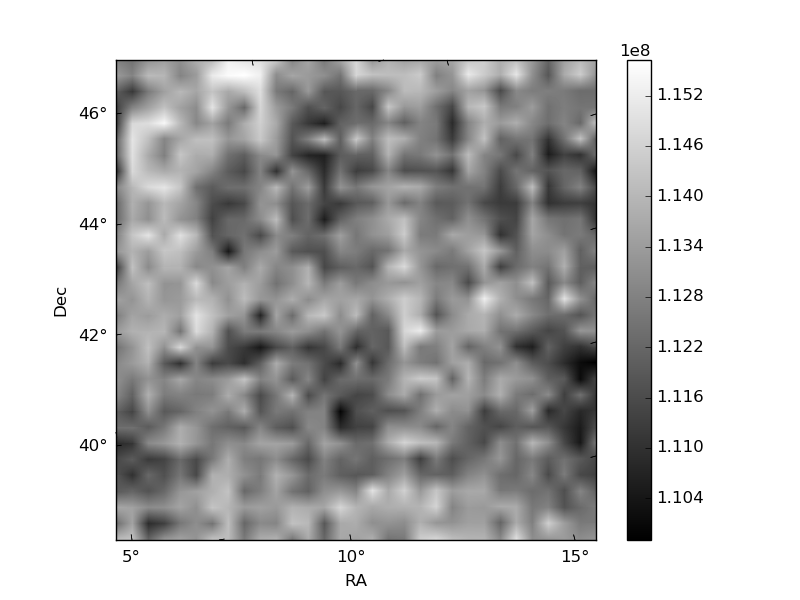
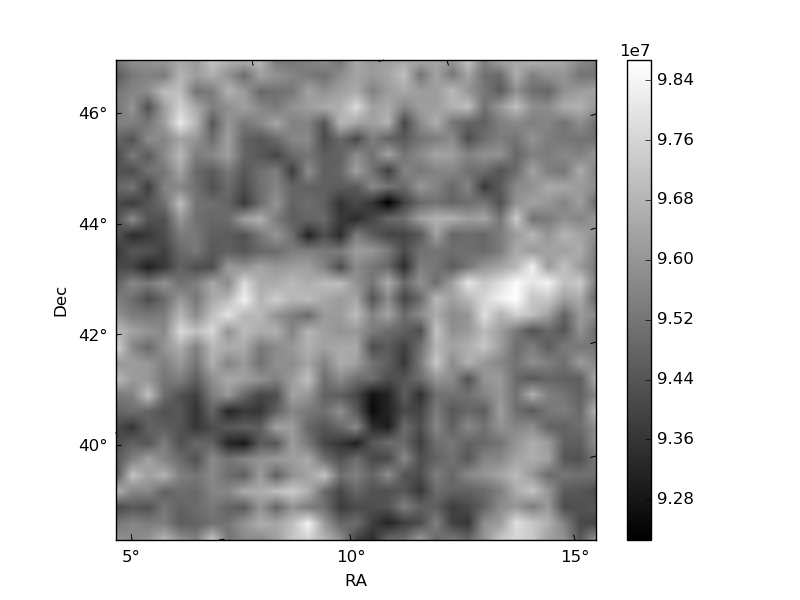
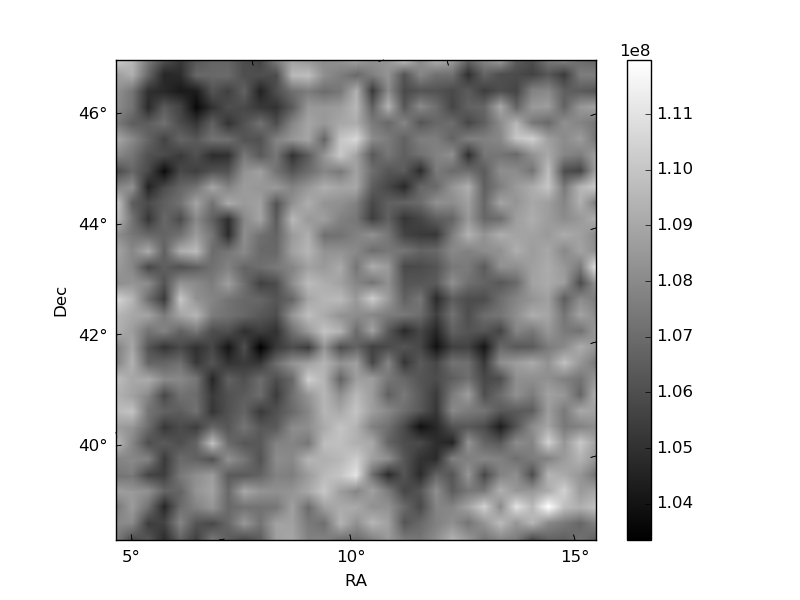
Histogram calculated using DETX and DETY for each event in the final _common_clean file
| Quadrant A | 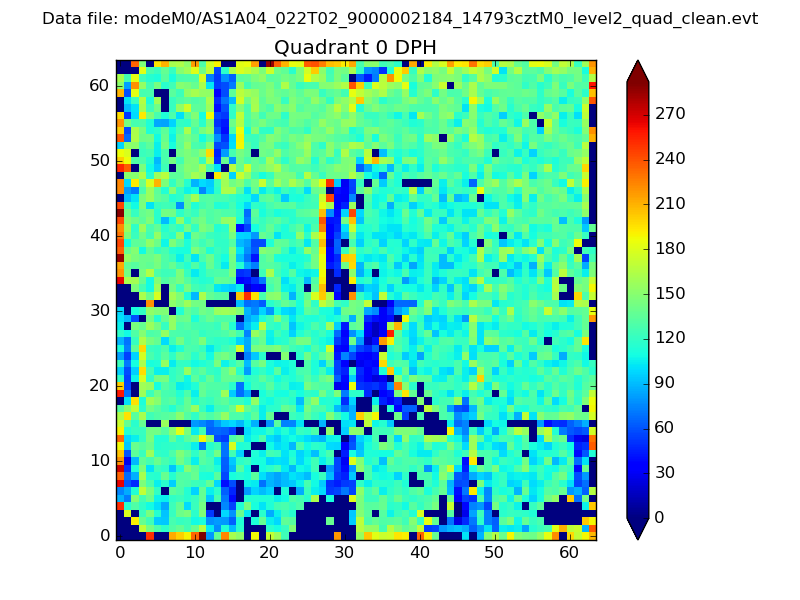 |
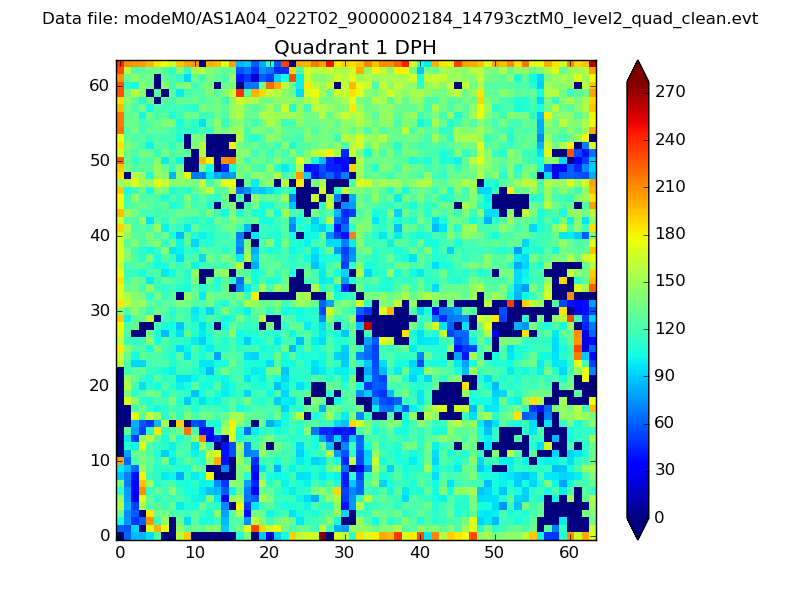 |
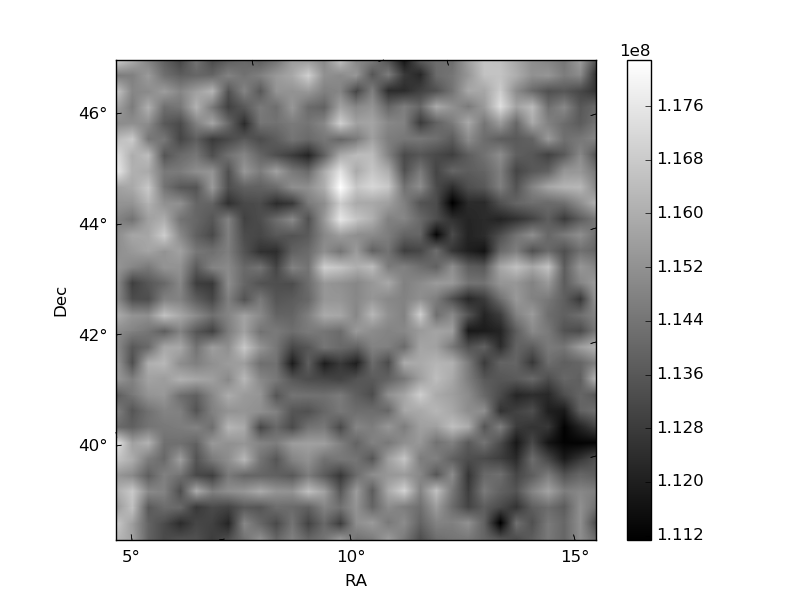
Quadrant B |
|---|---|---|---|
| Quadrant D | 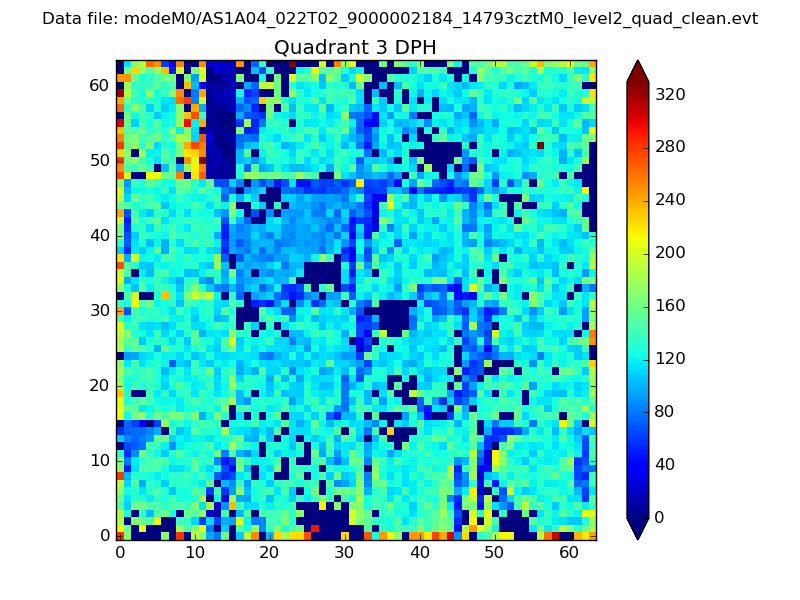 |
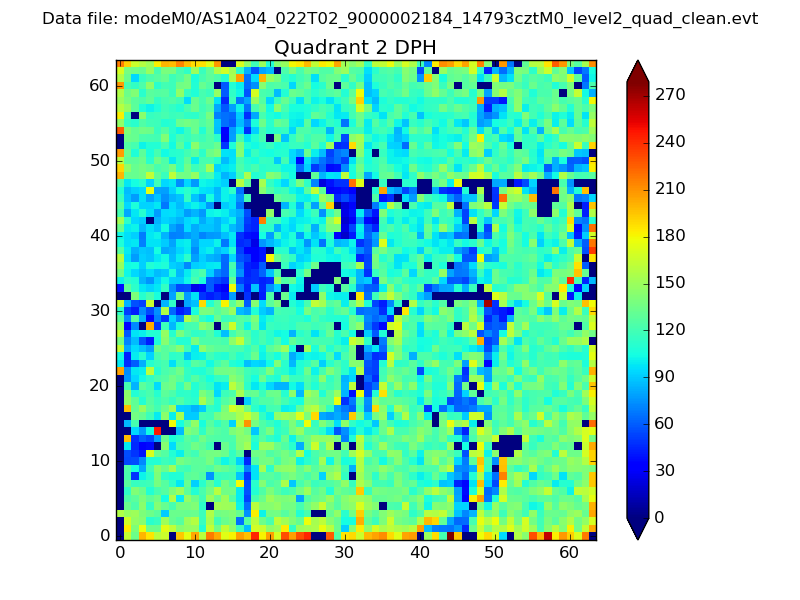 |
Quadrant C |
| Plot type | Count rate plots | Images |
|---|---|---|
| Comparison with Poisson distribution Blue bars denote a histogram of data divided into 1 sec bins. Red curve is a Poisson curve with rate = median count rate of data. |
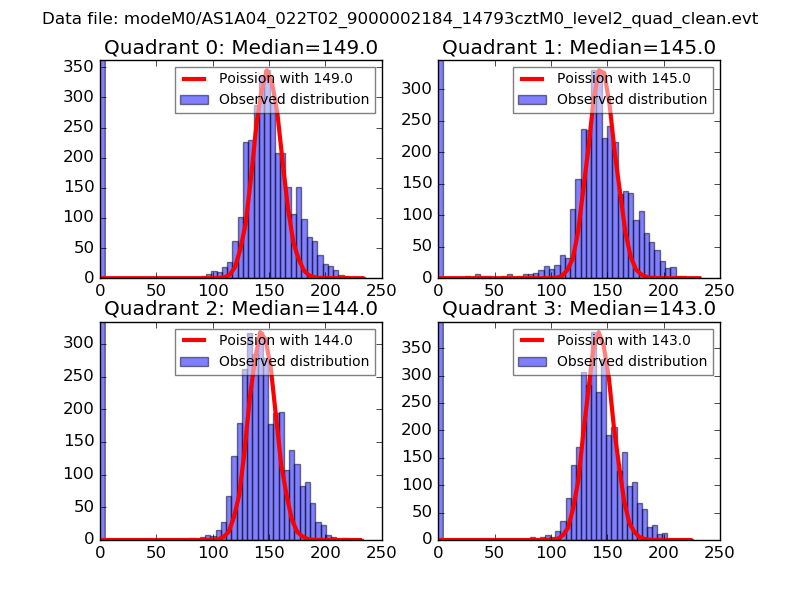 |
 |
| Quadrant-wise count rates Data is divided into 100 sec bins |
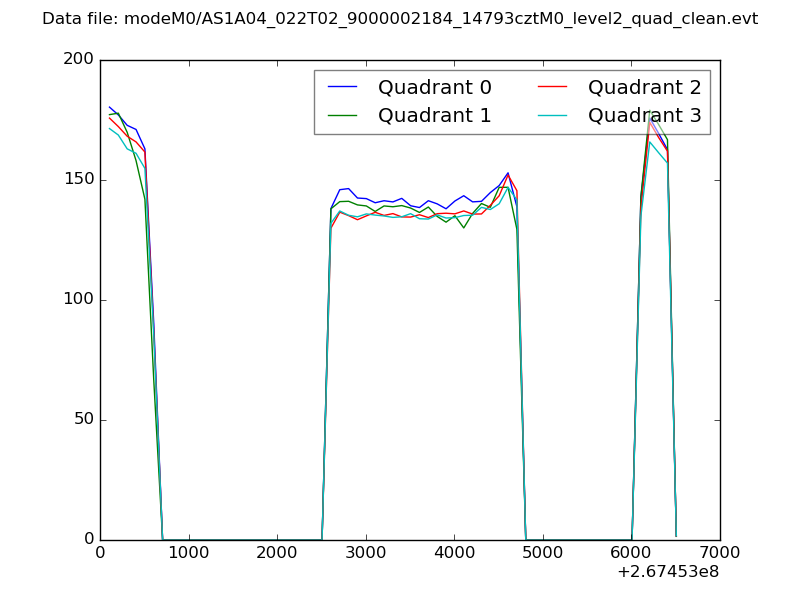 |
|
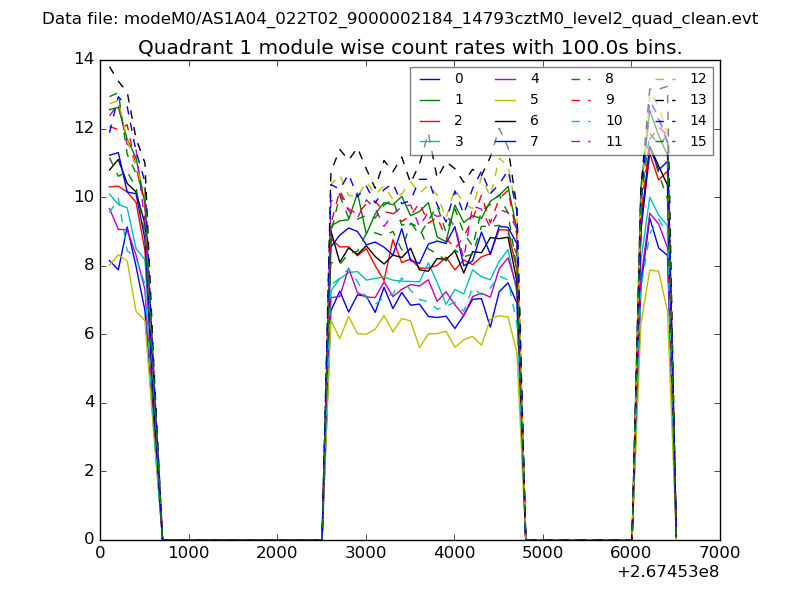
| Module-wise count rates for Quadrant A Data is divided into 100 sec bins |
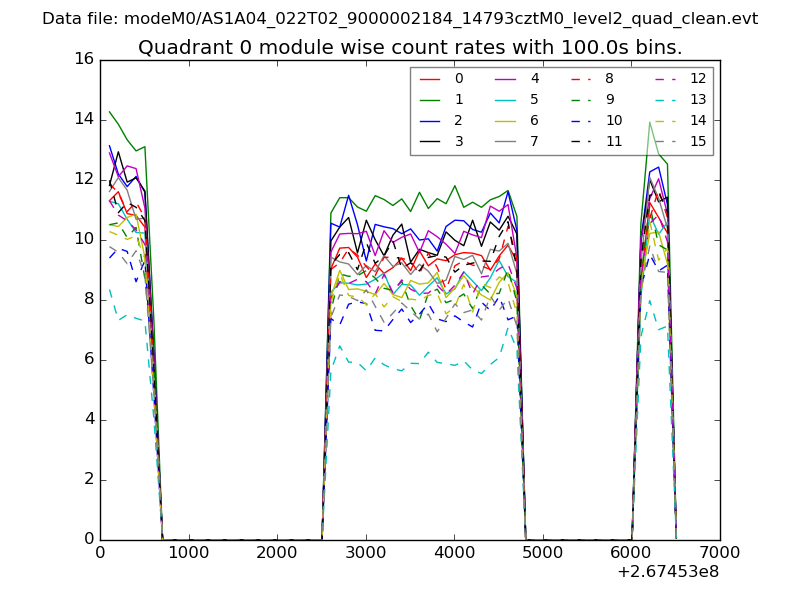 |
 |
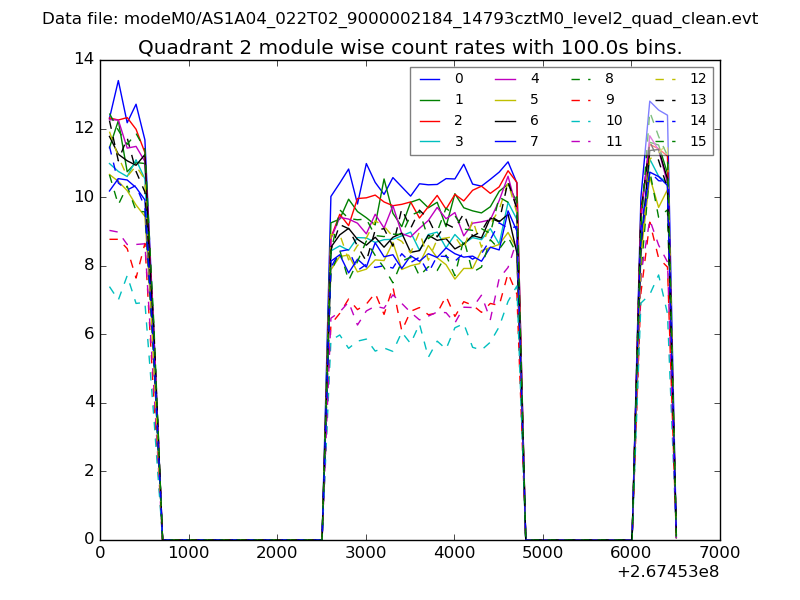
| Module-wise count rates for Quadrant B Data is divided into 100 sec bins |
 |
 |
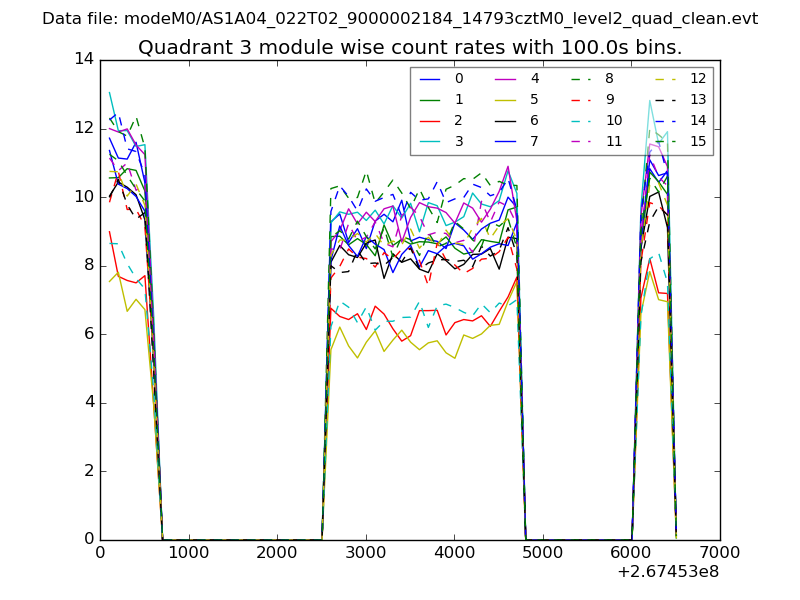
| Module-wise count rates for Quadrant C Data is divided into 100 sec bins |
 |
 |
| Module-wise count rates for Quadrant D Data is divided into 100 sec bins |
 |
 |
| Parameter | Plot |
|---|---|
| CZT HV Monitor | 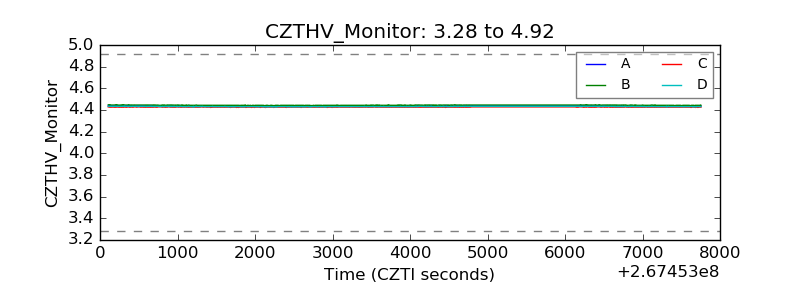 |
| D_VDD | 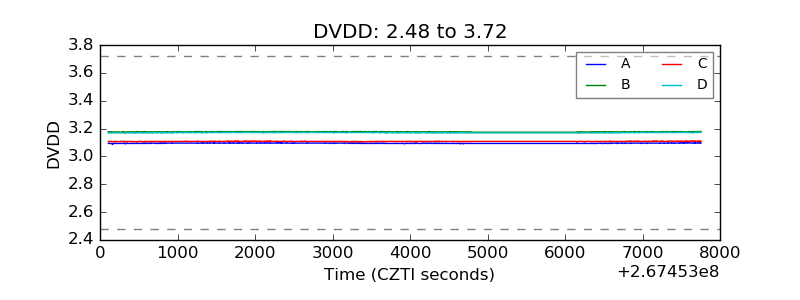 |
| Temperature 1 | 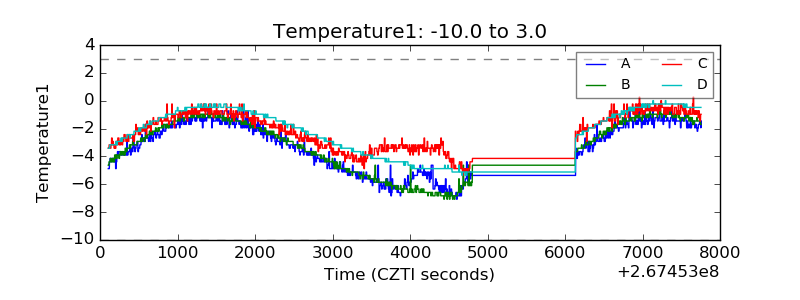 |
| Veto HV Monitor | 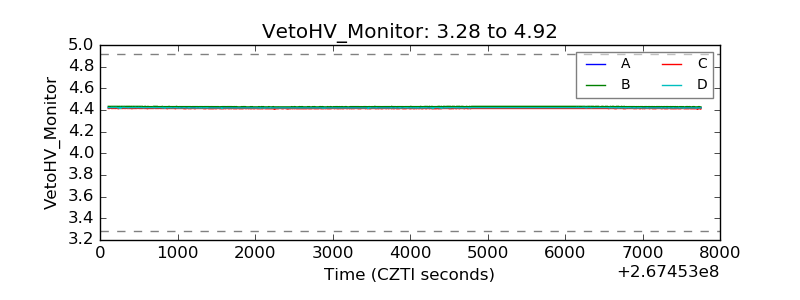 |
| Veto LLD | 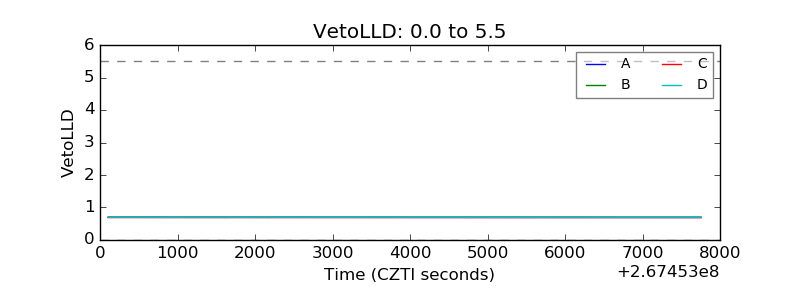 |
| Alpha Counter | 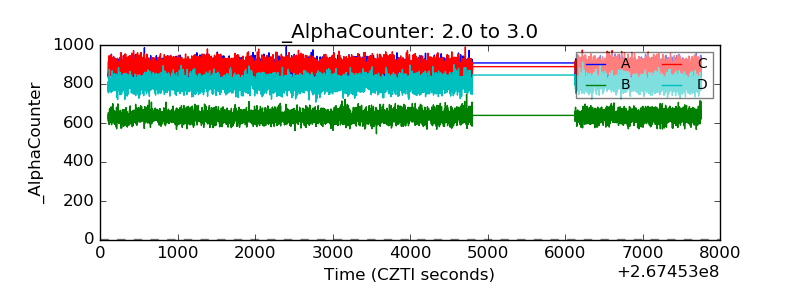 |
| _CPM_Rate | 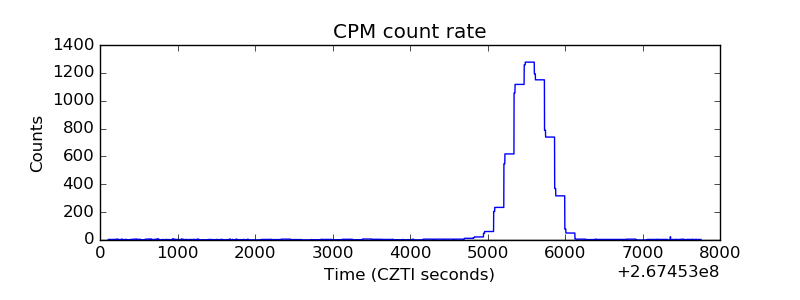 |
| CZT Counter | 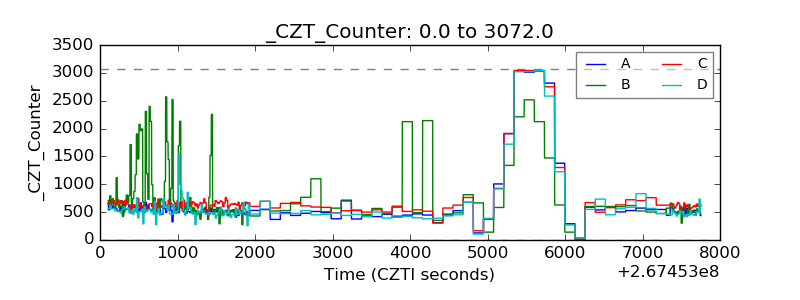 |
| +2.5 Volts monitor |  |
| +5 Volts monitor | 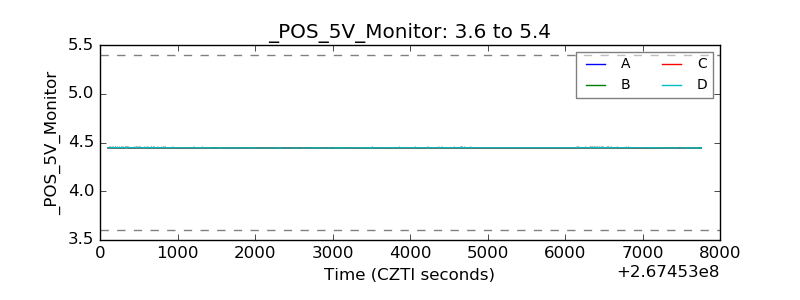 |
| _ROLL_ROT | 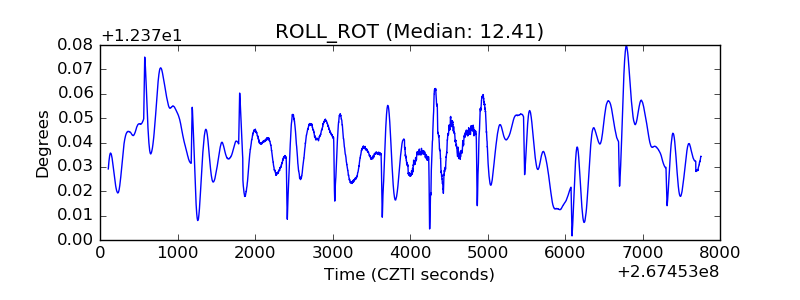 |
| _Roll_DEC | 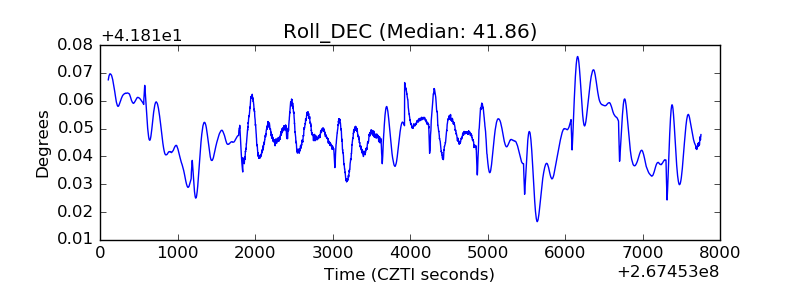 |
| _Roll_RA | 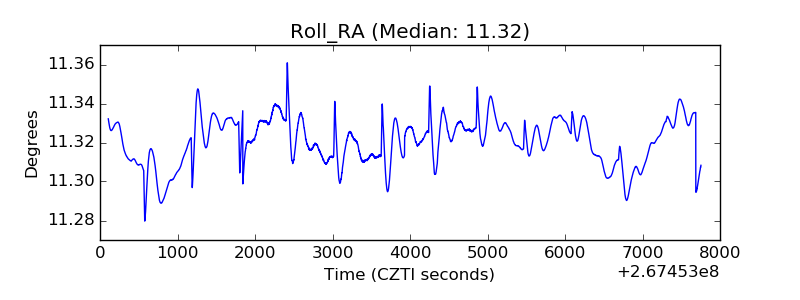 |
| Veto Counter | 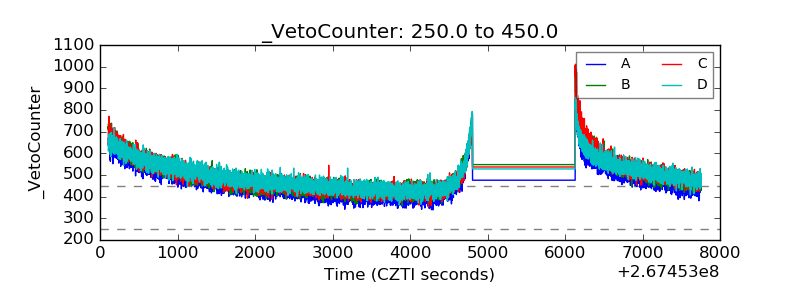 |