| Param | Original file | Final file |
|---|---|---|
| Filename | modeM0/AS1A04_022T02_9000002184_14794cztM0_level2.evt | modeM0/AS1A04_022T02_9000002184_14794cztM0_level2_quad_clean.evt |
| Size (bytes) | 491,086,080 | 64,555,200 |
| Size | 468.3 MB | 61.6 MB |
| Events in quadrant A | 3,287,980 | 390,598 |
| Events in quadrant B | 3,445,038 | 387,736 |
| Events in quadrant C | 4,327,683 | 363,549 |
| Events in quadrant D | 3,386,593 | 375,276 |
| Mode M0 | |||
|---|---|---|---|
| Quadrant | BADHDUFLAG | Total packets | Discarded packets |
| A | 0 | 13500 | 2 |
| B | 0 | 13986 | 1 |
| C | 0 | 17588 | 1 |
| D | 0 | 13990 | 1 |
| Mode M9 | |||
|---|---|---|---|
| Quadrant | BADHDUFLAG | Total packets | Discarded packets |
| A | 0 | 12 | 0 |
| B | 0 | 12 | 0 |
| C | 0 | 12 | 0 |
| D | 0 | 12 | 0 |
| Mode SS | |||
|---|---|---|---|
| Quadrant | BADHDUFLAG | Total packets | Discarded packets |
| A | 0 | 126 | 0 |
| B | 0 | 126 | 0 |
| C | 0 | 126 | 0 |
| D | 0 | 126 | 0 |
| Quadrant | Total seconds | Saturated seconds | Saturation percentage |
|---|---|---|---|
| A | 6270 | 133 | 2.121212% |
| B | 6270 | 145 | 2.312600% |
| C | 6270 | 304 | 4.848485% |
| D | 6270 | 106 | 1.690590% |
Noise dominated data is calculated using 1-second bins in cleaned event files. If a bin has >2000 counts, and if more than 50% of those come from <1% of pixels, then it is considered to be noise-dominated and hence unusable.
| Quadrant | # 1 sec bins | Bins with >0 counts | Bins with >2000 counts | High rate bins dominated by noise | Noise dominated (total time) | Noise dominated (detector-on time) | Marked lightcurve |
|---|---|---|---|---|---|---|---|
| A | 7461 | 6273 | 0 | 0 | 0.00% | 0.00% | 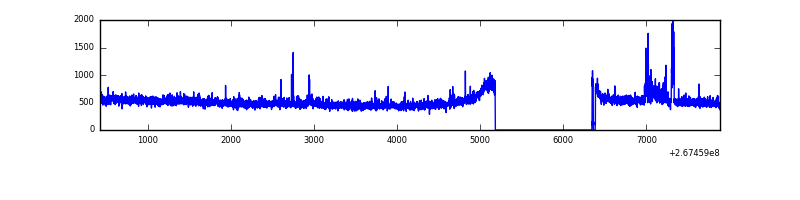 |
| B | 7461 | 6273 | 11 | 11 | 0.15% | 0.18% | 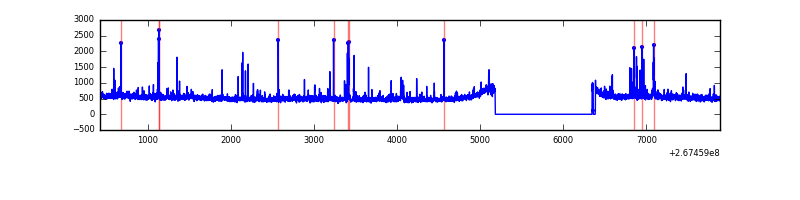 |
| C | 7461 | 6273 | 128 | 128 | 1.72% | 2.04% | 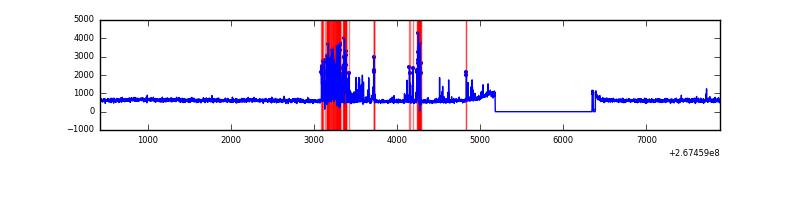 |
| D | 7461 | 6273 | 7 | 7 | 0.09% | 0.11% | 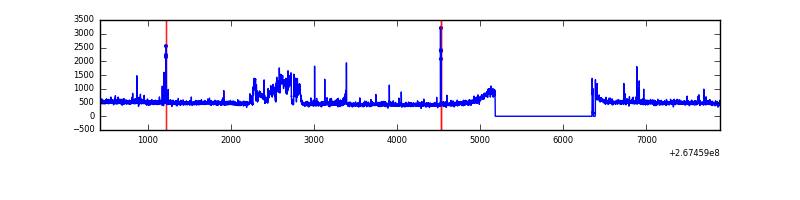 |
Top three noisy pixels from each quadrant. If the there are fewer than three noisy pixels in the level2.evt file, extra rows are filled as -1
| Pixel properties | Quadrant properties | ||||||
|---|---|---|---|---|---|---|---|
| Quadrant | DetID | PixID | Counts | Sigma | Mean | Median | Sigma |
| A | 0 | 23 | 75048 | 450.04 | 818 | 802 | 165.0 |
| A | 12 | 189 | 56656 | 338.56 | 818 | 802 | 165.0 |
| A | 0 | 226 | 12400 | 70.3 | 818 | 802 | 165.0 |
| B | 0 | 228 | 62146 | 404.48 | 807 | 790 | 151.7 |
| B | 3 | 64 | 47769 | 309.7 | 807 | 790 | 151.7 |
| B | 0 | 229 | 43011 | 278.33 | 807 | 790 | 151.7 |
| C | 3 | 233 | 754012 | 4284.97 | 772 | 776 | 175.8 |
| C | 4 | 254 | 556773 | 3162.93 | 772 | 776 | 175.8 |
| C | 13 | 61 | 5604 | 27.47 | 772 | 776 | 175.8 |
| D | 15 | 0 | 303296 | 1434.85 | 790 | 772 | 210.8 |
| D | 2 | 120 | 32067 | 148.43 | 790 | 772 | 210.8 |
| D | 2 | 234 | 24360 | 111.88 | 790 | 772 | 210.8 |
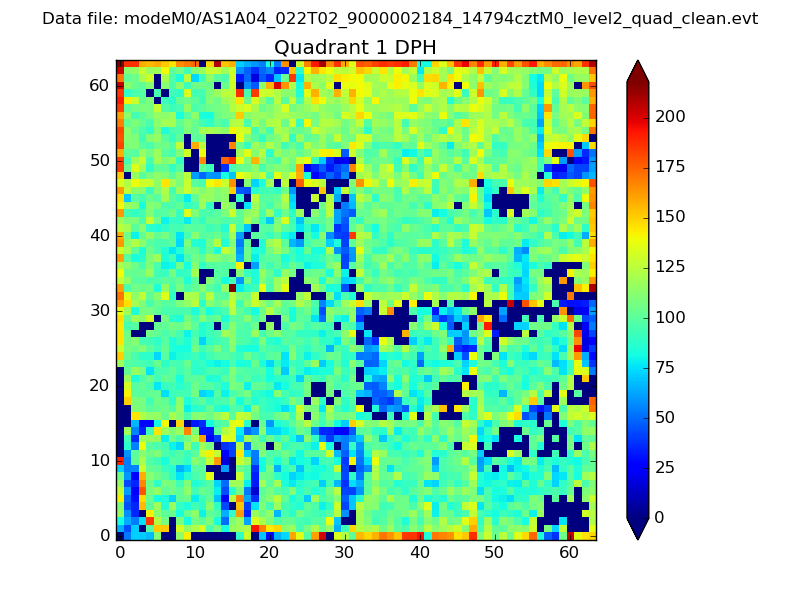
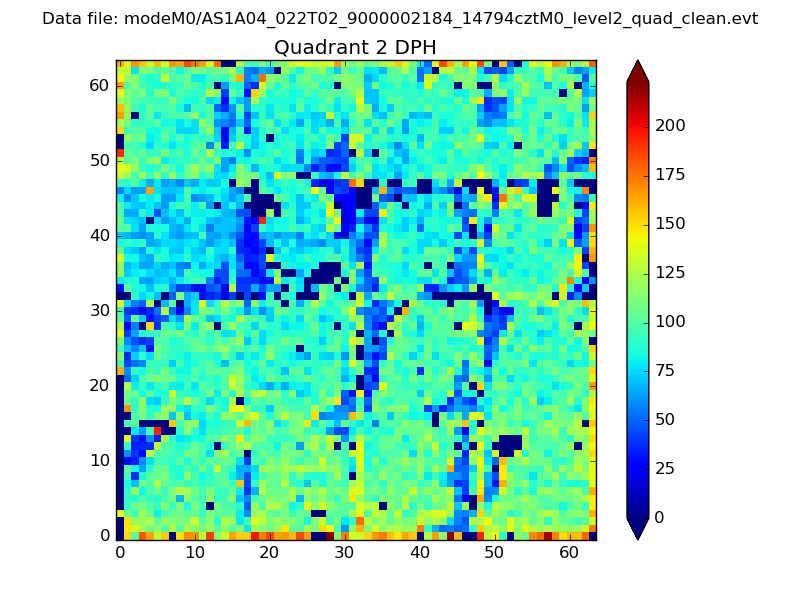
Histogram calculated using DETX and DETY for each event in the final _common_clean file
| Quadrant A |  |
 |
Quadrant B |
|---|---|---|---|
| Quadrant D | 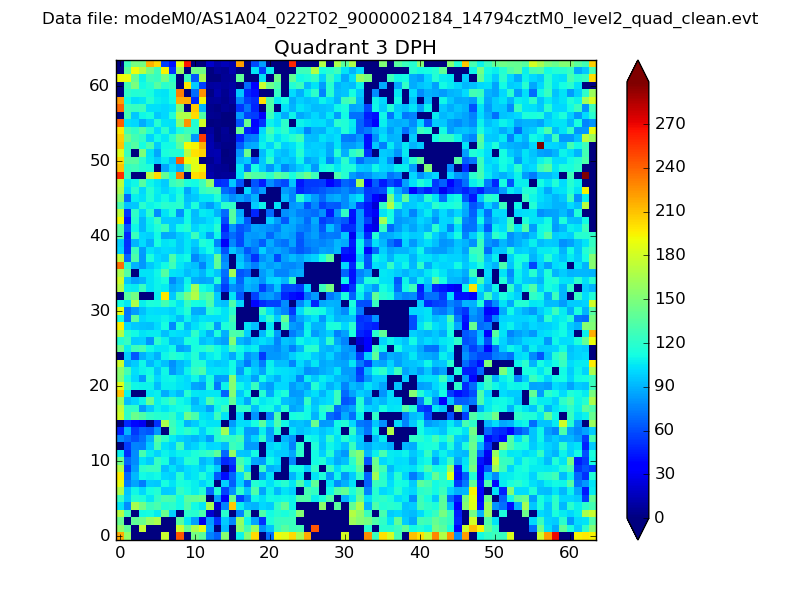 |
 |
Quadrant C |
| Plot type | Count rate plots | Images |
|---|---|---|
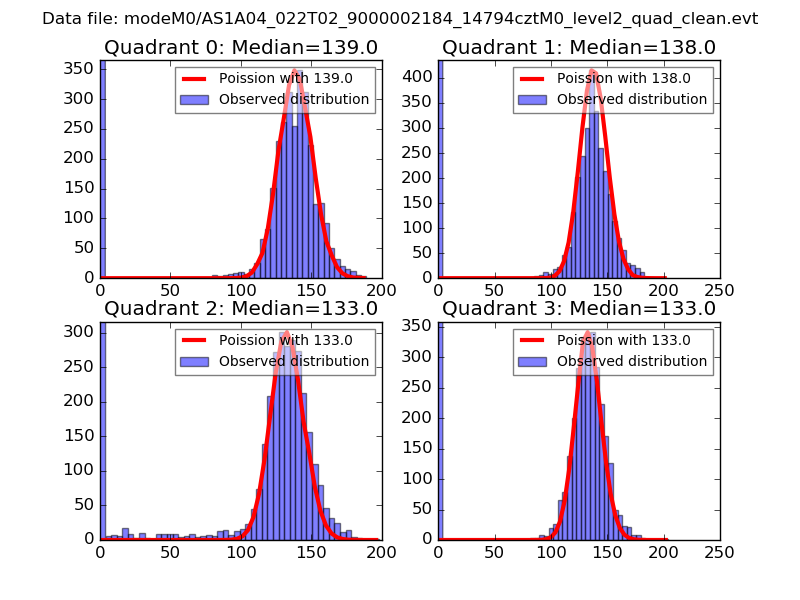
| Comparison with Poisson distribution Blue bars denote a histogram of data divided into 1 sec bins. Red curve is a Poisson curve with rate = median count rate of data. |
 |
 |
| Quadrant-wise count rates Data is divided into 100 sec bins |
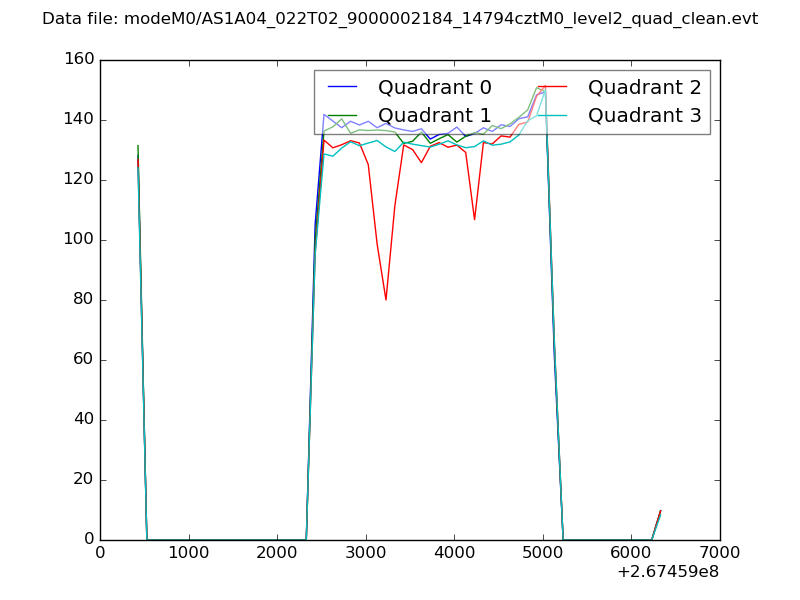 |
|
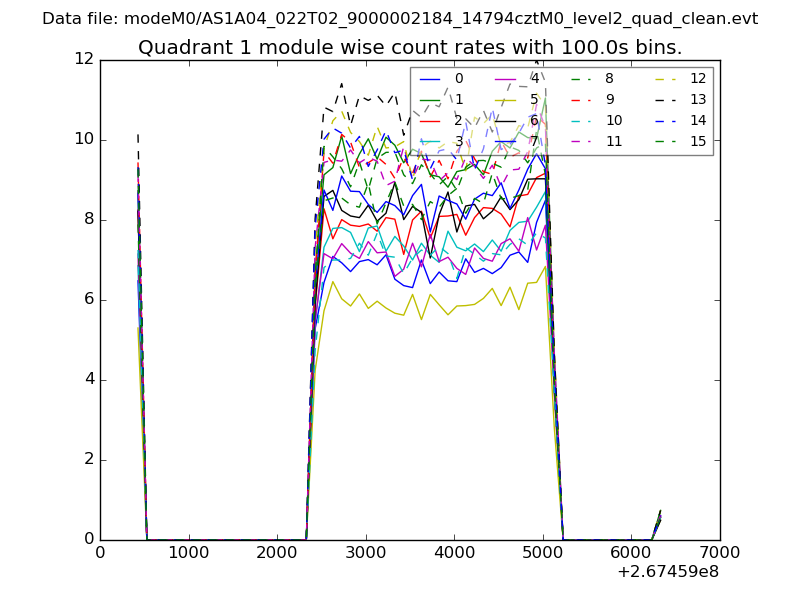
| Module-wise count rates for Quadrant A Data is divided into 100 sec bins |
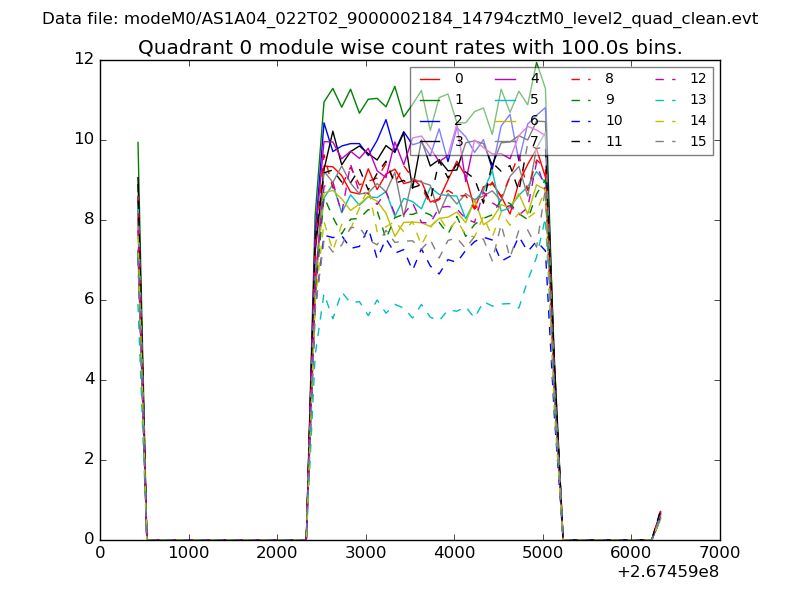 |
 |
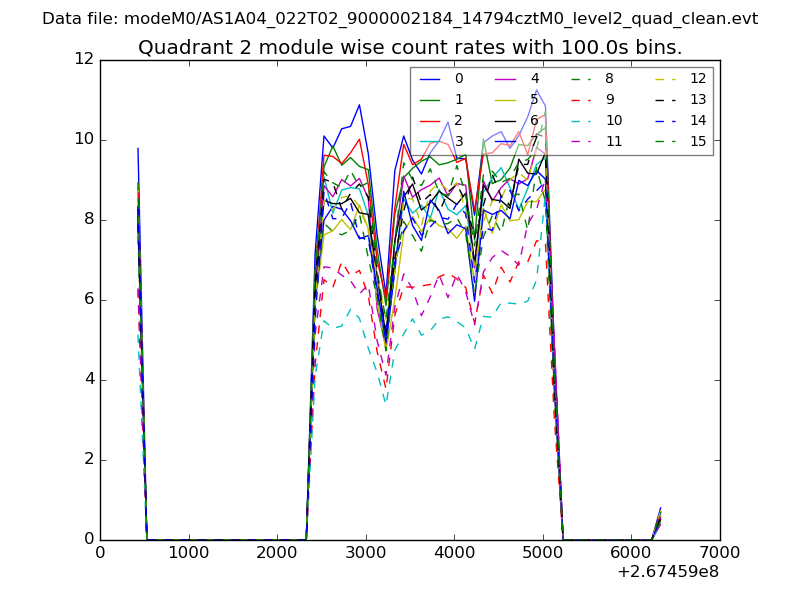
| Module-wise count rates for Quadrant B Data is divided into 100 sec bins |
 |
 |
| Module-wise count rates for Quadrant C Data is divided into 100 sec bins |
 |
 |
| Module-wise count rates for Quadrant D Data is divided into 100 sec bins |
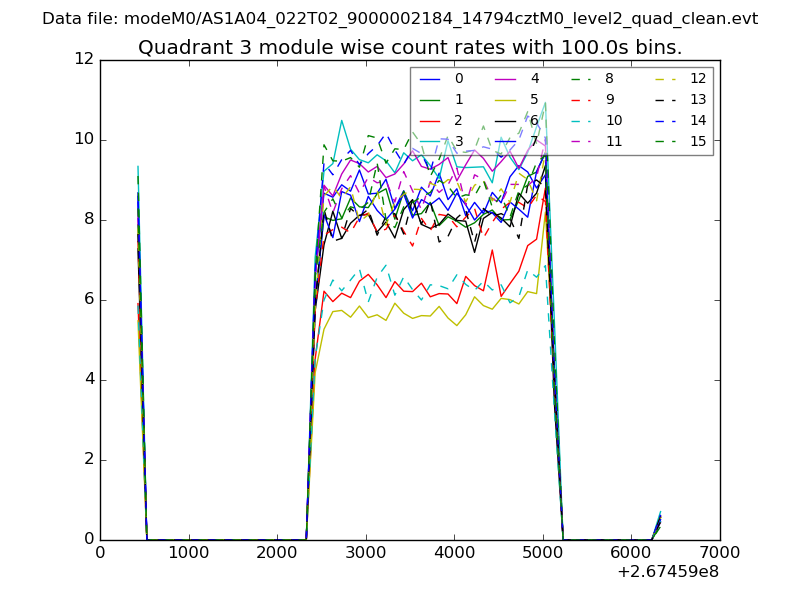 |
 |
| Parameter | Plot |
|---|---|
| CZT HV Monitor |  |
| D_VDD | 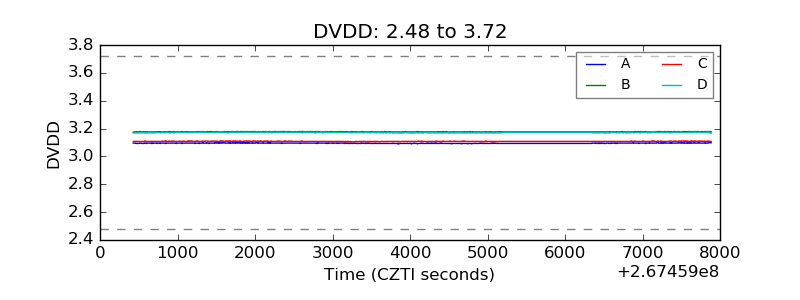 |
| Temperature 1 | 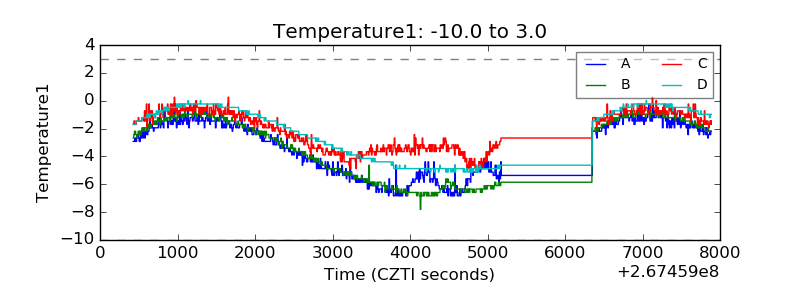 |
| Veto HV Monitor | 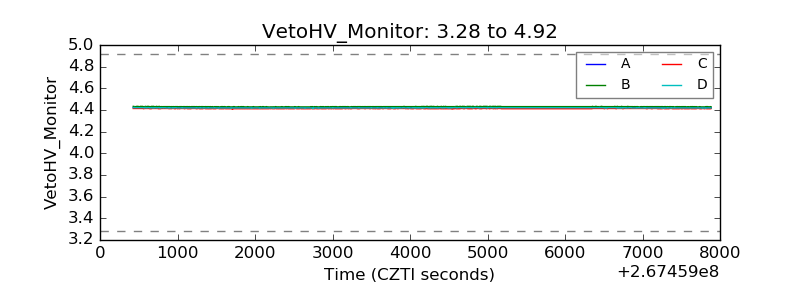 |
| Veto LLD | 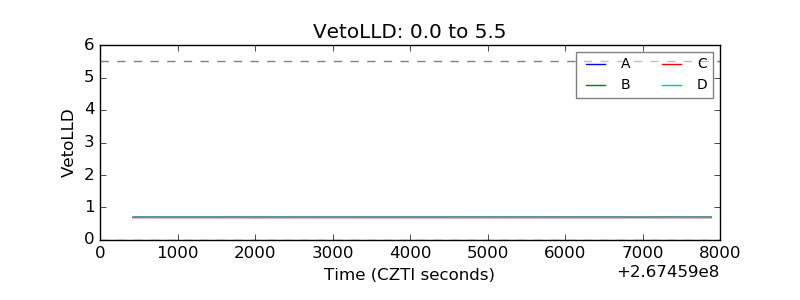 |
| Alpha Counter | 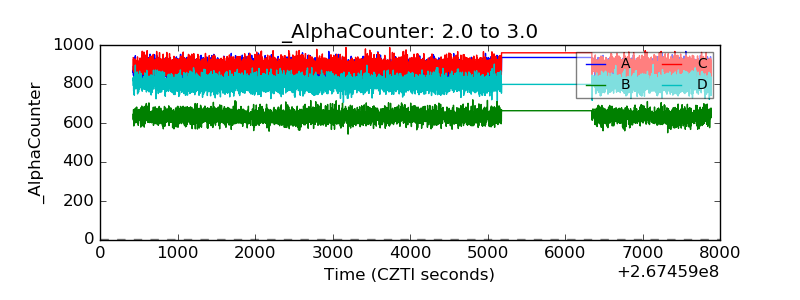 |
| _CPM_Rate | 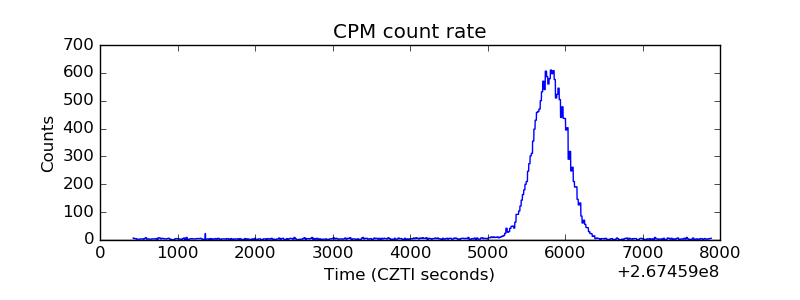 |
| CZT Counter | 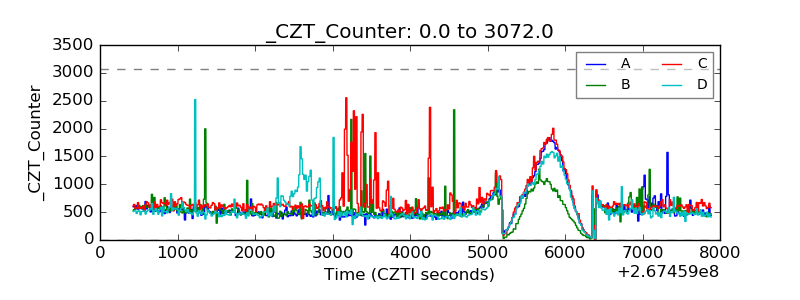 |
| +2.5 Volts monitor |  |
| +5 Volts monitor |  |
| _ROLL_ROT | 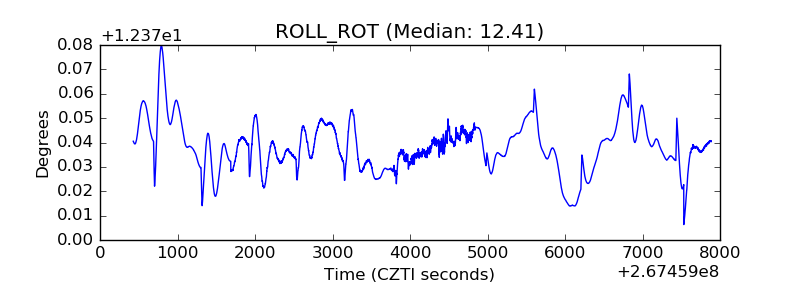 |
| _Roll_DEC | 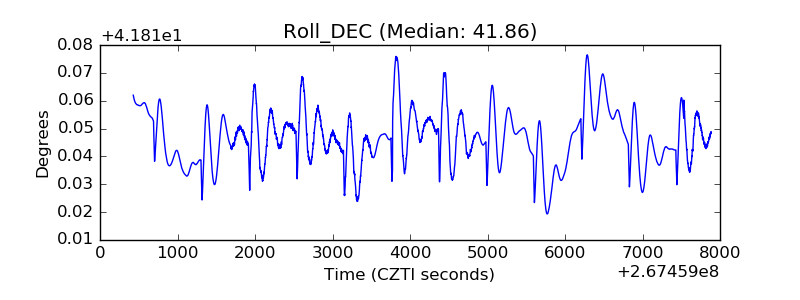 |
| _Roll_RA | 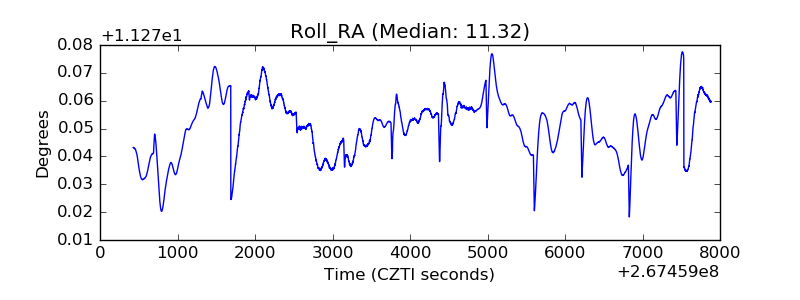 |
| Veto Counter | 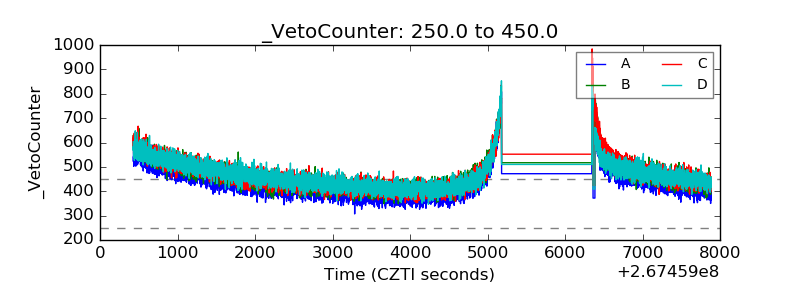 |