| Param | Original file | Final file |
|---|---|---|
| Filename | modeM0/AS1A04_022T02_9000002184_14795cztM0_level2.evt | modeM0/AS1A04_022T02_9000002184_14795cztM0_level2_quad_clean.evt |
| Size (bytes) | 520,346,880 | 73,500,480 |
| Size | 496.2 MB | 70.1 MB |
| Events in quadrant A | 3,520,763 | 447,170 |
| Events in quadrant B | 3,879,867 | 437,603 |
| Events in quadrant C | 4,562,732 | 435,565 |
| Events in quadrant D | 3,335,729 | 433,025 |
| Mode M0 | |||
|---|---|---|---|
| Quadrant | BADHDUFLAG | Total packets | Discarded packets |
| A | 0 | 14775 | 3 |
| B | 0 | 15679 | 2 |
| C | 0 | 18261 | 2 |
| D | 0 | 14389 | 2 |
| Mode M9 | |||
|---|---|---|---|
| Quadrant | BADHDUFLAG | Total packets | Discarded packets |
| A | 0 | 13 | 0 |
| B | 0 | 13 | 0 |
| C | 0 | 13 | 0 |
| D | 0 | 14 | 0 |
| Mode SS | |||
|---|---|---|---|
| Quadrant | BADHDUFLAG | Total packets | Discarded packets |
| A | 0 | 140 | 0 |
| B | 0 | 140 | 0 |
| C | 0 | 140 | 0 |
| D | 0 | 140 | 0 |
| Quadrant | Total seconds | Saturated seconds | Saturation percentage |
|---|---|---|---|
| A | 6765 | 134 | 1.980783% |
| B | 6765 | 242 | 3.577236% |
| C | 6765 | 231 | 3.414634% |
| D | 6765 | 117 | 1.729490% |
Noise dominated data is calculated using 1-second bins in cleaned event files. If a bin has >2000 counts, and if more than 50% of those come from <1% of pixels, then it is considered to be noise-dominated and hence unusable.
| Quadrant | # 1 sec bins | Bins with >0 counts | Bins with >2000 counts | High rate bins dominated by noise | Noise dominated (total time) | Noise dominated (detector-on time) | Marked lightcurve |
|---|---|---|---|---|---|---|---|
| A | 7666 | 6768 | 1 | 1 | 0.01% | 0.01% | 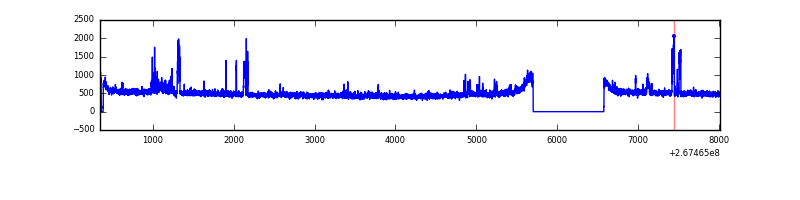 |
| B | 7666 | 6768 | 104 | 104 | 1.36% | 1.54% | 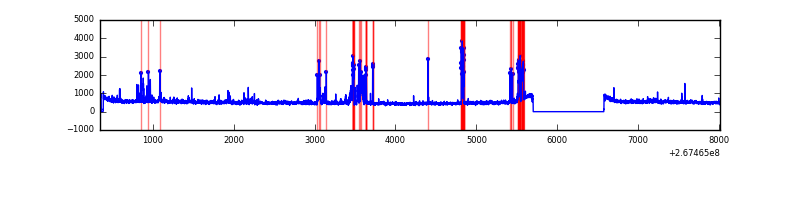 |
| C | 7666 | 6768 | 77 | 77 | 1.00% | 1.14% | 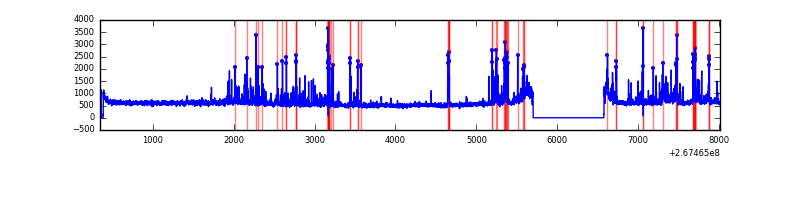 |
| D | 7666 | 6768 | 10 | 10 | 0.13% | 0.15% | 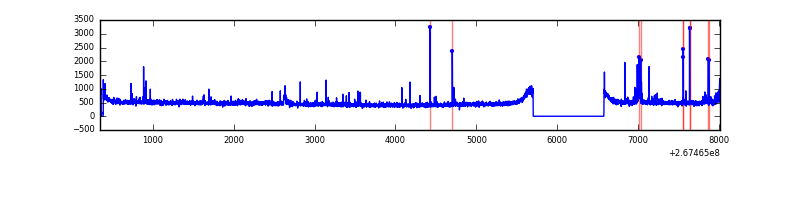 |
Top three noisy pixels from each quadrant. If the there are fewer than three noisy pixels in the level2.evt file, extra rows are filled as -1
| Pixel properties | Quadrant properties | ||||||
|---|---|---|---|---|---|---|---|
| Quadrant | DetID | PixID | Counts | Sigma | Mean | Median | Sigma |
| A | 0 | 23 | 109373 | 627.57 | 852 | 833 | 173.0 |
| A | 11 | 29 | 83063 | 475.45 | 852 | 833 | 173.0 |
| A | 12 | 189 | 43606 | 247.31 | 852 | 833 | 173.0 |
| B | 3 | 64 | 245214 | 1543.71 | 837 | 818 | 158.3 |
| B | 10 | 16 | 150224 | 943.71 | 837 | 818 | 158.3 |
| B | 3 | 209 | 51125 | 317.76 | 837 | 818 | 158.3 |
| C | 3 | 233 | 744468 | 3949.74 | 813 | 817 | 188.3 |
| C | 4 | 254 | 643774 | 3414.93 | 813 | 817 | 188.3 |
| C | 13 | 61 | 5963 | 27.33 | 813 | 817 | 188.3 |
| D | 15 | 0 | 79191 | 372.42 | 826 | 804 | 210.5 |
| D | 10 | 70 | 67140 | 315.16 | 826 | 804 | 210.5 |
| D | 2 | 234 | 26404 | 121.63 | 826 | 804 | 210.5 |
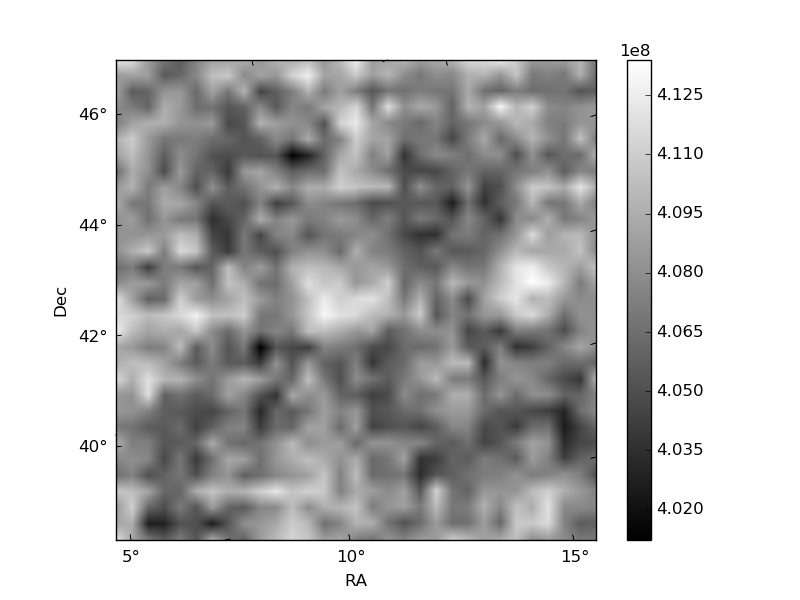
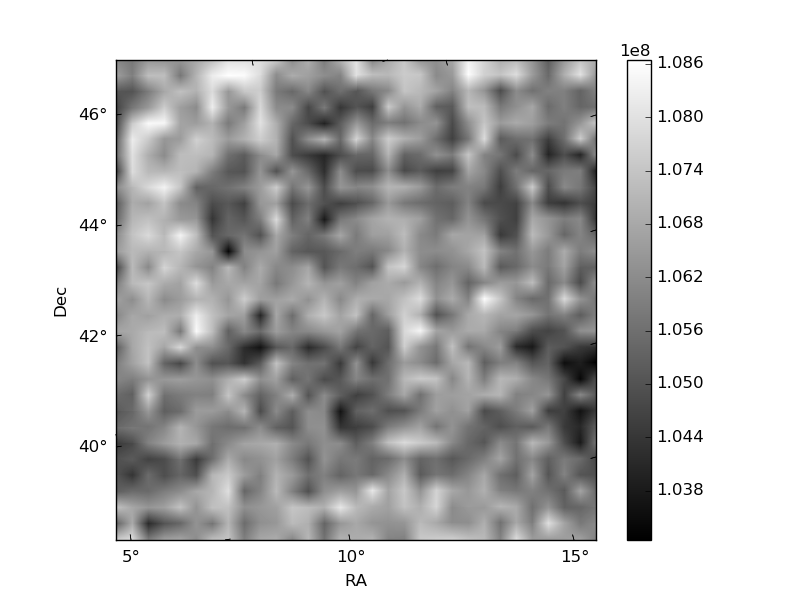
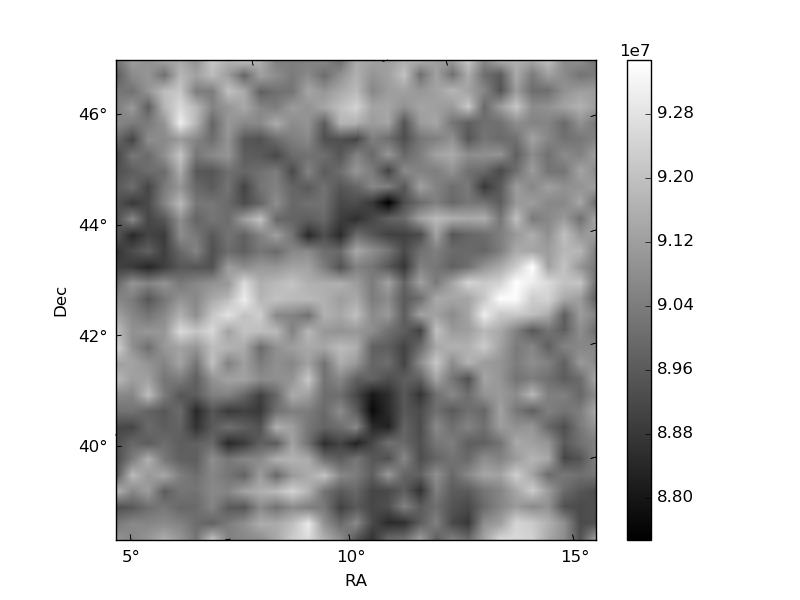
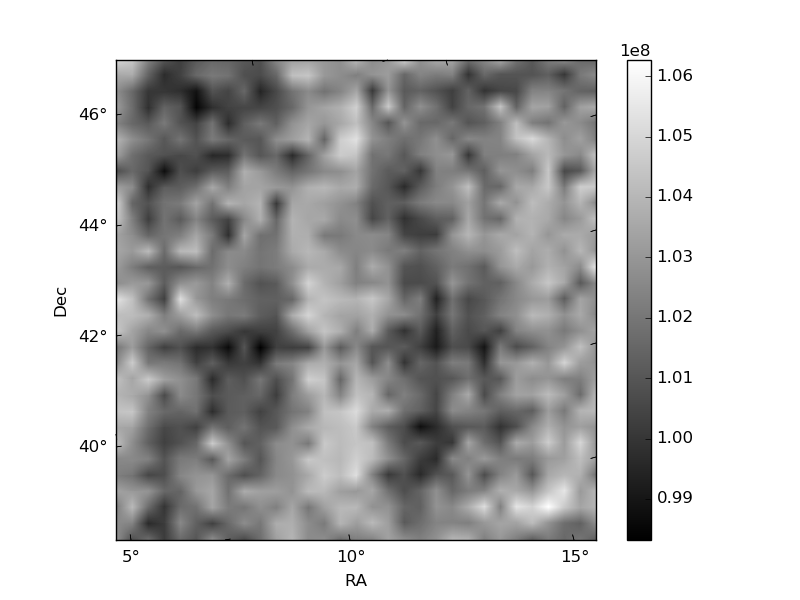
Histogram calculated using DETX and DETY for each event in the final _common_clean file
| Quadrant A | 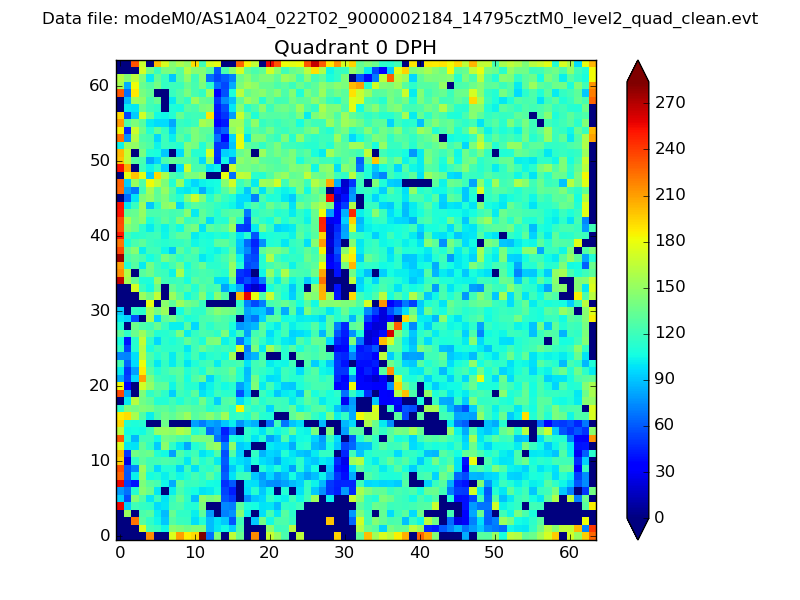 |
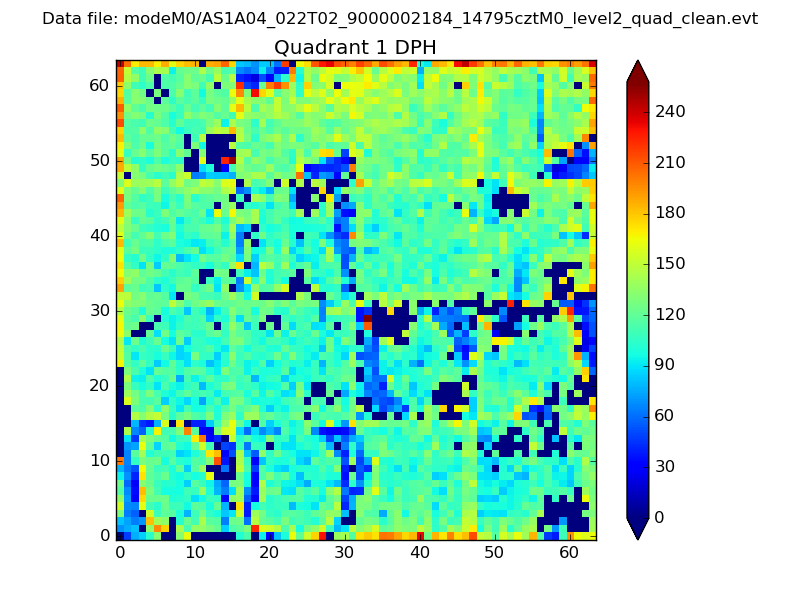 |
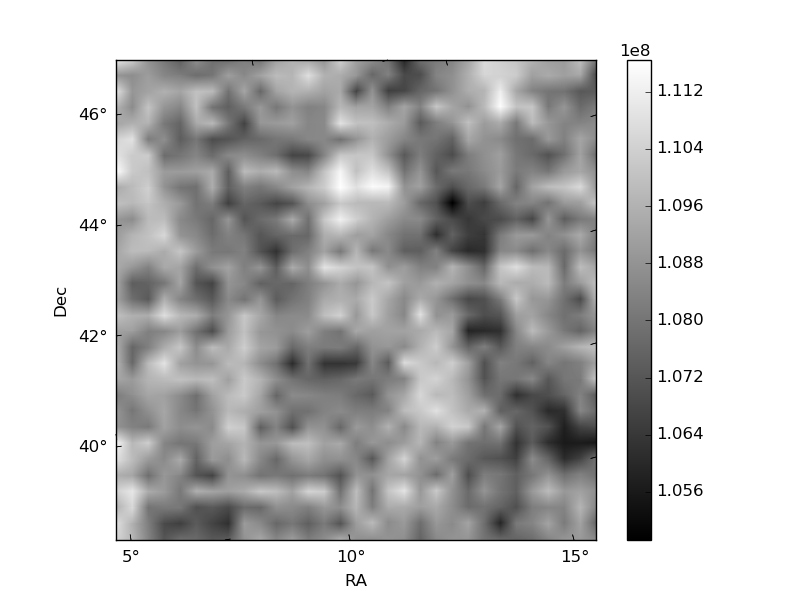
Quadrant B |
|---|---|---|---|
| Quadrant D | 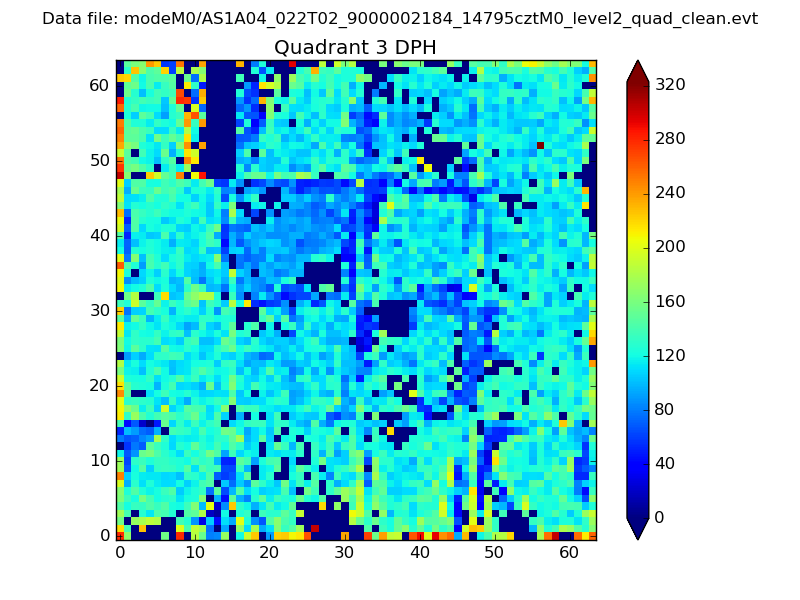 |
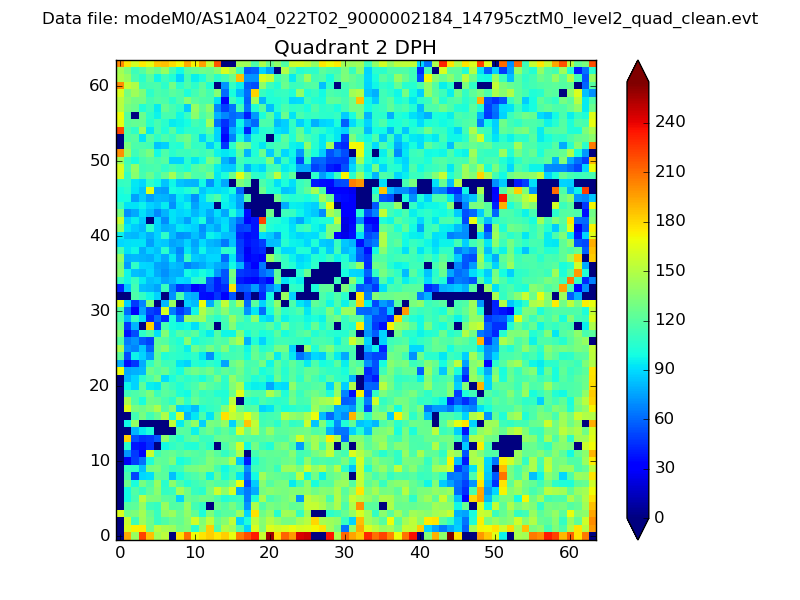 |
Quadrant C |
| Plot type | Count rate plots | Images |
|---|---|---|
| Comparison with Poisson distribution Blue bars denote a histogram of data divided into 1 sec bins. Red curve is a Poisson curve with rate = median count rate of data. |
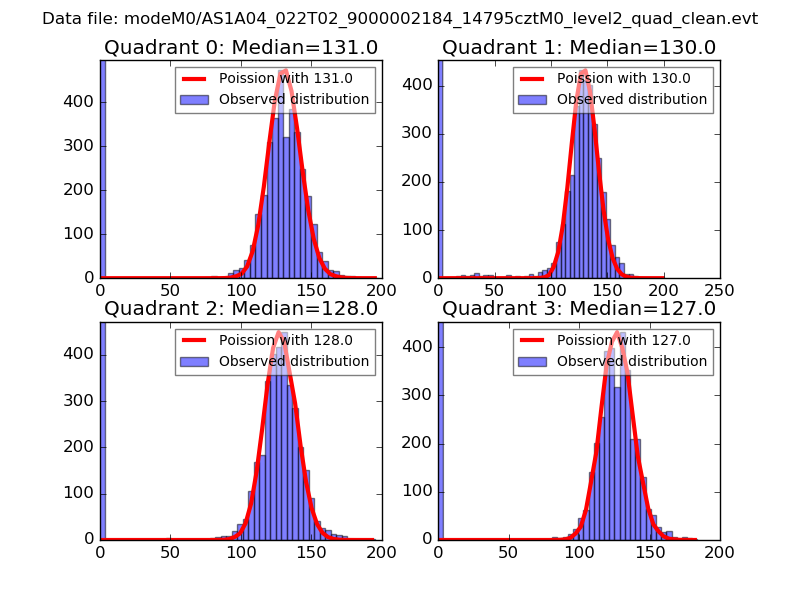 |
 |
| Quadrant-wise count rates Data is divided into 100 sec bins |
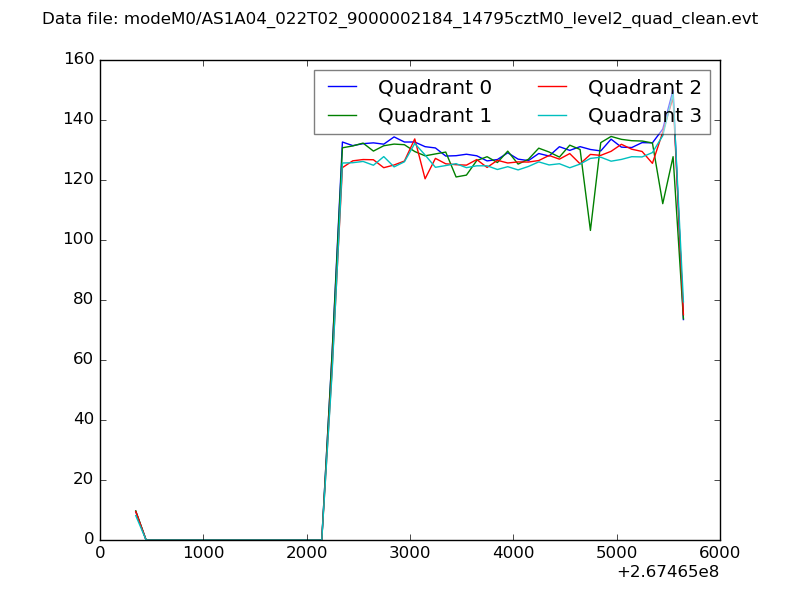 |
|
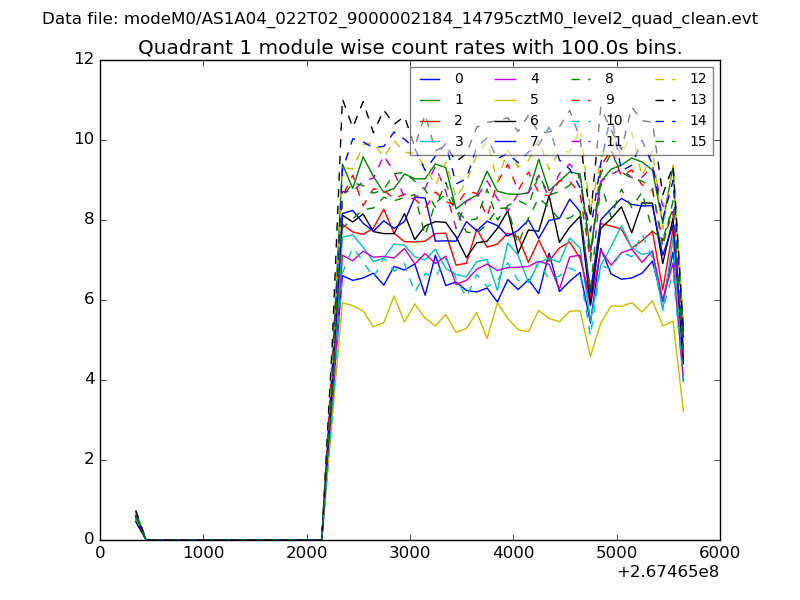
| Module-wise count rates for Quadrant A Data is divided into 100 sec bins |
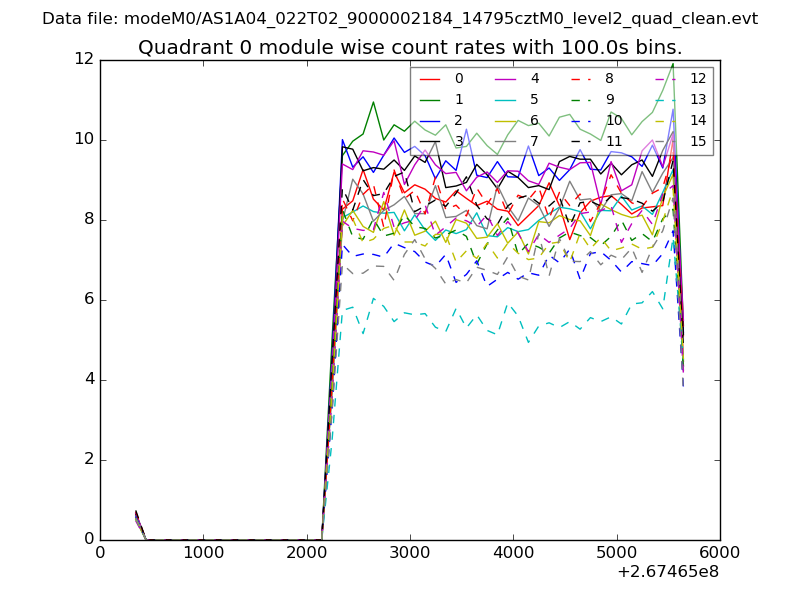 |
 |
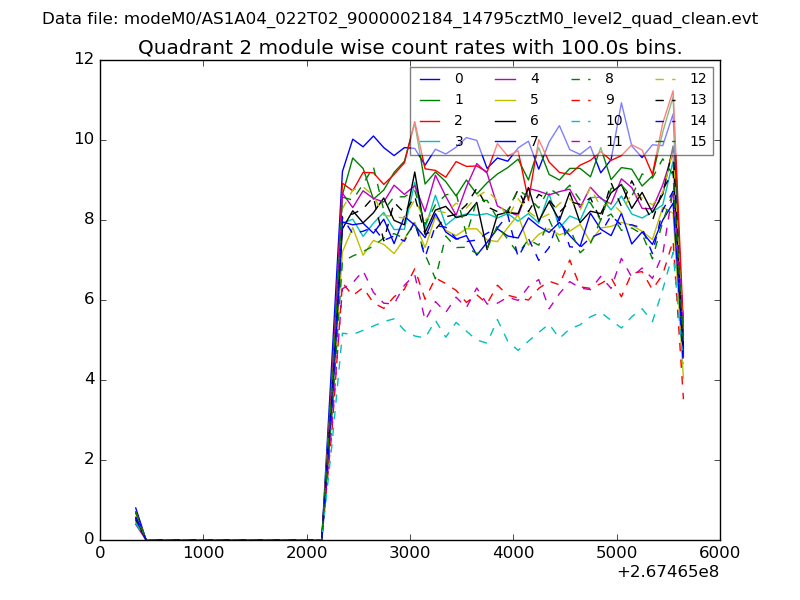
| Module-wise count rates for Quadrant B Data is divided into 100 sec bins |
 |
 |
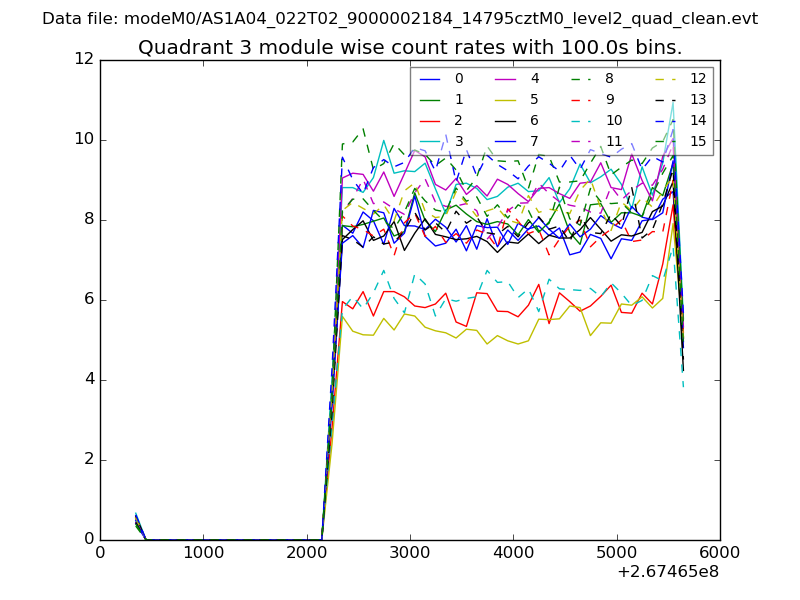
| Module-wise count rates for Quadrant C Data is divided into 100 sec bins |
 |
 |
| Module-wise count rates for Quadrant D Data is divided into 100 sec bins |
 |
 |
| Parameter | Plot |
|---|---|
| CZT HV Monitor | 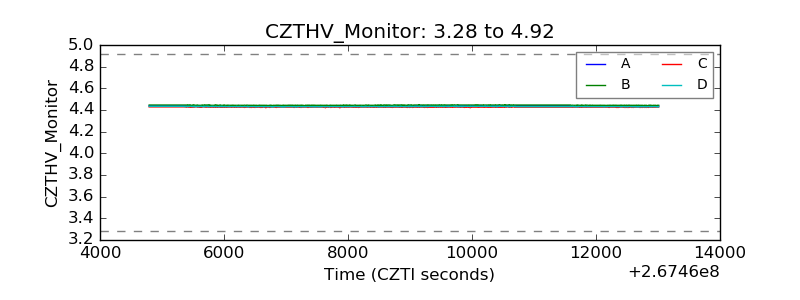 |
| D_VDD | 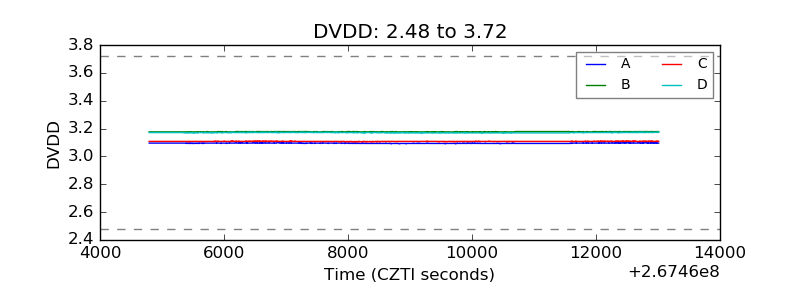 |
| Temperature 1 | 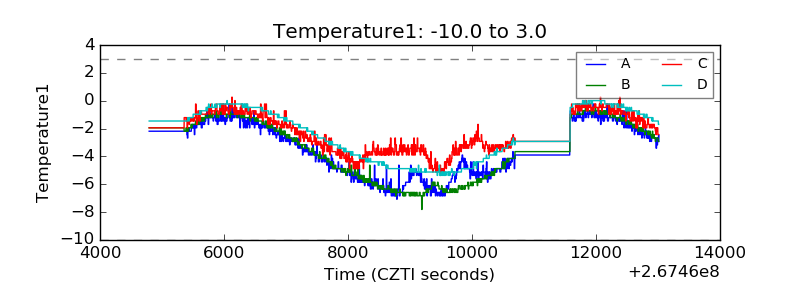 |
| Veto HV Monitor | 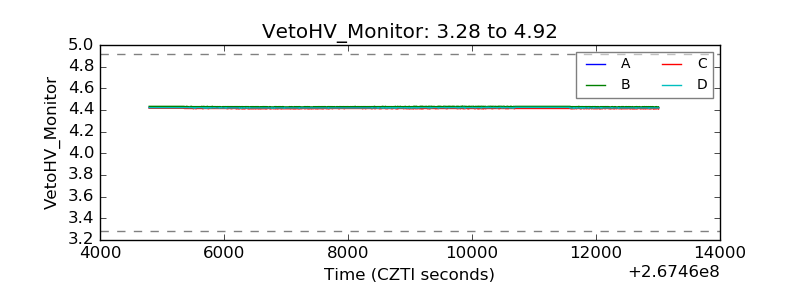 |
| Veto LLD | 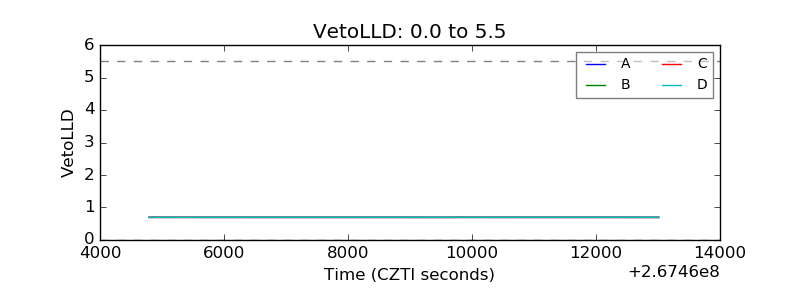 |
| Alpha Counter | 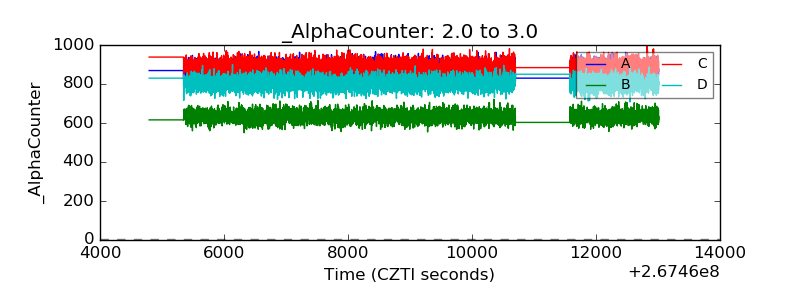 |
| _CPM_Rate | 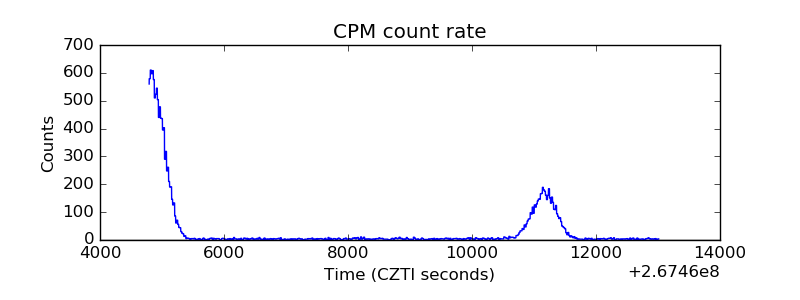 |
| CZT Counter | 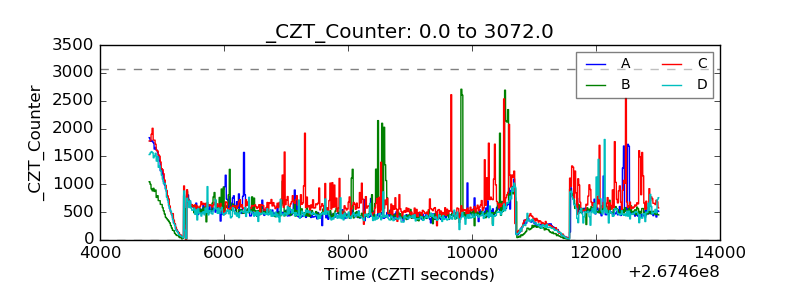 |
| +2.5 Volts monitor |  |
| +5 Volts monitor | 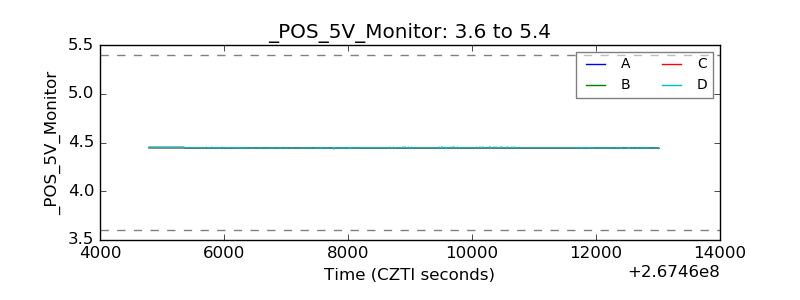 |
| _ROLL_ROT | 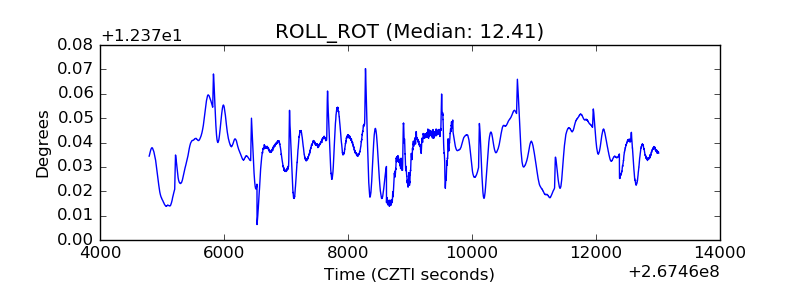 |
| _Roll_DEC |  |
| _Roll_RA | 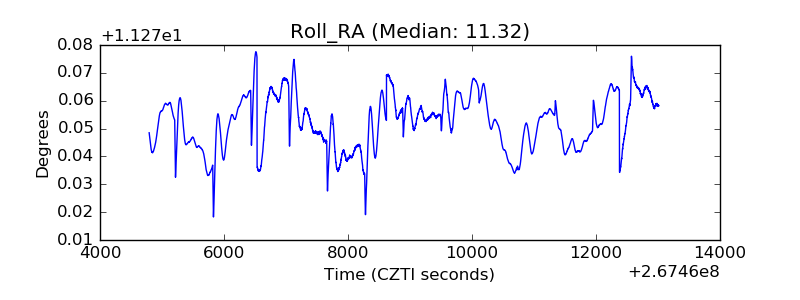 |
| Veto Counter | 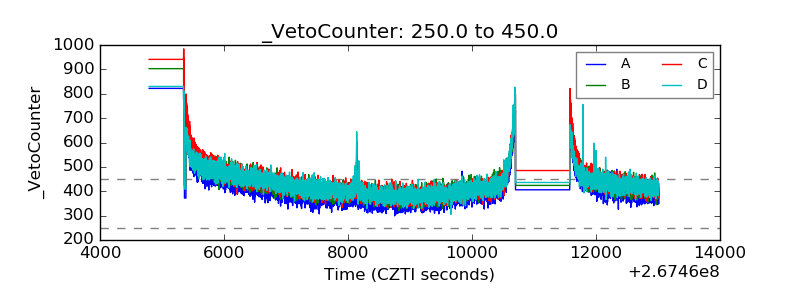 |