| Param | Original file | Final file |
|---|---|---|
| Filename | modeM0/AS1A04_022T02_9000002184_14796cztM0_level2.evt | modeM0/AS1A04_022T02_9000002184_14796cztM0_level2_quad_clean.evt |
| Size (bytes) | 555,661,440 | 82,630,080 |
| Size | 529.9 MB | 78.8 MB |
| Events in quadrant A | 3,474,690 | 513,166 |
| Events in quadrant B | 3,608,030 | 511,049 |
| Events in quadrant C | 5,521,008 | 489,450 |
| Events in quadrant D | 3,741,936 | 492,645 |
| Mode M0 | |||
|---|---|---|---|
| Quadrant | BADHDUFLAG | Total packets | Discarded packets |
| A | 0 | 14953 | 3 |
| B | 0 | 15231 | 2 |
| C | 0 | 21489 | 2 |
| D | 0 | 16143 | 2 |
| Mode M9 | |||
|---|---|---|---|
| Quadrant | BADHDUFLAG | Total packets | Discarded packets |
| A | 0 | 10 | 0 |
| B | 0 | 10 | 0 |
| C | 0 | 10 | 0 |
| D | 0 | 11 | 0 |
| Mode SS | |||
|---|---|---|---|
| Quadrant | BADHDUFLAG | Total packets | Discarded packets |
| A | 0 | 144 | 0 |
| B | 0 | 144 | 0 |
| C | 0 | 144 | 0 |
| D | 0 | 144 | 0 |
| Quadrant | Total seconds | Saturated seconds | Saturation percentage |
|---|---|---|---|
| A | 7120 | 91 | 1.278090% |
| B | 7120 | 107 | 1.502809% |
| C | 7120 | 329 | 4.620787% |
| D | 7120 | 77 | 1.081461% |
Noise dominated data is calculated using 1-second bins in cleaned event files. If a bin has >2000 counts, and if more than 50% of those come from <1% of pixels, then it is considered to be noise-dominated and hence unusable.
| Quadrant | # 1 sec bins | Bins with >0 counts | Bins with >2000 counts | High rate bins dominated by noise | Noise dominated (total time) | Noise dominated (detector-on time) | Marked lightcurve |
|---|---|---|---|---|---|---|---|
| A | 7606 | 7122 | 1 | 1 | 0.01% | 0.01% | 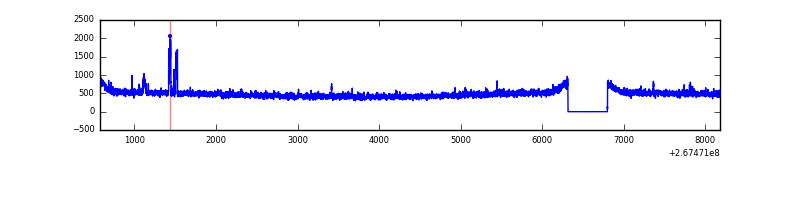 |
| B | 7606 | 7122 | 9 | 9 | 0.12% | 0.13% | 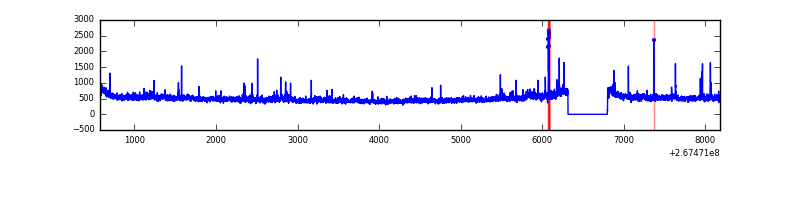 |
| C | 7606 | 7122 | 176 | 176 | 2.31% | 2.47% | 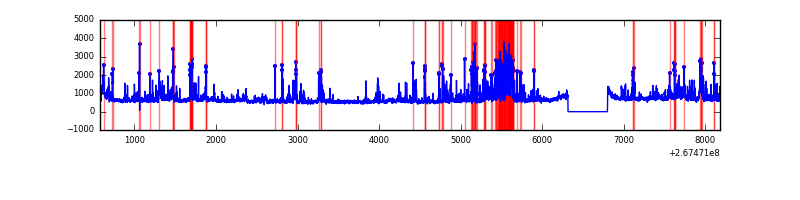 |
| D | 7606 | 7122 | 12 | 12 | 0.16% | 0.17% | 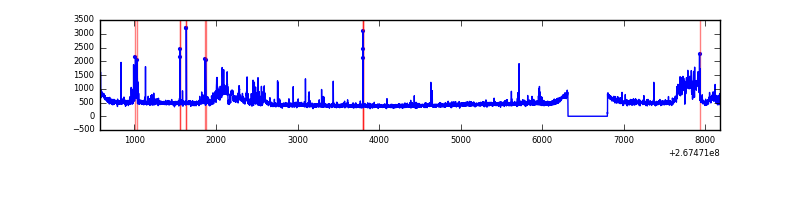 |
Top three noisy pixels from each quadrant. If the there are fewer than three noisy pixels in the level2.evt file, extra rows are filled as -1
| Pixel properties | Quadrant properties | ||||||
|---|---|---|---|---|---|---|---|
| Quadrant | DetID | PixID | Counts | Sigma | Mean | Median | Sigma |
| A | 11 | 29 | 66791 | 374.3 | 871 | 851 | 176.2 |
| A | 12 | 189 | 58171 | 325.37 | 871 | 851 | 176.2 |
| A | 0 | 226 | 7942 | 40.25 | 871 | 851 | 176.2 |
| B | 0 | 219 | 34524 | 205.38 | 865 | 843 | 164.0 |
| B | 3 | 209 | 34424 | 204.77 | 865 | 843 | 164.0 |
| B | 0 | 229 | 32426 | 192.58 | 865 | 843 | 164.0 |
| C | 4 | 254 | 1213819 | 6356.59 | 824 | 828 | 190.8 |
| C | 3 | 233 | 1061785 | 5559.87 | 824 | 828 | 190.8 |
| C | 3 | 232 | 11470 | 55.77 | 824 | 828 | 190.8 |
| D | 15 | 0 | 409863 | 1970.76 | 844 | 816 | 207.6 |
| D | 10 | 70 | 75748 | 361.02 | 844 | 816 | 207.6 |
| D | 2 | 234 | 29033 | 135.95 | 844 | 816 | 207.6 |
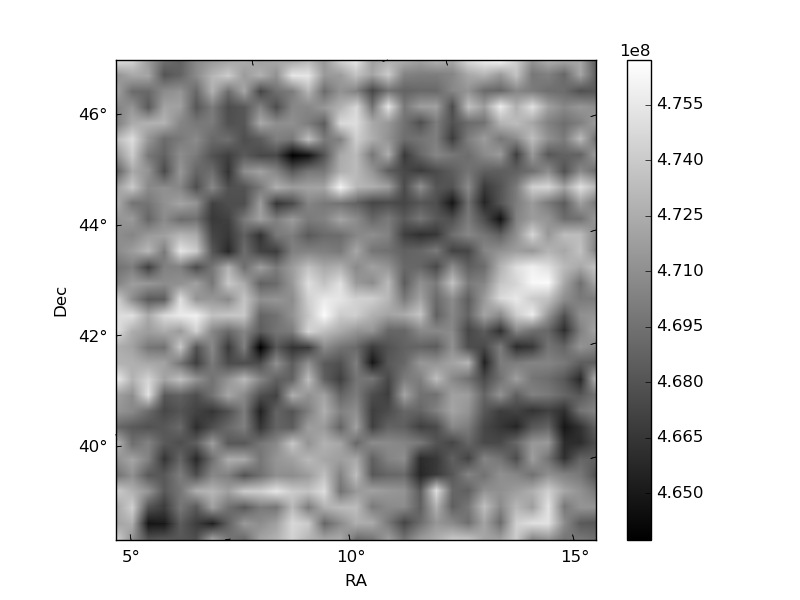
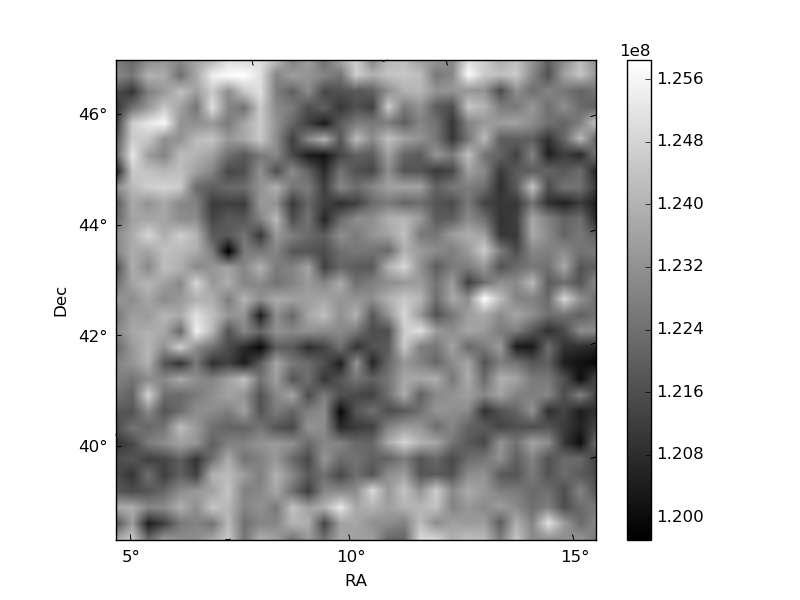
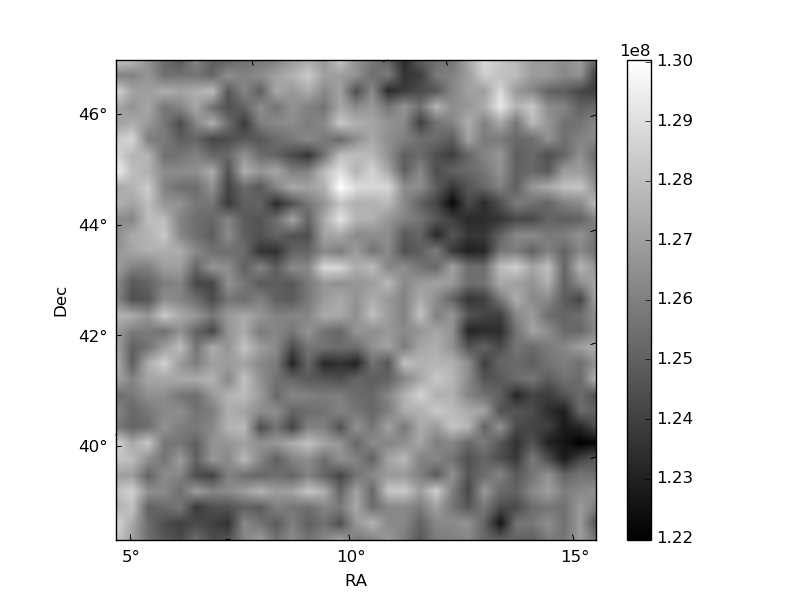
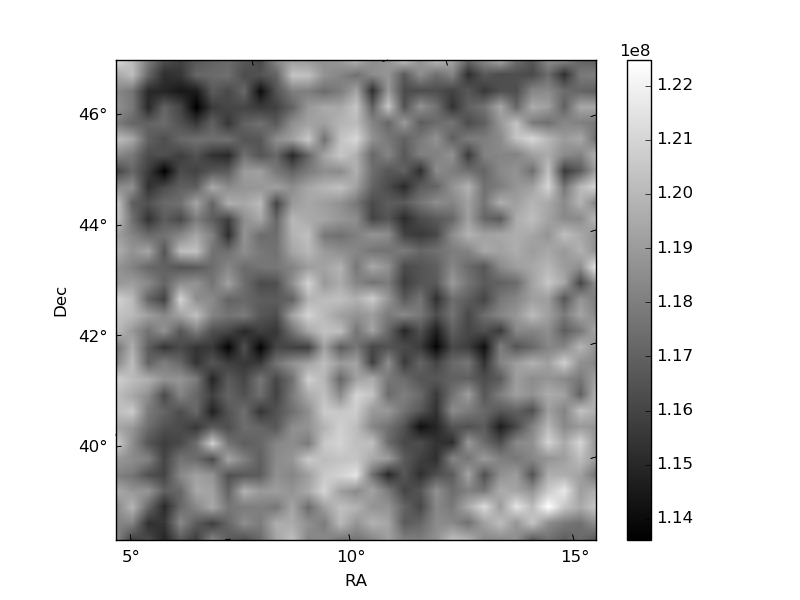
Histogram calculated using DETX and DETY for each event in the final _common_clean file
| Quadrant A | 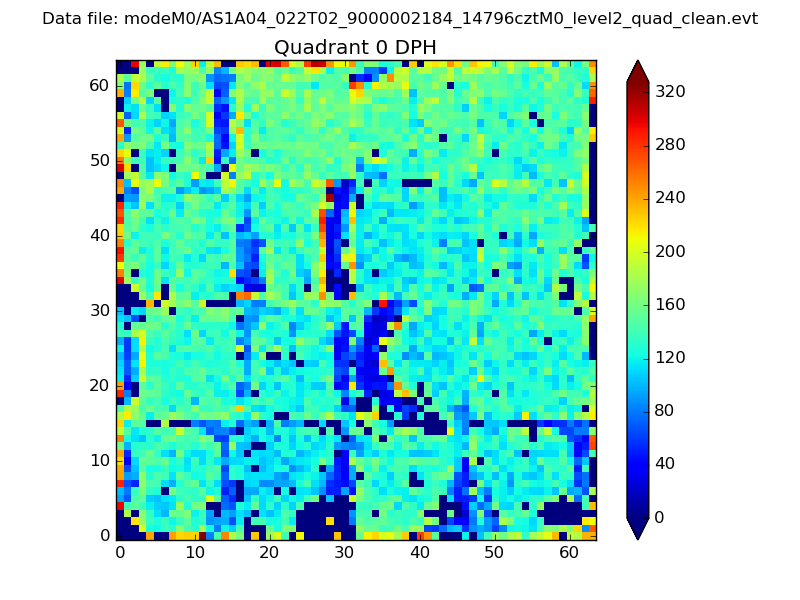 |
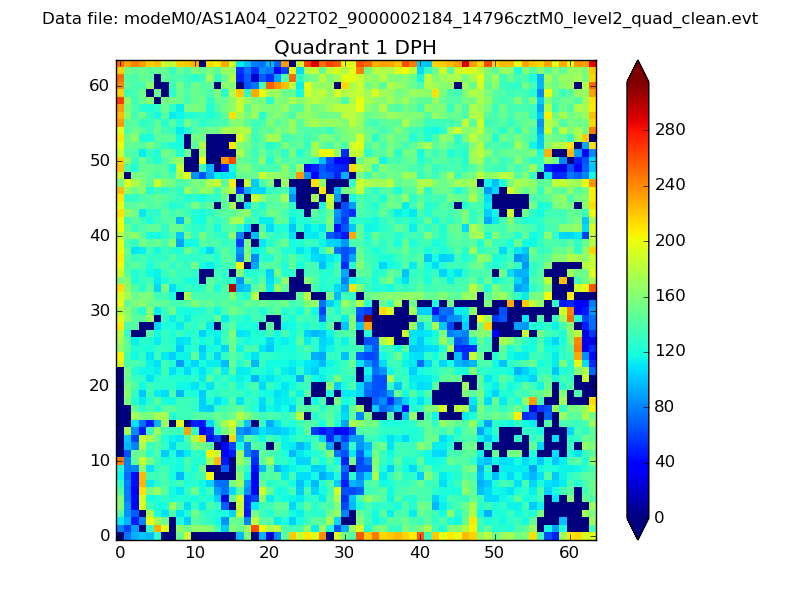 |
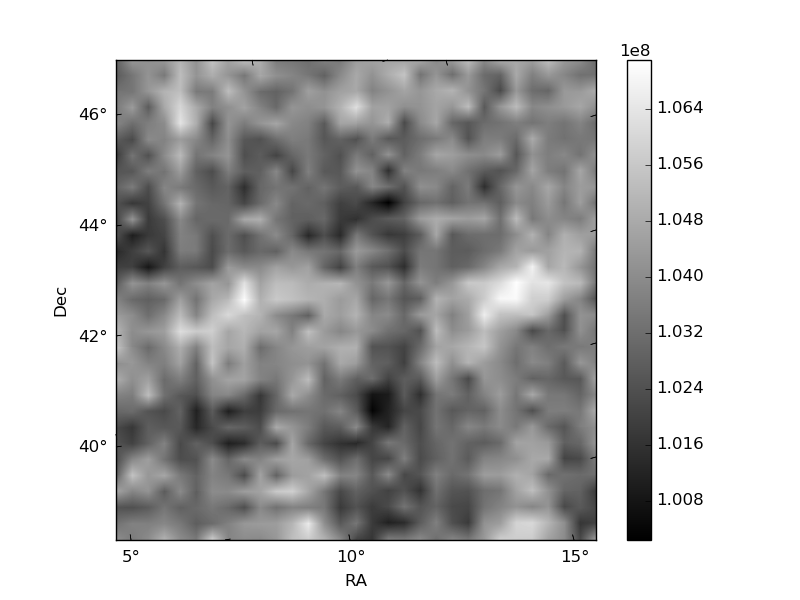
Quadrant B |
|---|---|---|---|
| Quadrant D | 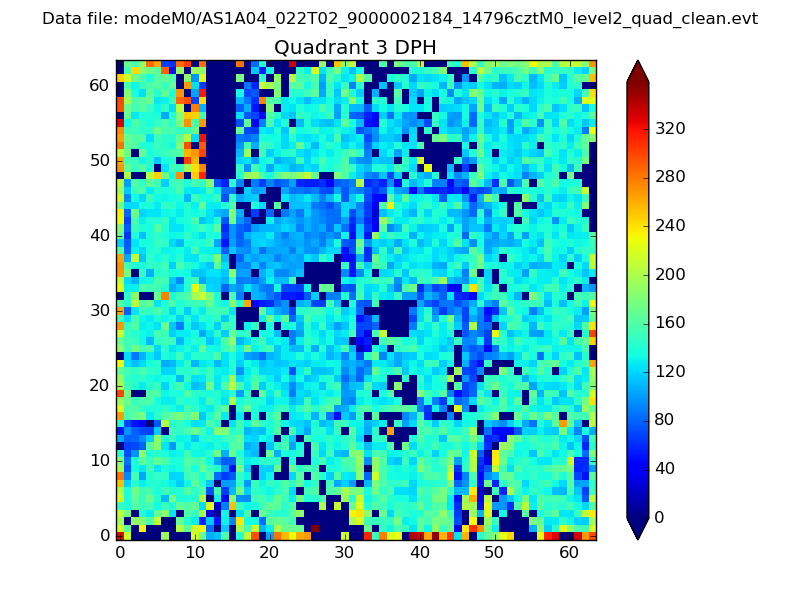 |
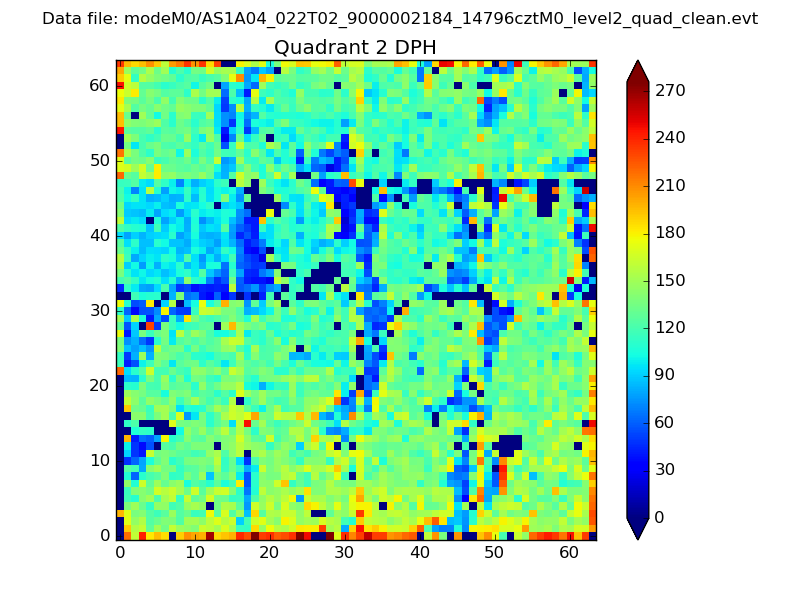 |
Quadrant C |
| Plot type | Count rate plots | Images |
|---|---|---|
| Comparison with Poisson distribution Blue bars denote a histogram of data divided into 1 sec bins. Red curve is a Poisson curve with rate = median count rate of data. |
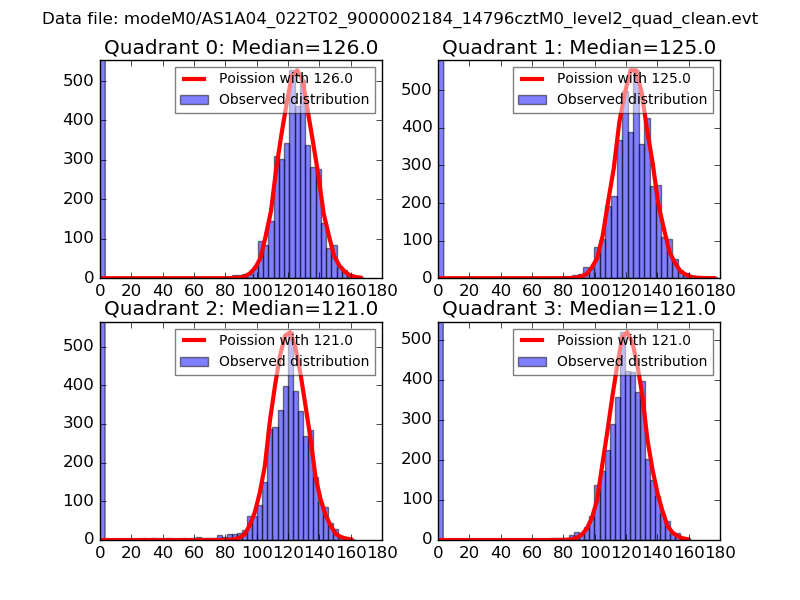 |
 |
| Quadrant-wise count rates Data is divided into 100 sec bins |
 |
|
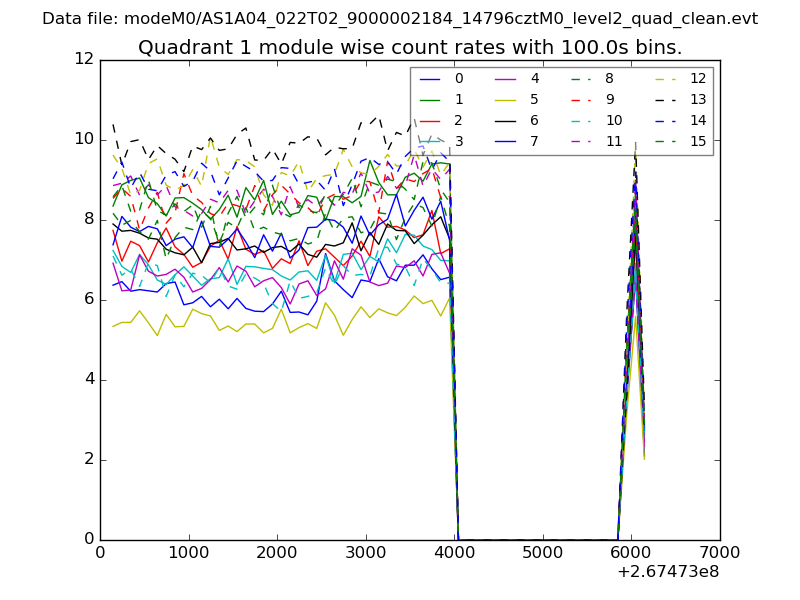
| Module-wise count rates for Quadrant A Data is divided into 100 sec bins |
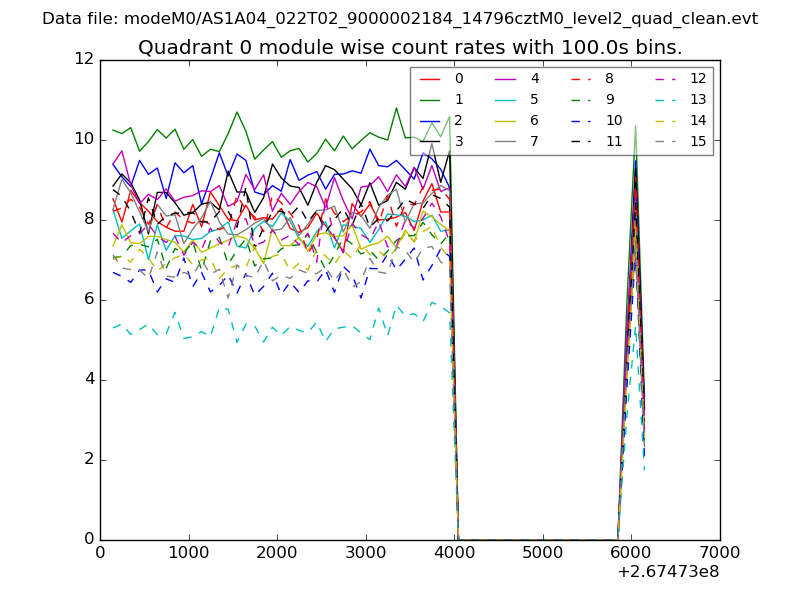 |
 |
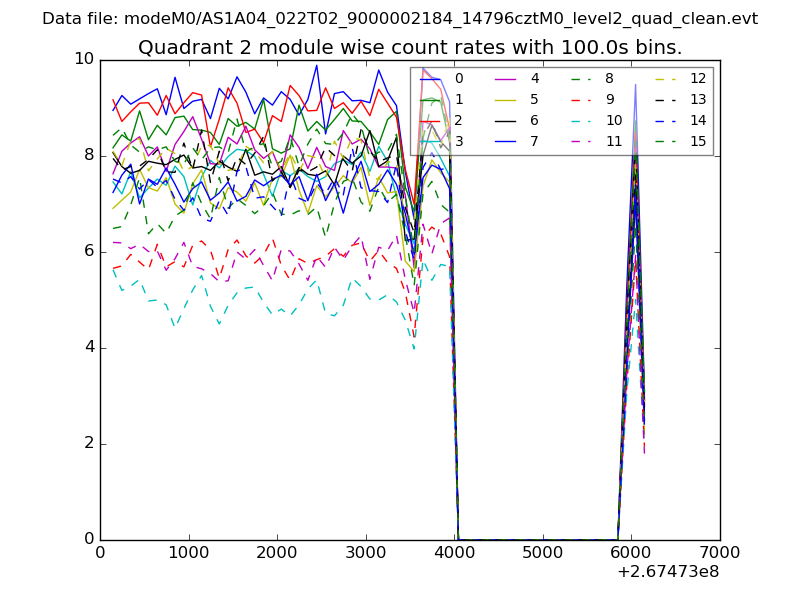
| Module-wise count rates for Quadrant B Data is divided into 100 sec bins |
 |
 |
| Module-wise count rates for Quadrant C Data is divided into 100 sec bins |
 |
 |
| Module-wise count rates for Quadrant D Data is divided into 100 sec bins |
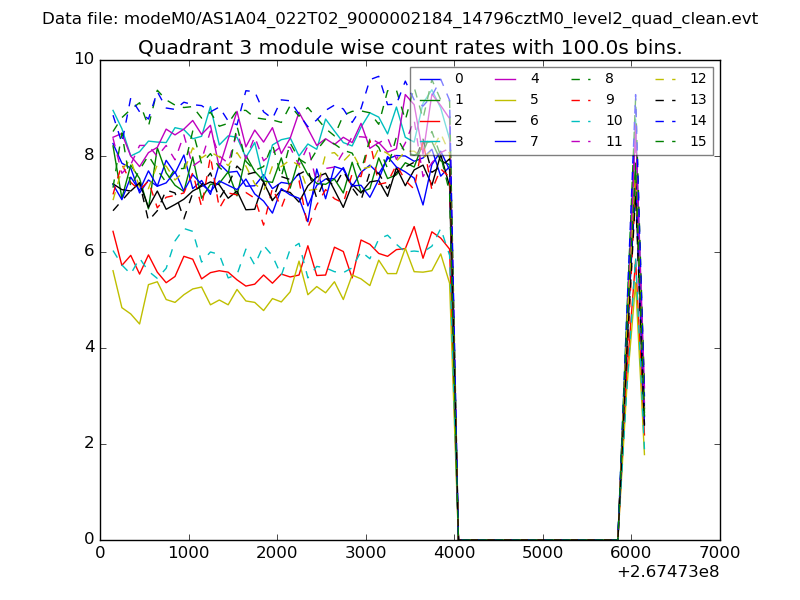 |
 |
| Parameter | Plot |
|---|---|
| CZT HV Monitor | 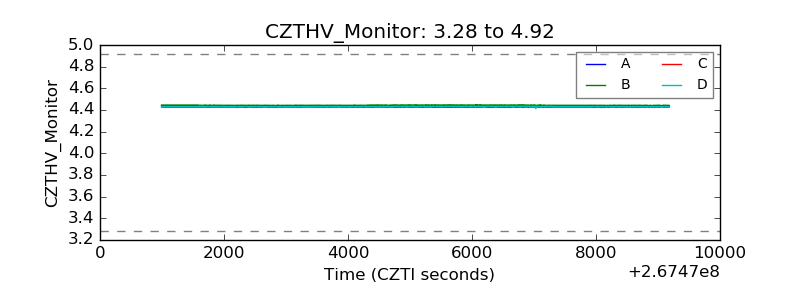 |
| D_VDD | 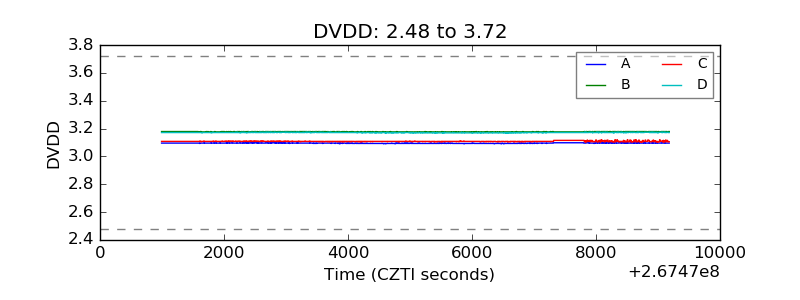 |
| Temperature 1 | 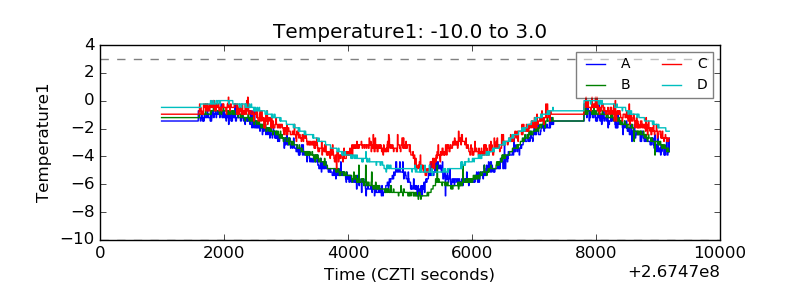 |
| Veto HV Monitor |  |
| Veto LLD | 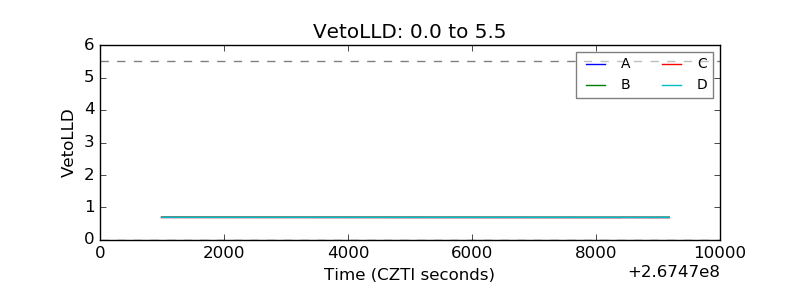 |
| Alpha Counter | 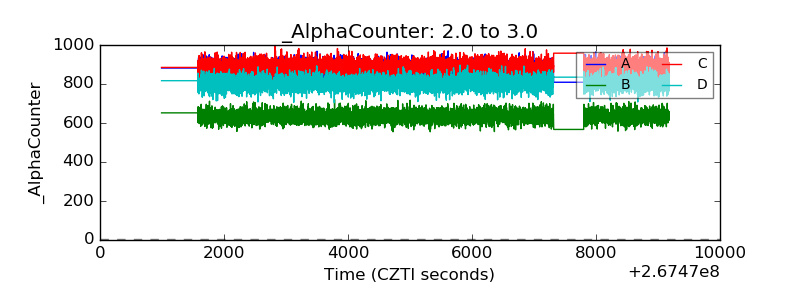 |
| _CPM_Rate | 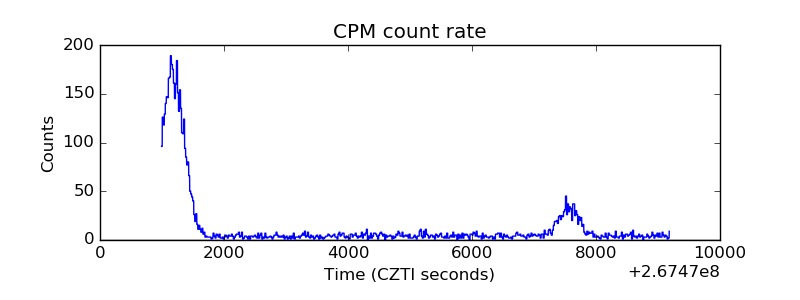 |
| CZT Counter | 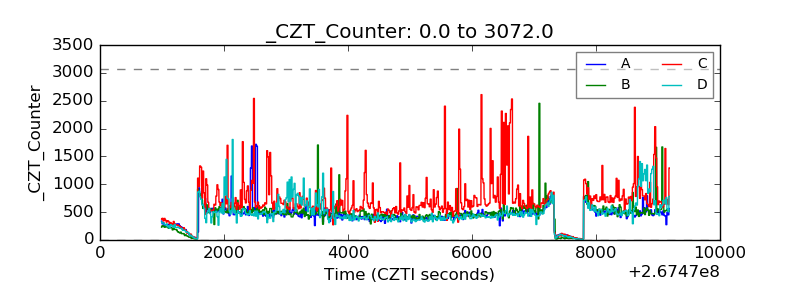 |
| +2.5 Volts monitor |  |
| +5 Volts monitor |  |
| _ROLL_ROT | 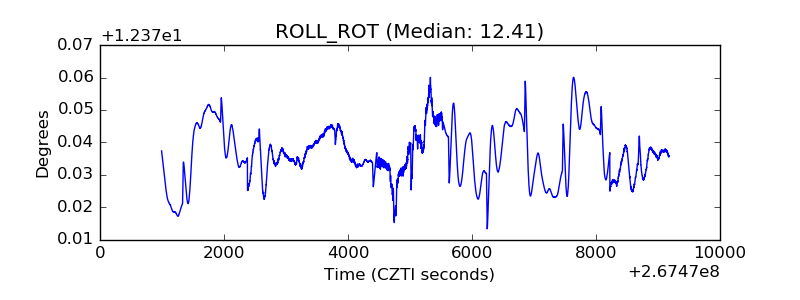 |
| _Roll_DEC | 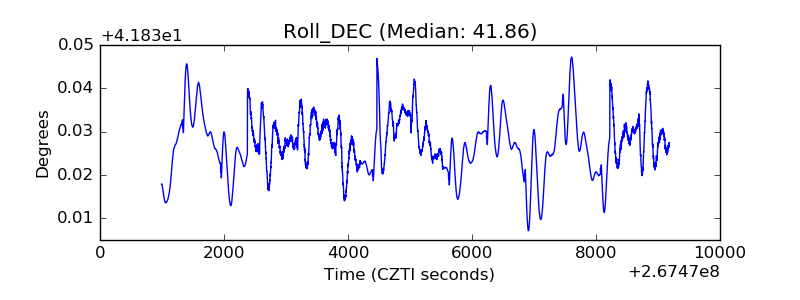 |
| _Roll_RA |  |
| Veto Counter | 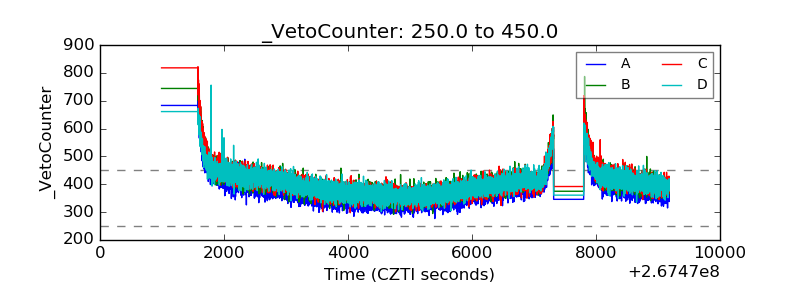 |