| Param | Original file | Final file |
|---|---|---|
| Filename | modeM0/AS1A04_022T02_9000002184_14797cztM0_level2.evt | modeM0/AS1A04_022T02_9000002184_14797cztM0_level2_quad_clean.evt |
| Size (bytes) | 586,886,400 | 91,117,440 |
| Size | 559.7 MB | 86.9 MB |
| Events in quadrant A | 3,794,353 | 564,677 |
| Events in quadrant B | 3,976,787 | 564,259 |
| Events in quadrant C | 5,449,490 | 543,659 |
| Events in quadrant D | 4,026,340 | 546,065 |
| Mode M0 | |||
|---|---|---|---|
| Quadrant | BADHDUFLAG | Total packets | Discarded packets |
| A | 0 | 16330 | 3 |
| B | 0 | 16821 | 2 |
| C | 0 | 21550 | 2 |
| D | 0 | 17447 | 2 |
| Mode M9 | |||
|---|---|---|---|
| Quadrant | BADHDUFLAG | Total packets | Discarded packets |
| A | 0 | 7 | 0 |
| B | 0 | 7 | 0 |
| C | 0 | 7 | 0 |
| D | 0 | 7 | 0 |
| Mode SS | |||
|---|---|---|---|
| Quadrant | BADHDUFLAG | Total packets | Discarded packets |
| A | 0 | 160 | 0 |
| B | 0 | 160 | 0 |
| C | 0 | 160 | 0 |
| D | 0 | 160 | 0 |
| Quadrant | Total seconds | Saturated seconds | Saturation percentage |
|---|---|---|---|
| A | 7772 | 99 | 1.273803% |
| B | 7772 | 155 | 1.994339% |
| C | 7772 | 260 | 3.345342% |
| D | 7772 | 91 | 1.170870% |
Noise dominated data is calculated using 1-second bins in cleaned event files. If a bin has >2000 counts, and if more than 50% of those come from <1% of pixels, then it is considered to be noise-dominated and hence unusable.
| Quadrant | # 1 sec bins | Bins with >0 counts | Bins with >2000 counts | High rate bins dominated by noise | Noise dominated (total time) | Noise dominated (detector-on time) | Marked lightcurve |
|---|---|---|---|---|---|---|---|
| A | 8488 | 7775 | 0 | 0 | 0.00% | 0.00% | 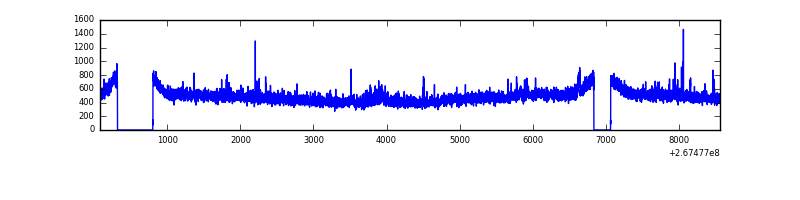 |
| B | 8488 | 7775 | 14 | 14 | 0.16% | 0.18% | 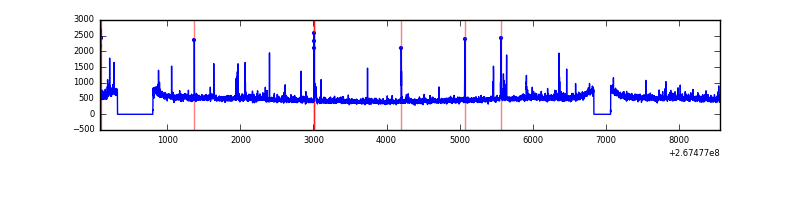 |
| C | 8488 | 7775 | 127 | 127 | 1.50% | 1.63% | 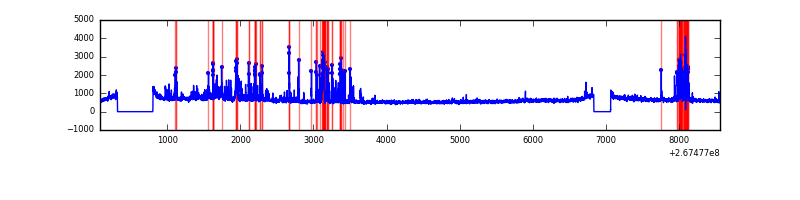 |
| D | 8488 | 7775 | 33 | 33 | 0.39% | 0.42% | 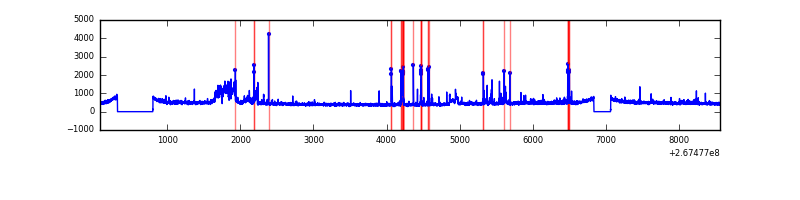 |
Top three noisy pixels from each quadrant. If the there are fewer than three noisy pixels in the level2.evt file, extra rows are filled as -1
| Pixel properties | Quadrant properties | ||||||
|---|---|---|---|---|---|---|---|
| Quadrant | DetID | PixID | Counts | Sigma | Mean | Median | Sigma |
| A | 12 | 189 | 76705 | 395.7 | 948 | 927 | 191.5 |
| A | 11 | 29 | 26843 | 135.33 | 948 | 927 | 191.5 |
| A | 15 | 223 | 18622 | 92.4 | 948 | 927 | 191.5 |
| B | 3 | 64 | 38430 | 209.75 | 942 | 917 | 178.8 |
| B | 3 | 209 | 32961 | 179.17 | 942 | 917 | 178.8 |
| B | 0 | 228 | 31534 | 171.19 | 942 | 917 | 178.8 |
| C | 3 | 233 | 1128769 | 5408.33 | 904 | 906 | 208.5 |
| C | 4 | 254 | 734310 | 3516.82 | 904 | 906 | 208.5 |
| C | 3 | 232 | 18122 | 82.55 | 904 | 906 | 208.5 |
| D | 15 | 0 | 268730 | 1088.22 | 913 | 894 | 246.1 |
| D | 10 | 70 | 196674 | 795.45 | 913 | 894 | 246.1 |
| D | 2 | 234 | 35106 | 139.0 | 913 | 894 | 246.1 |
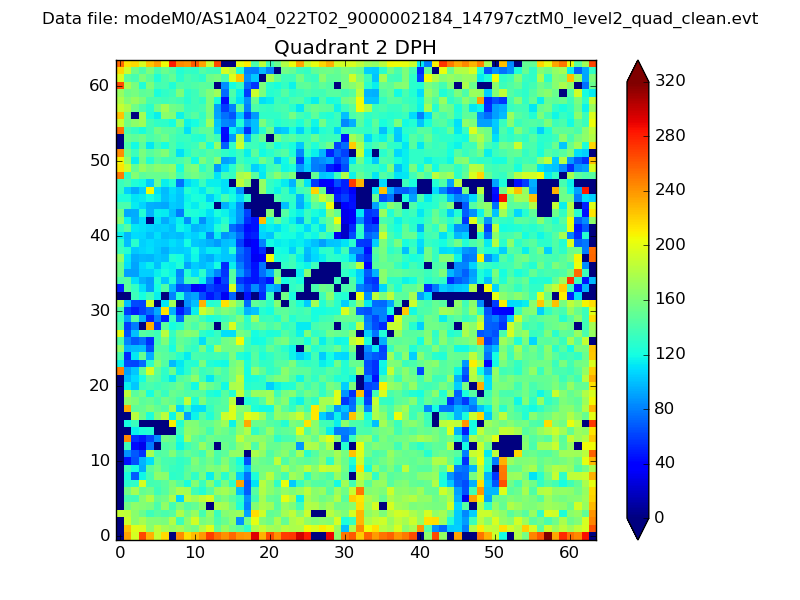
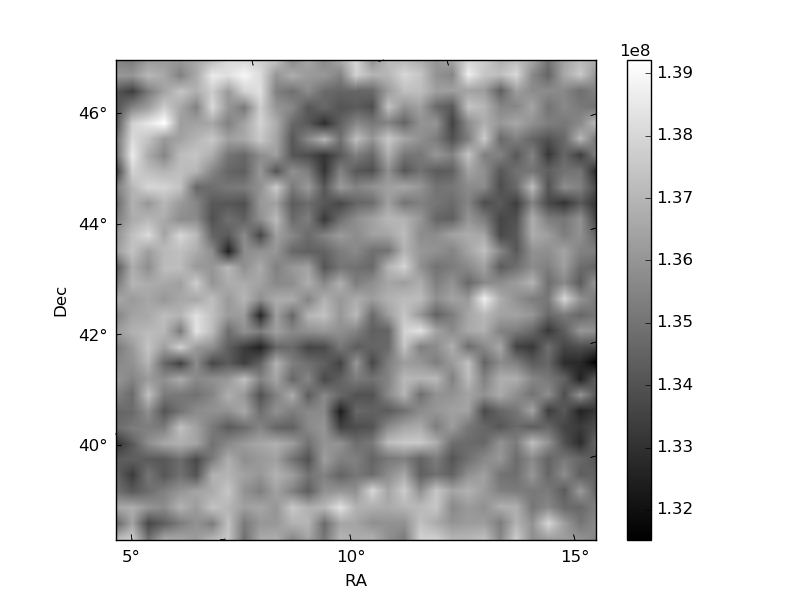
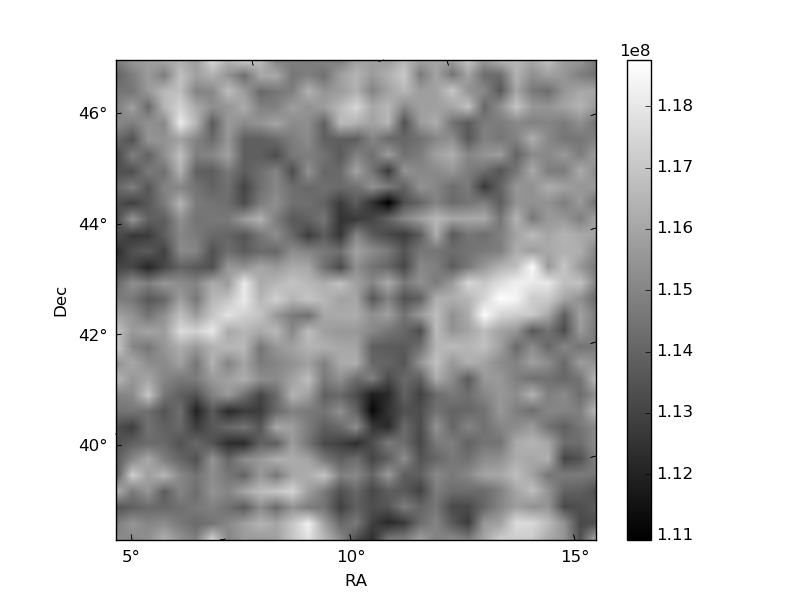
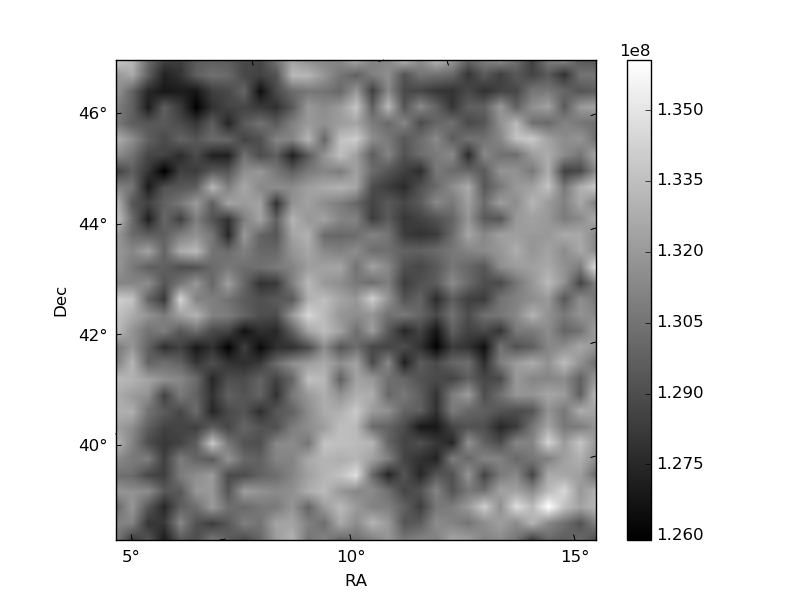
Histogram calculated using DETX and DETY for each event in the final _common_clean file
| Quadrant A |  |
 |
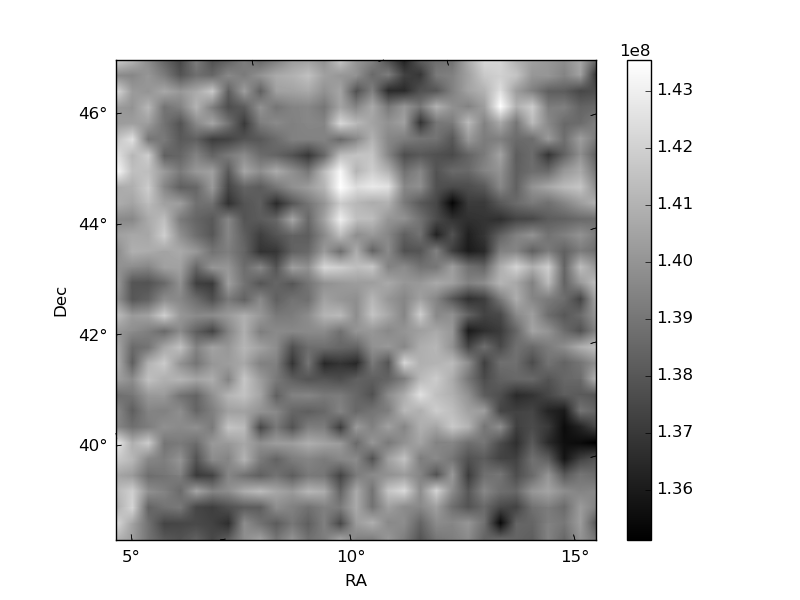
Quadrant B |
|---|---|---|---|
| Quadrant D | 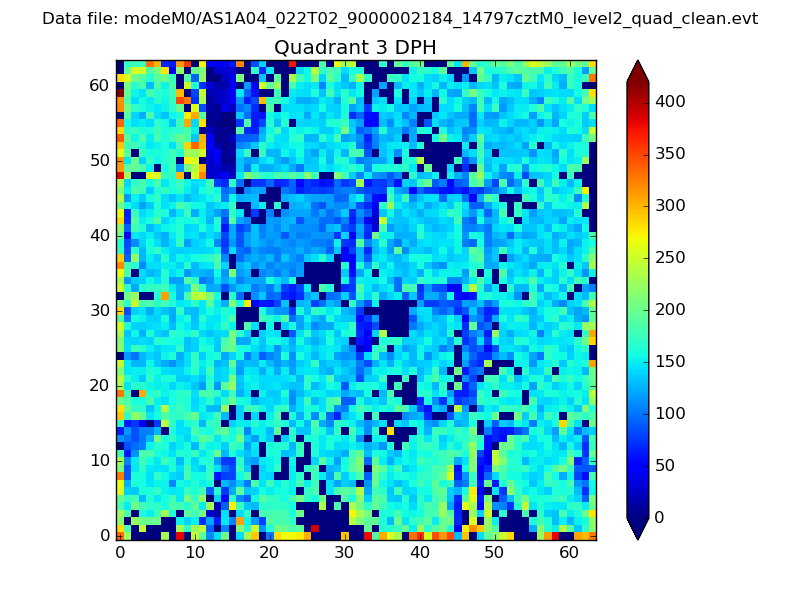 |
 |
Quadrant C |
| Plot type | Count rate plots | Images |
|---|---|---|
| Comparison with Poisson distribution Blue bars denote a histogram of data divided into 1 sec bins. Red curve is a Poisson curve with rate = median count rate of data. |
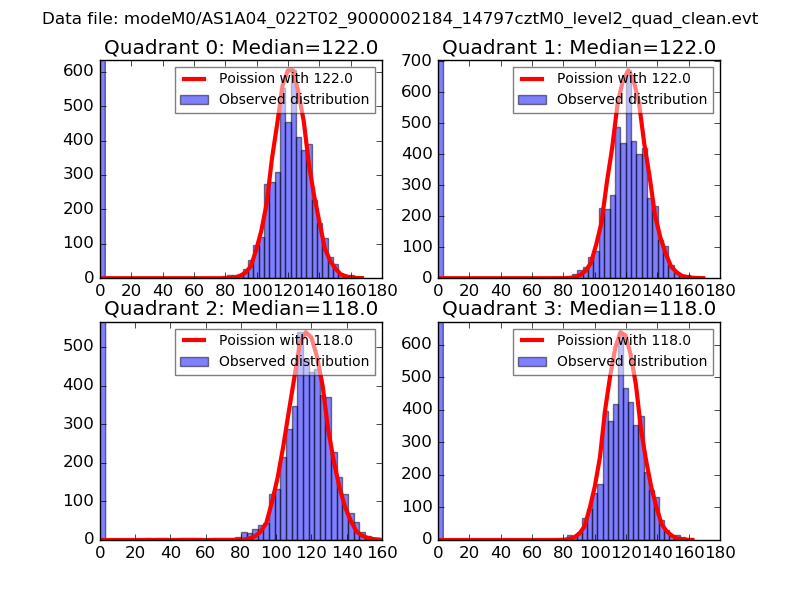 |
 |
| Quadrant-wise count rates Data is divided into 100 sec bins |
 |
|
| Module-wise count rates for Quadrant A Data is divided into 100 sec bins |
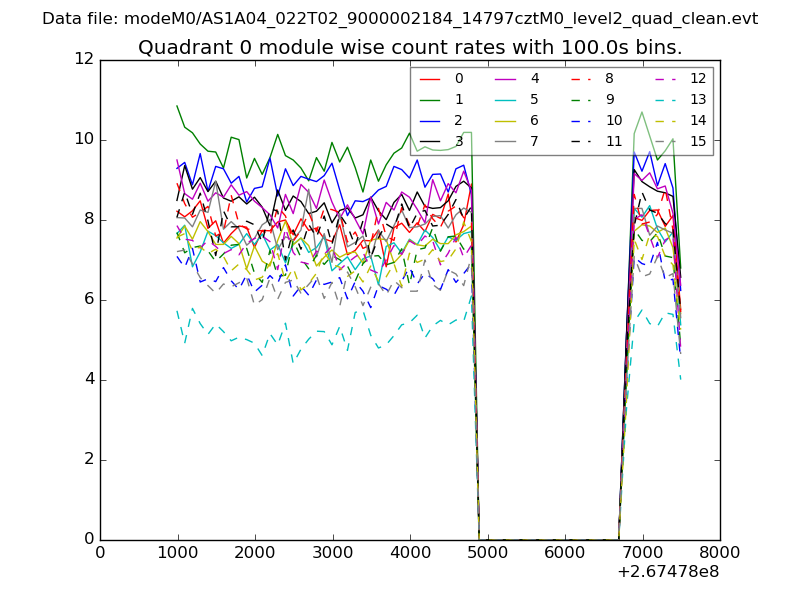 |
 |
| Module-wise count rates for Quadrant B Data is divided into 100 sec bins |
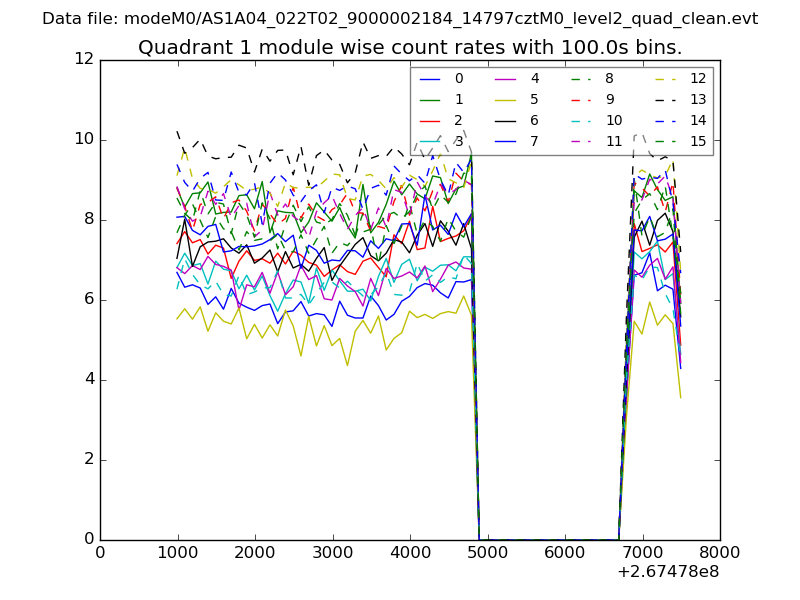 |
 |
| Module-wise count rates for Quadrant C Data is divided into 100 sec bins |
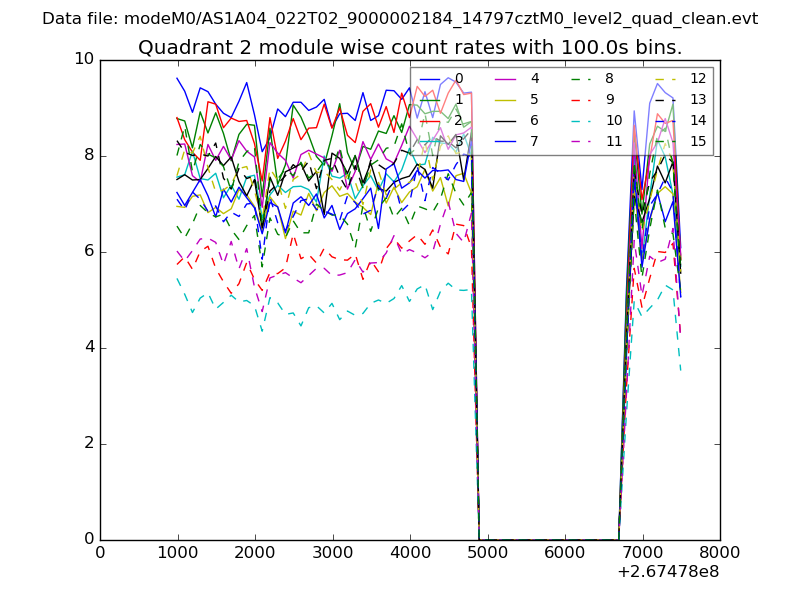 |
 |
| Module-wise count rates for Quadrant D Data is divided into 100 sec bins |
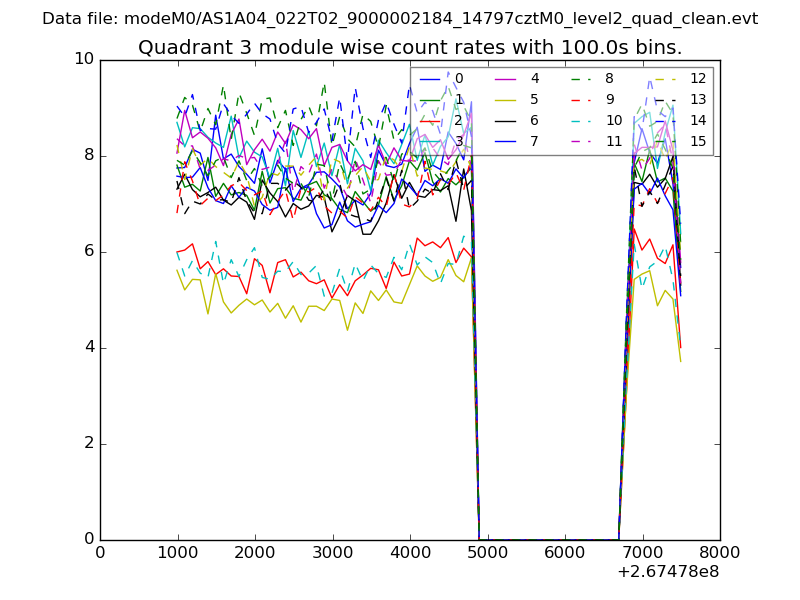 |
 |
| Parameter | Plot |
|---|---|
| CZT HV Monitor | 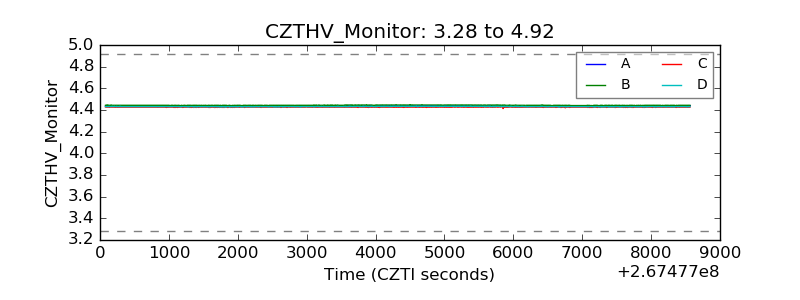 |
| D_VDD | 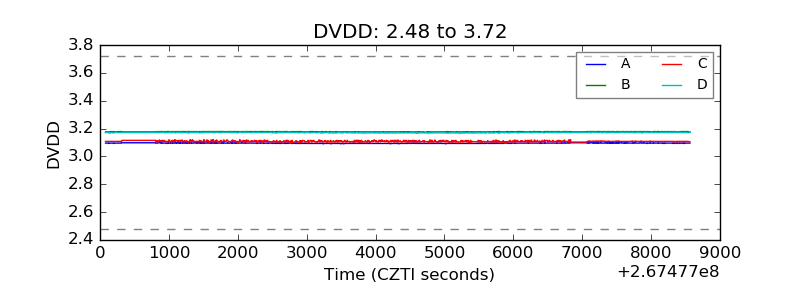 |
| Temperature 1 | 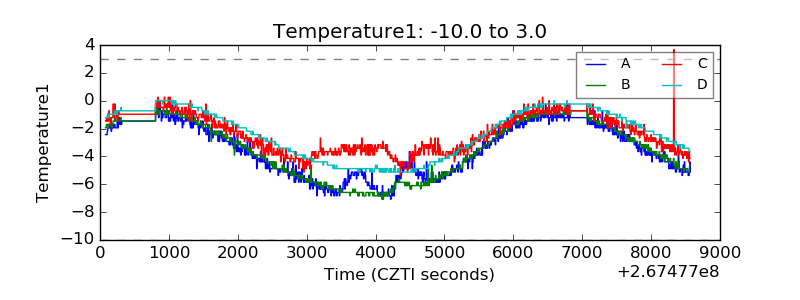 |
| Veto HV Monitor | 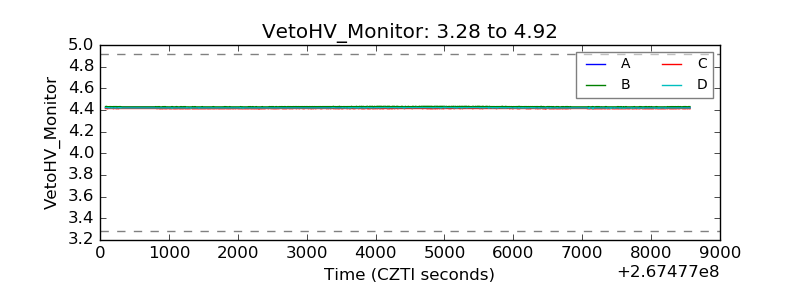 |
| Veto LLD | 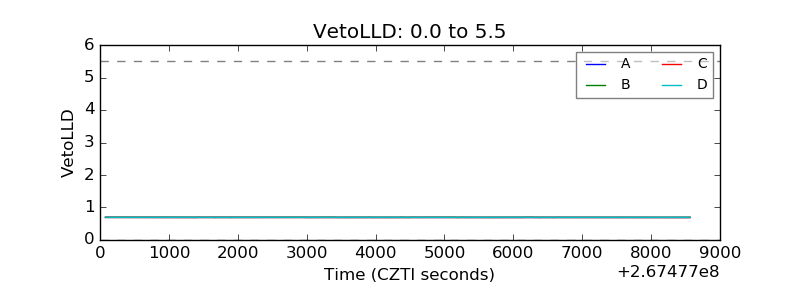 |
| Alpha Counter | 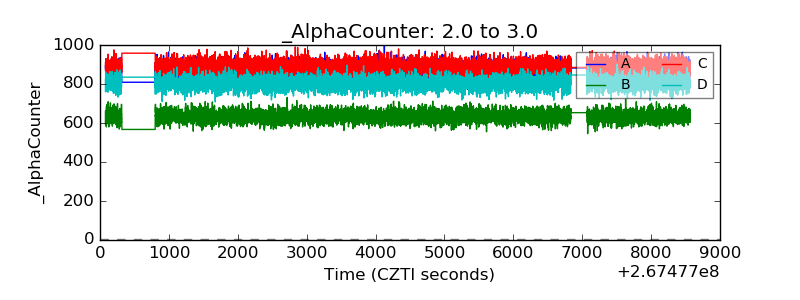 |
| _CPM_Rate | 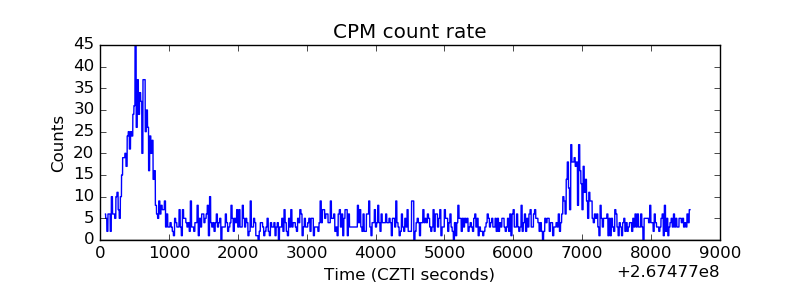 |
| CZT Counter | 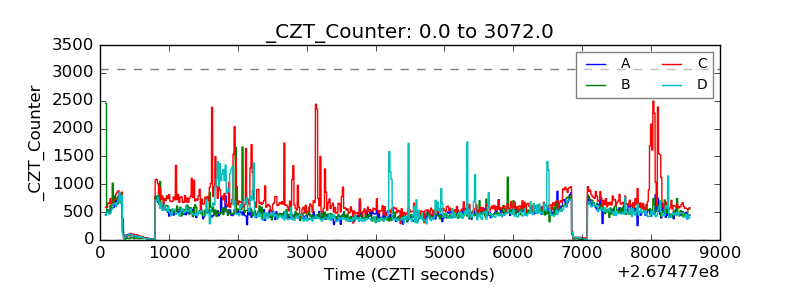 |
| +2.5 Volts monitor |  |
| +5 Volts monitor |  |
| _ROLL_ROT | 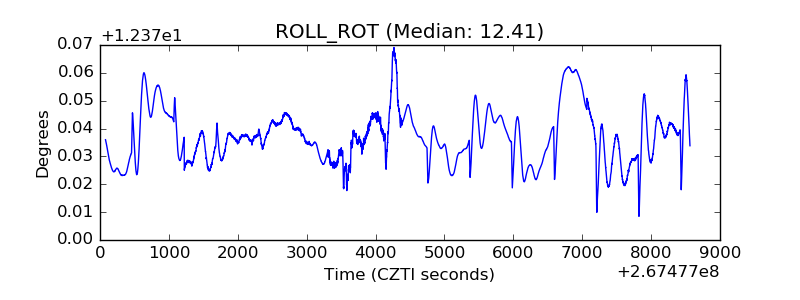 |
| _Roll_DEC | 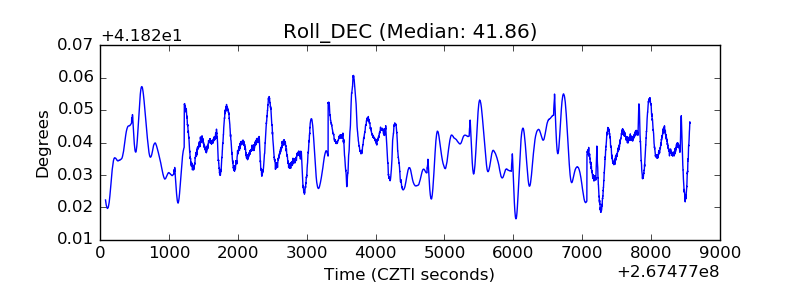 |
| _Roll_RA | 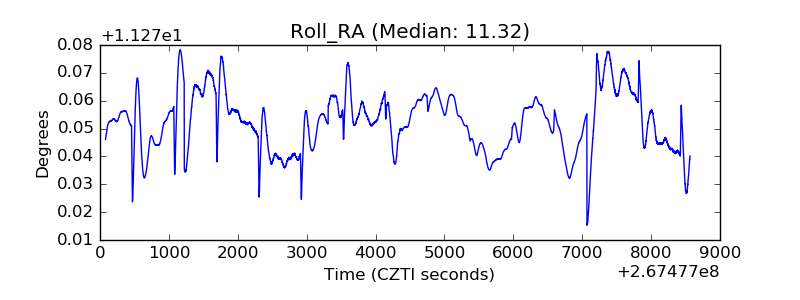 |
| Veto Counter | 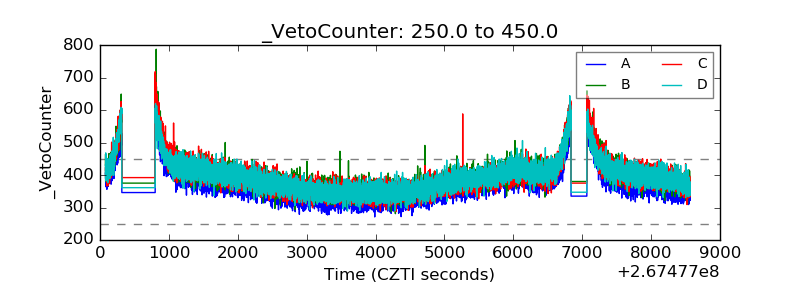 |