| Param | Original file | Final file |
|---|---|---|
| Filename | modeM0/AS1A04_022T02_9000002184_14800cztM0_level2.evt | modeM0/AS1A04_022T02_9000002184_14800cztM0_level2_quad_clean.evt |
| Size (bytes) | 442,255,680 | 74,782,080 |
| Size | 421.8 MB | 71.3 MB |
| Events in quadrant A | 3,298,058 | 461,247 |
| Events in quadrant B | 3,156,012 | 461,546 |
| Events in quadrant C | 3,560,431 | 456,347 |
| Events in quadrant D | 2,953,070 | 447,597 |
| Mode M0 | |||
|---|---|---|---|
| Quadrant | BADHDUFLAG | Total packets | Discarded packets |
| A | 0 | 14061 | 1 |
| B | 0 | 13516 | 1 |
| C | 0 | 14761 | 1 |
| D | 0 | 13337 | 1 |
| Mode M9 | |||
|---|---|---|---|
| Quadrant | BADHDUFLAG | Total packets | Discarded packets |
| A | 0 | 6 | 0 |
| B | 0 | 5 | 0 |
| C | 0 | 5 | 0 |
| D | 0 | 5 | 0 |
| Mode SS | |||
|---|---|---|---|
| Quadrant | BADHDUFLAG | Total packets | Discarded packets |
| A | 0 | 130 | 0 |
| B | 0 | 130 | 0 |
| C | 0 | 130 | 0 |
| D | 0 | 130 | 0 |
| Quadrant | Total seconds | Saturated seconds | Saturation percentage |
|---|---|---|---|
| A | 6269 | 88 | 1.403733% |
| B | 6269 | 73 | 1.164460% |
| C | 6269 | 61 | 0.973042% |
| D | 6269 | 60 | 0.957090% |
Noise dominated data is calculated using 1-second bins in cleaned event files. If a bin has >2000 counts, and if more than 50% of those come from <1% of pixels, then it is considered to be noise-dominated and hence unusable.
| Quadrant | # 1 sec bins | Bins with >0 counts | Bins with >2000 counts | High rate bins dominated by noise | Noise dominated (total time) | Noise dominated (detector-on time) | Marked lightcurve |
|---|---|---|---|---|---|---|---|
| A | 6605 | 6271 | 20 | 20 | 0.30% | 0.32% | 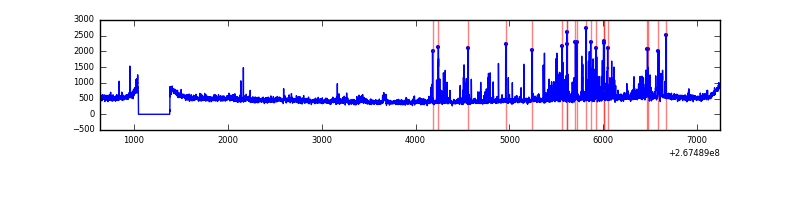 |
| B | 6605 | 6271 | 11 | 11 | 0.17% | 0.18% | 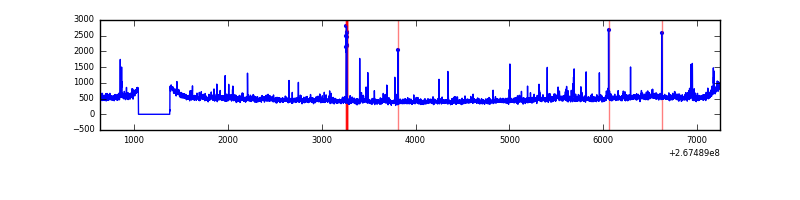 |
| C | 6605 | 6271 | 0 | 0 | 0.00% | 0.00% | 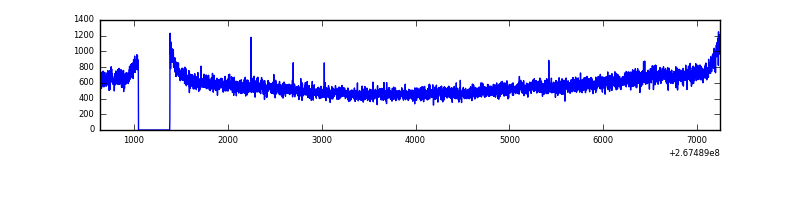 |
| D | 6605 | 6271 | 27 | 27 | 0.41% | 0.43% | 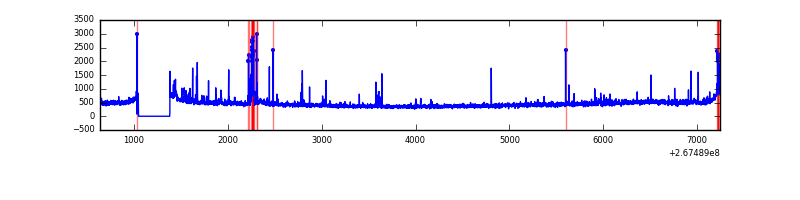 |
Top three noisy pixels from each quadrant. If the there are fewer than three noisy pixels in the level2.evt file, extra rows are filled as -1
| Pixel properties | Quadrant properties | ||||||
|---|---|---|---|---|---|---|---|
| Quadrant | DetID | PixID | Counts | Sigma | Mean | Median | Sigma |
| A | 15 | 223 | 283274 | 1844.37 | 747 | 731 | 153.2 |
| A | 12 | 189 | 80245 | 519.05 | 747 | 731 | 153.2 |
| A | 15 | 239 | 26480 | 168.08 | 747 | 731 | 153.2 |
| B | 0 | 229 | 65254 | 450.73 | 748 | 729 | 143.2 |
| B | 0 | 190 | 20340 | 136.99 | 748 | 729 | 143.2 |
| B | 3 | 209 | 20272 | 136.52 | 748 | 729 | 143.2 |
| C | 3 | 233 | 726231 | 4321.74 | 721 | 721 | 167.9 |
| C | 8 | 128 | 9348 | 51.39 | 721 | 721 | 167.9 |
| C | 8 | 112 | 7381 | 39.67 | 721 | 721 | 167.9 |
| D | 15 | 0 | 123481 | 672.17 | 721 | 700 | 182.7 |
| D | 2 | 120 | 25623 | 136.44 | 721 | 700 | 182.7 |
| D | 2 | 234 | 23706 | 125.95 | 721 | 700 | 182.7 |
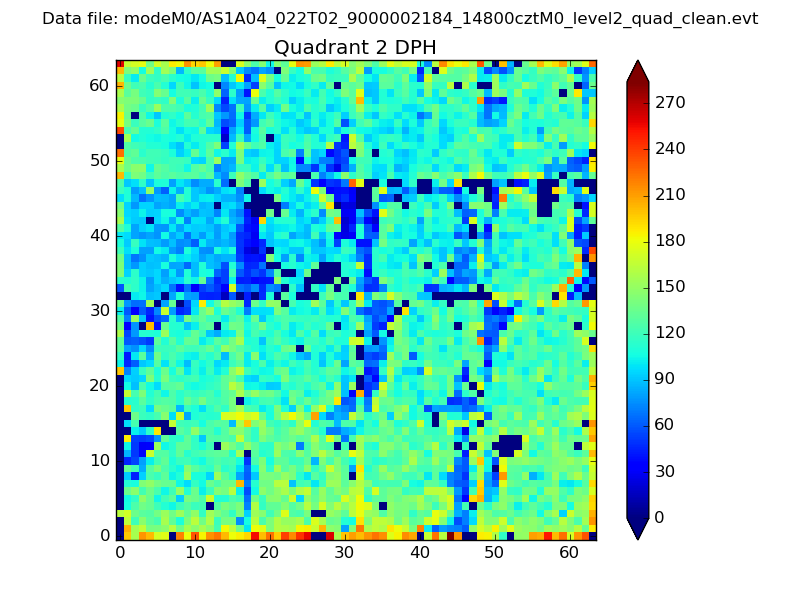
Histogram calculated using DETX and DETY for each event in the final _common_clean file
| Quadrant A | 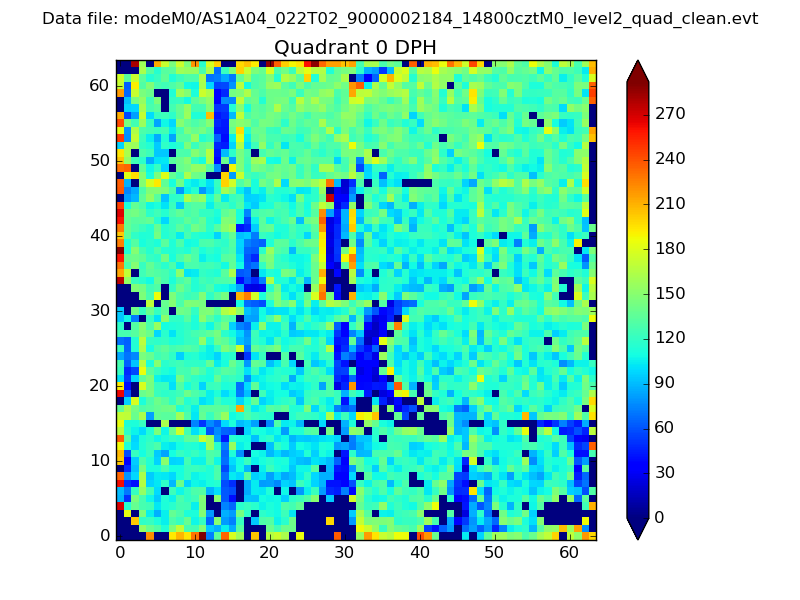 |
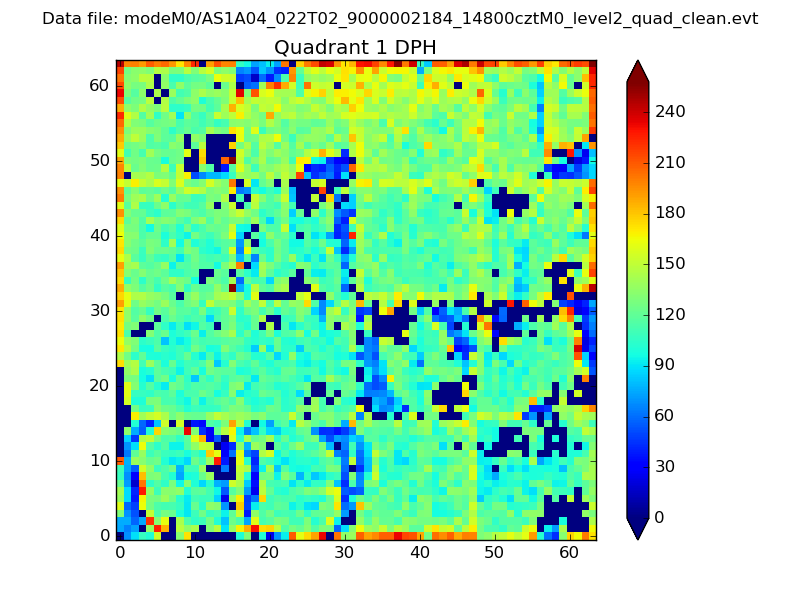 |
Quadrant B |
|---|---|---|---|
| Quadrant D | 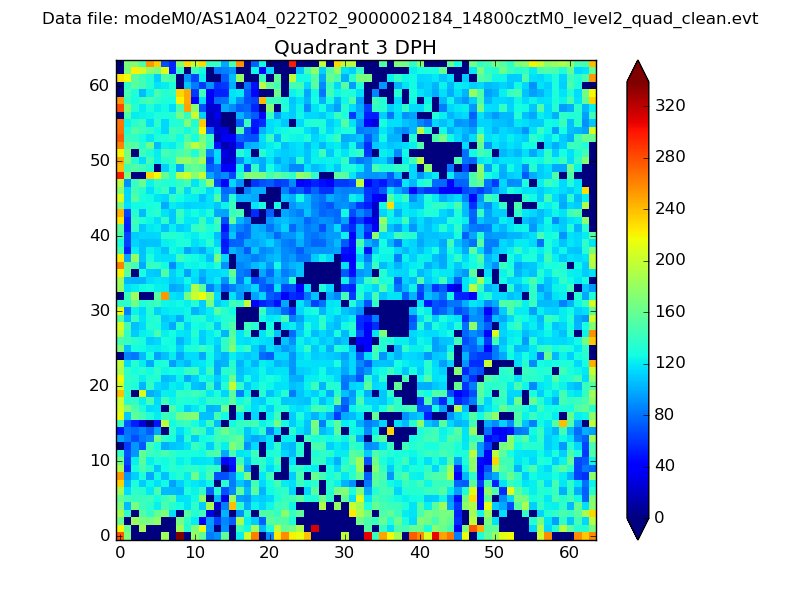 |
 |
Quadrant C |
| Plot type | Count rate plots | Images |
|---|---|---|
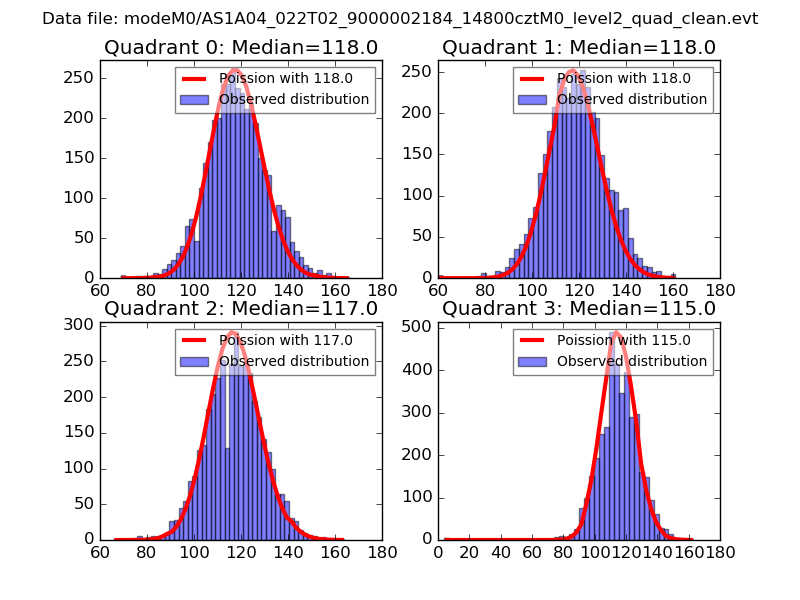
| Comparison with Poisson distribution Blue bars denote a histogram of data divided into 1 sec bins. Red curve is a Poisson curve with rate = median count rate of data. |
 |
 |
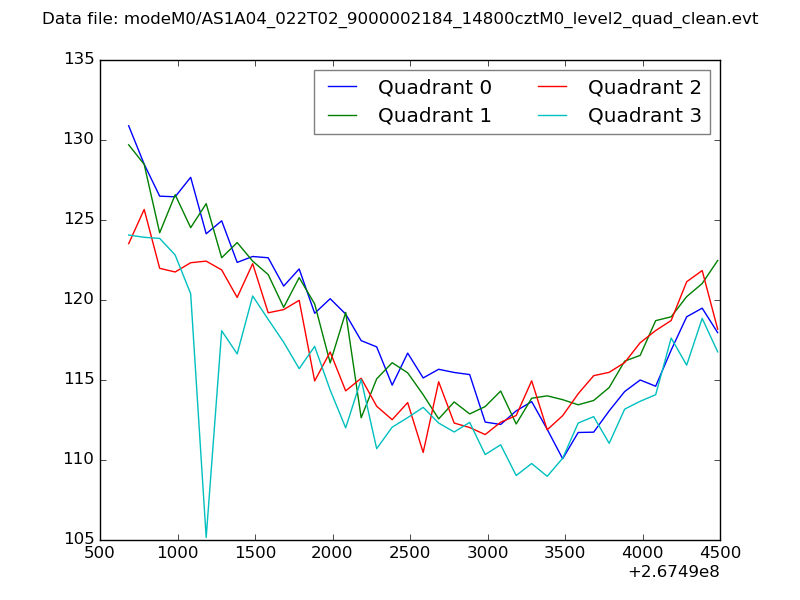
| Quadrant-wise count rates Data is divided into 100 sec bins |
 |
|
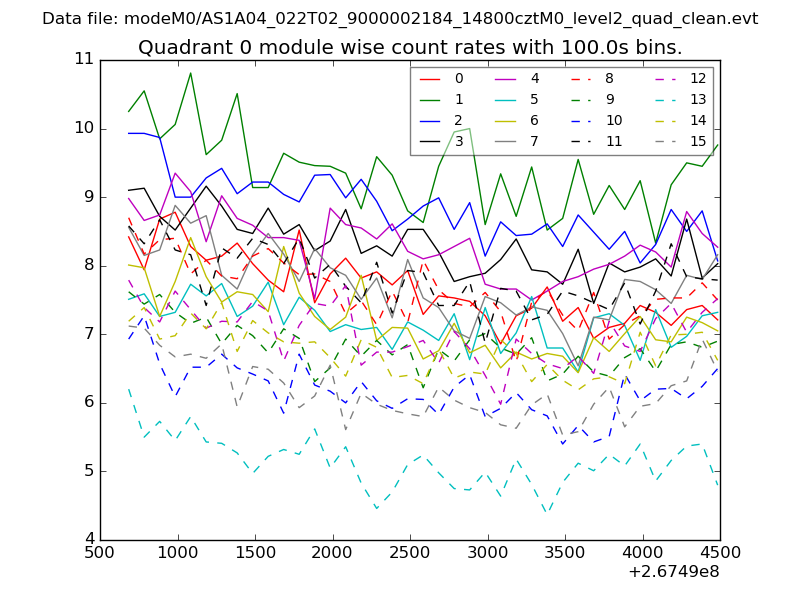
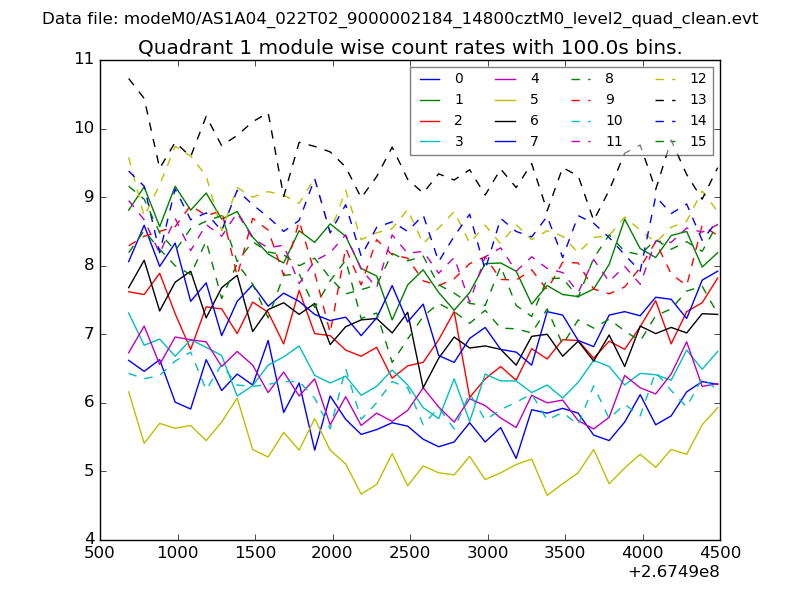
| Module-wise count rates for Quadrant A Data is divided into 100 sec bins |
 |
 |
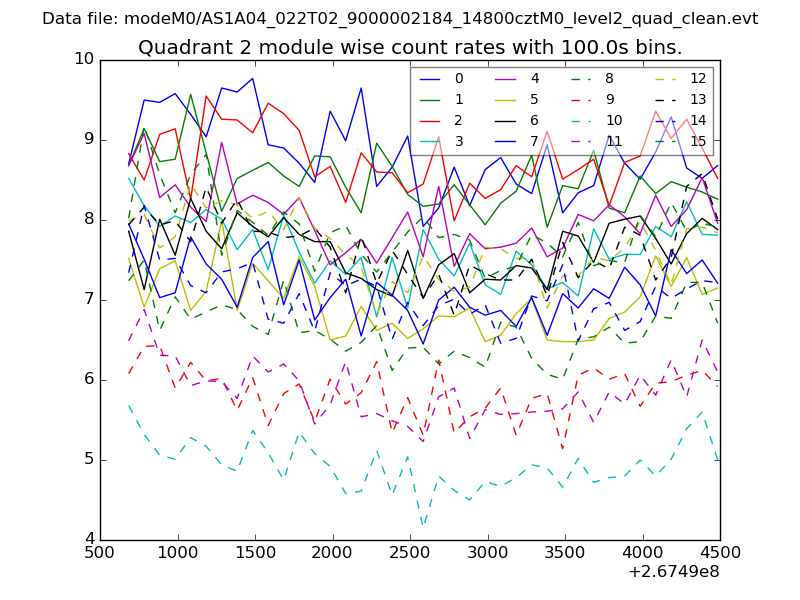
| Module-wise count rates for Quadrant B Data is divided into 100 sec bins |
 |
 |
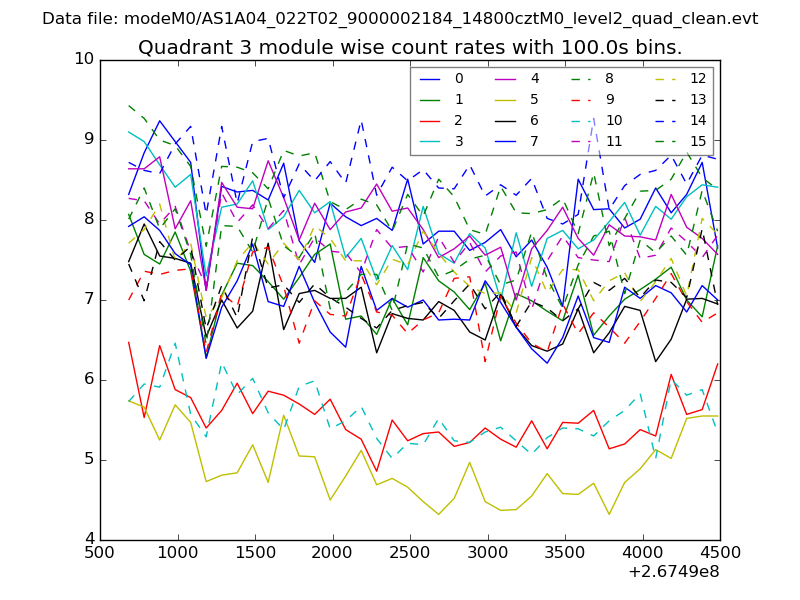
| Module-wise count rates for Quadrant C Data is divided into 100 sec bins |
 |
 |
| Module-wise count rates for Quadrant D Data is divided into 100 sec bins |
 |
 |
| Parameter | Plot |
|---|---|
| CZT HV Monitor | 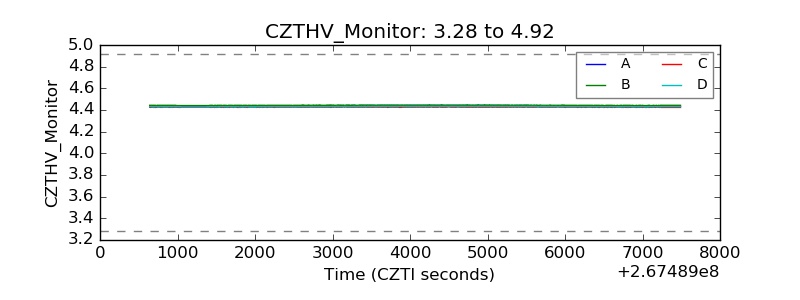 |
| D_VDD | 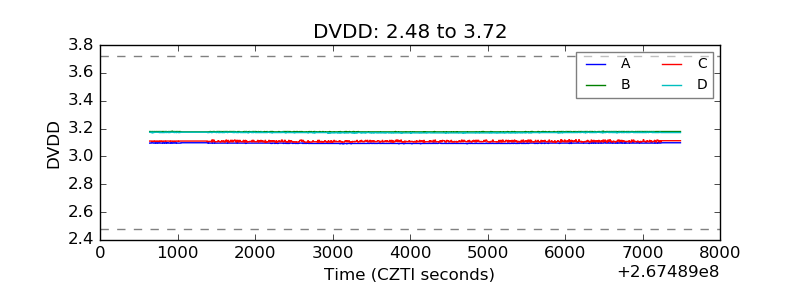 |
| Temperature 1 | 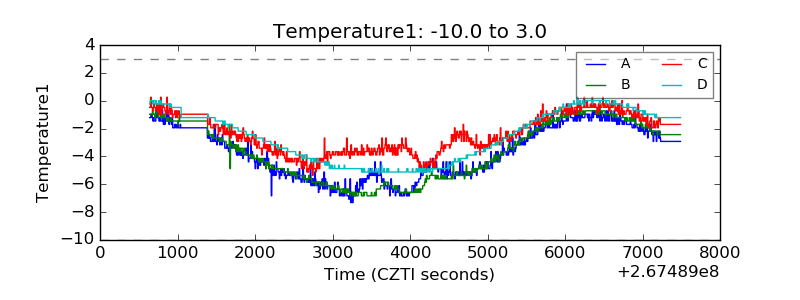 |
| Veto HV Monitor | 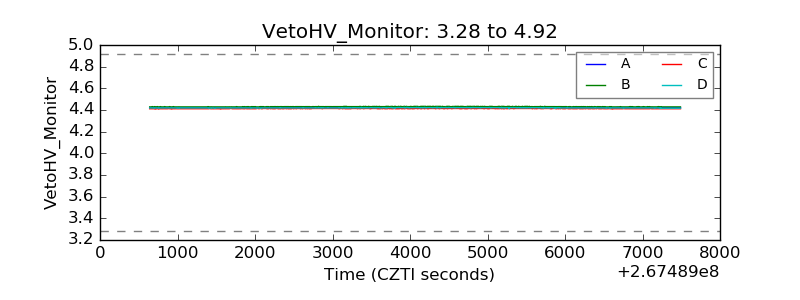 |
| Veto LLD | 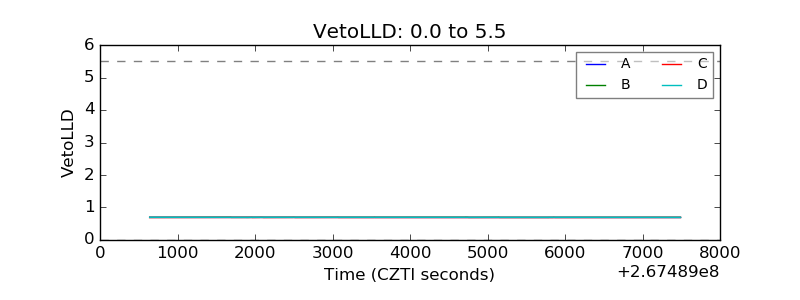 |
| Alpha Counter | 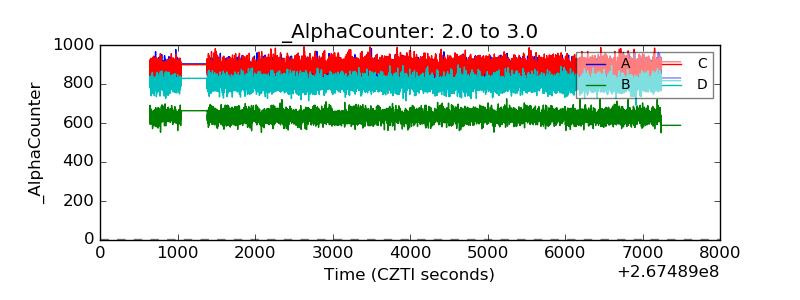 |
| _CPM_Rate | 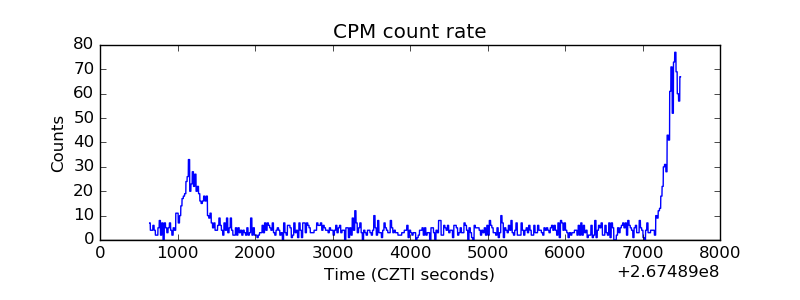 |
| CZT Counter | 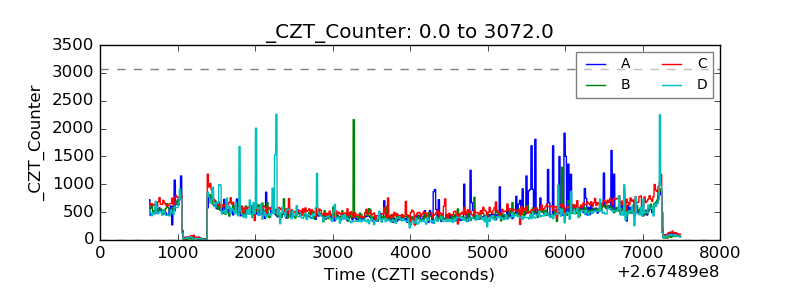 |
| +2.5 Volts monitor | 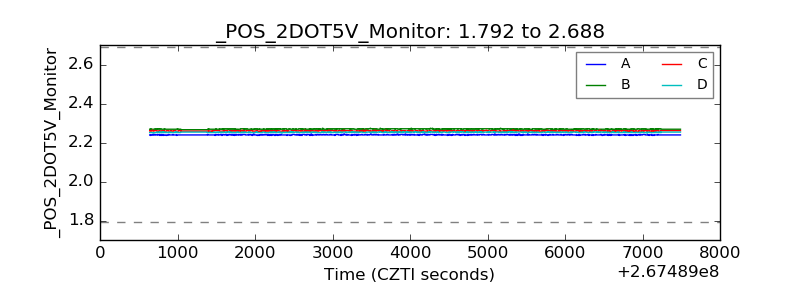 |
| +5 Volts monitor | 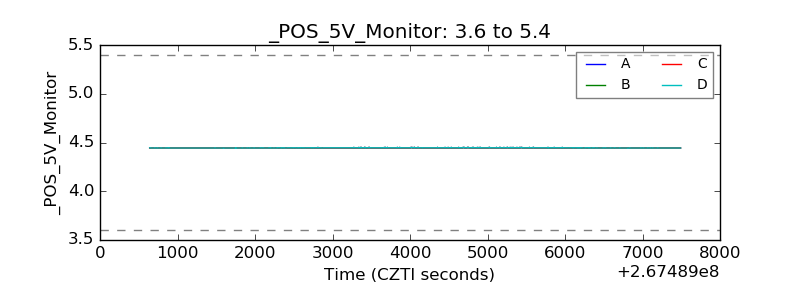 |
| _ROLL_ROT | 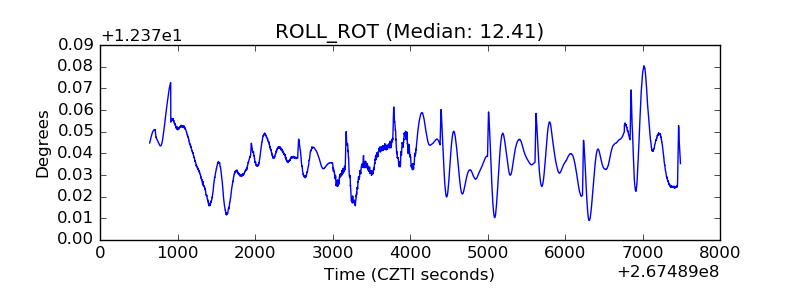 |
| _Roll_DEC | 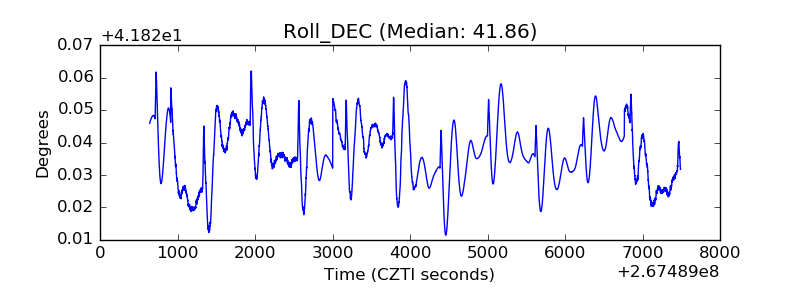 |
| _Roll_RA | 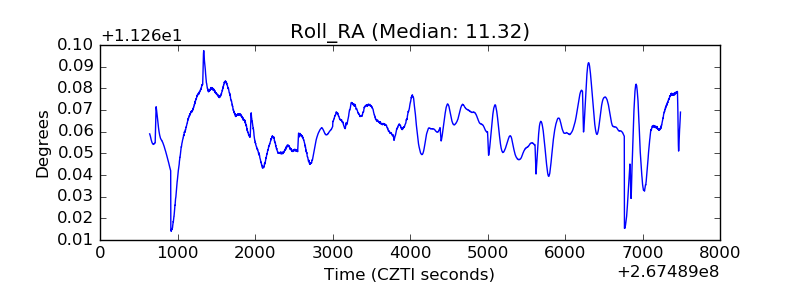 |
| Veto Counter | 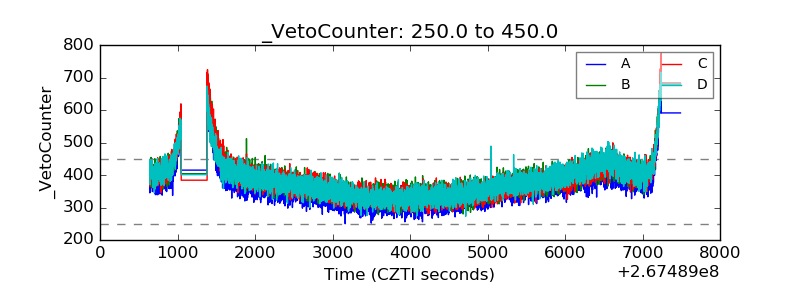 |