| Param | Original file | Final file |
|---|---|---|
| Filename | modeM0/AS1A04_022T02_9000002184_14801cztM0_level2.evt | modeM0/AS1A04_022T02_9000002184_14801cztM0_level2_quad_clean.evt |
| Size (bytes) | 926,101,440 | 166,993,920 |
| Size | 883.2 MB | 159.3 MB |
| Events in quadrant A | 6,138,495 | 1,047,437 |
| Events in quadrant B | 7,058,702 | 1,045,023 |
| Events in quadrant C | 7,825,630 | 1,034,592 |
| Events in quadrant D | 6,132,298 | 1,019,873 |
| Mode M0 | |||
|---|---|---|---|
| Quadrant | BADHDUFLAG | Total packets | Discarded packets |
| A | 0 | 27407 | 4 |
| B | 0 | 29873 | 3 |
| C | 0 | 31848 | 3 |
| D | 0 | 28023 | 3 |
| Mode M9 | |||
|---|---|---|---|
| Quadrant | BADHDUFLAG | Total packets | Discarded packets |
| A | 0 | 20 | 0 |
| B | 0 | 20 | 0 |
| C | 0 | 20 | 0 |
| D | 0 | 20 | 0 |
| Mode SS | |||
|---|---|---|---|
| Quadrant | BADHDUFLAG | Total packets | Discarded packets |
| A | 0 | 268 | 0 |
| B | 0 | 268 | 0 |
| C | 0 | 268 | 0 |
| D | 0 | 268 | 0 |
| Quadrant | Total seconds | Saturated seconds | Saturation percentage |
|---|---|---|---|
| A | 13188 | 73 | 0.553534% |
| B | 13188 | 259 | 1.963907% |
| C | 13188 | 125 | 0.947831% |
| D | 13188 | 149 | 1.129815% |
Noise dominated data is calculated using 1-second bins in cleaned event files. If a bin has >2000 counts, and if more than 50% of those come from <1% of pixels, then it is considered to be noise-dominated and hence unusable.
| Quadrant | # 1 sec bins | Bins with >0 counts | Bins with >2000 counts | High rate bins dominated by noise | Noise dominated (total time) | Noise dominated (detector-on time) | Marked lightcurve |
|---|---|---|---|---|---|---|---|
| A | 15159 | 13192 | 2 | 2 | 0.01% | 0.02% | 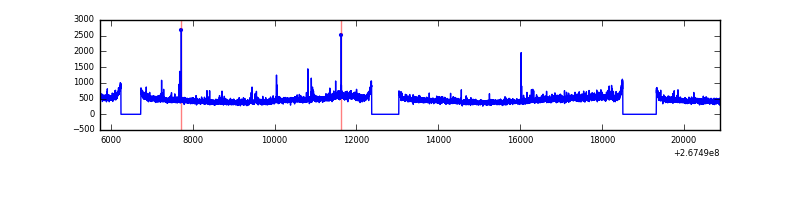 |
| B | 15159 | 13192 | 106 | 106 | 0.70% | 0.80% | 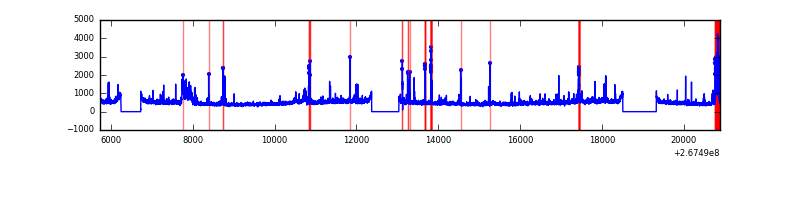 |
| C | 15159 | 13192 | 32 | 32 | 0.21% | 0.24% | 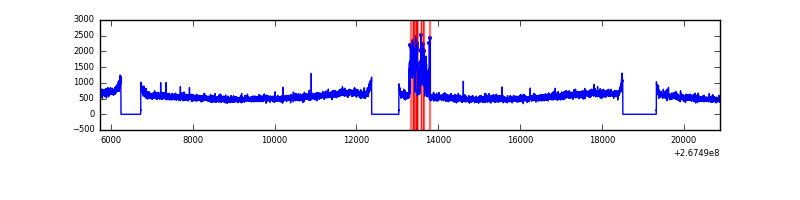 |
| D | 15159 | 13192 | 100 | 100 | 0.66% | 0.76% | 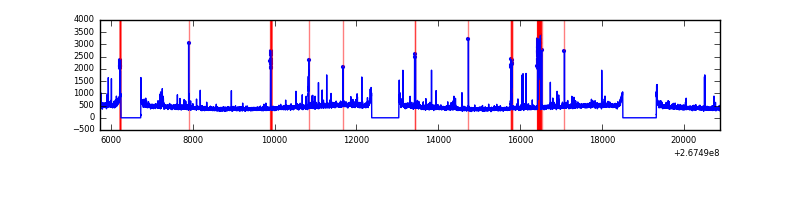 |
Top three noisy pixels from each quadrant. If the there are fewer than three noisy pixels in the level2.evt file, extra rows are filled as -1
| Pixel properties | Quadrant properties | ||||||
|---|---|---|---|---|---|---|---|
| Quadrant | DetID | PixID | Counts | Sigma | Mean | Median | Sigma |
| A | 12 | 189 | 151992 | 484.28 | 1539 | 1505 | 310.7 |
| A | 12 | 96 | 33095 | 101.66 | 1539 | 1505 | 310.7 |
| A | 4 | 2 | 18455 | 54.55 | 1539 | 1505 | 310.7 |
| B | 10 | 16 | 332063 | 1128.15 | 1538 | 1497 | 293.0 |
| B | 0 | 219 | 300298 | 1019.74 | 1538 | 1497 | 293.0 |
| B | 3 | 64 | 107680 | 362.38 | 1538 | 1497 | 293.0 |
| C | 3 | 233 | 1995124 | 5794.41 | 1489 | 1493 | 344.1 |
| C | 3 | 232 | 13204 | 34.04 | 1489 | 1493 | 344.1 |
| C | 13 | 61 | 10744 | 26.89 | 1489 | 1493 | 344.1 |
| D | 15 | 0 | 232353 | 619.66 | 1483 | 1442 | 372.6 |
| D | 10 | 70 | 94808 | 250.55 | 1483 | 1442 | 372.6 |
| D | 2 | 234 | 54333 | 141.94 | 1483 | 1442 | 372.6 |
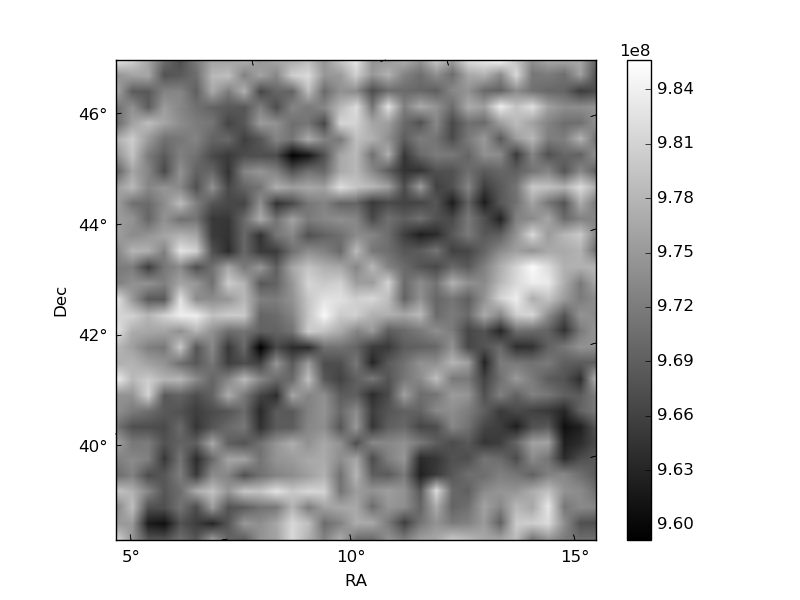
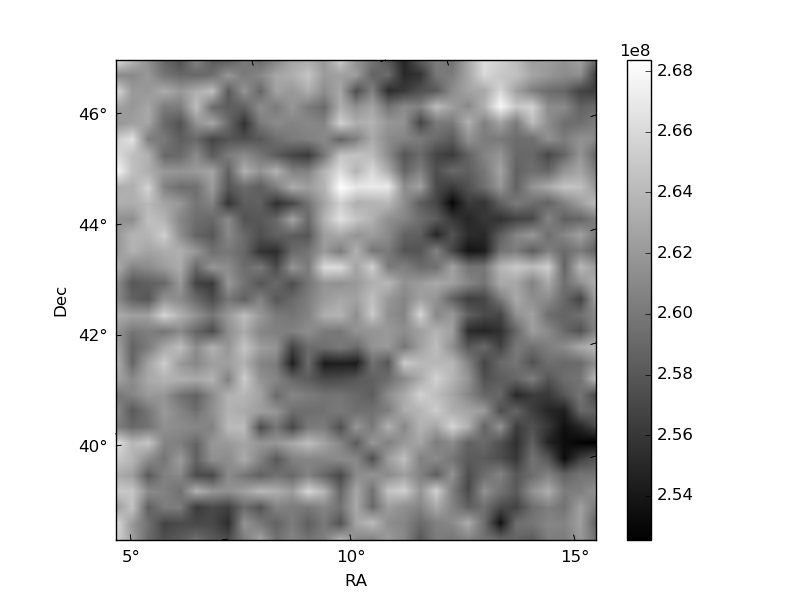
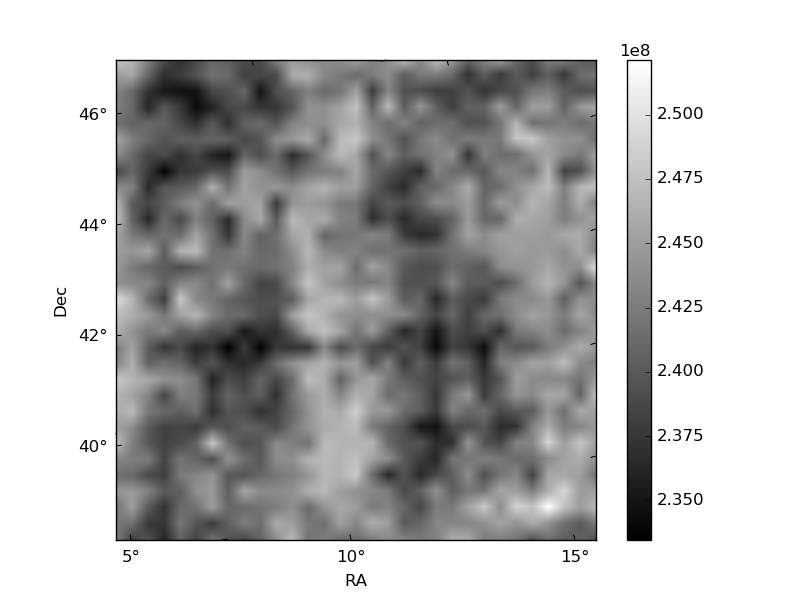
Histogram calculated using DETX and DETY for each event in the final _common_clean file
| Quadrant A | 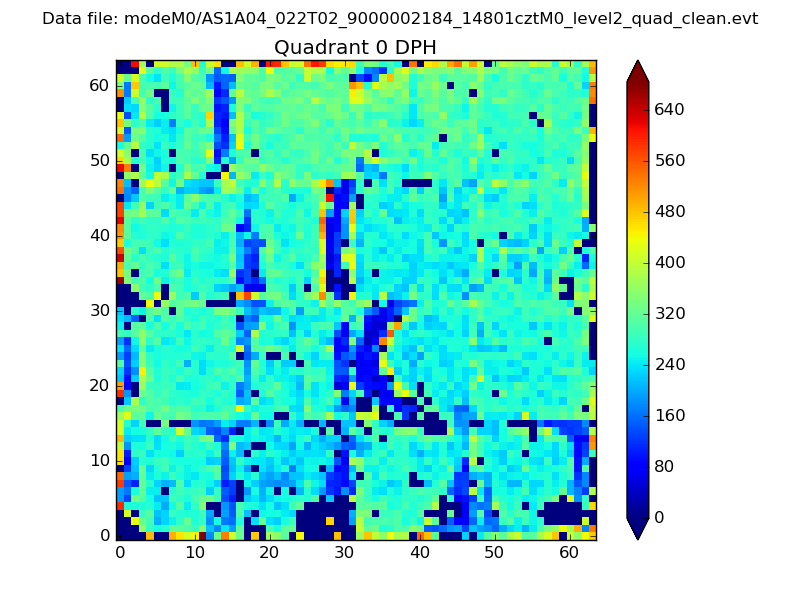 |
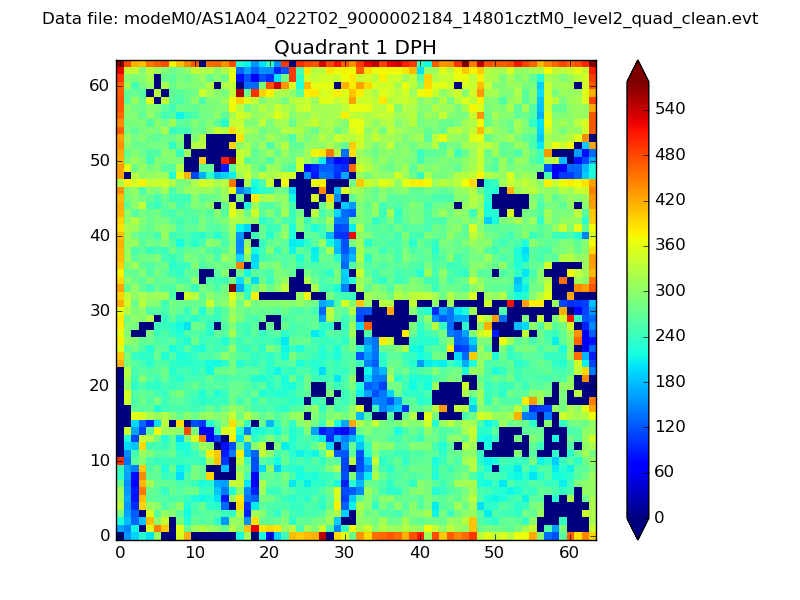 |
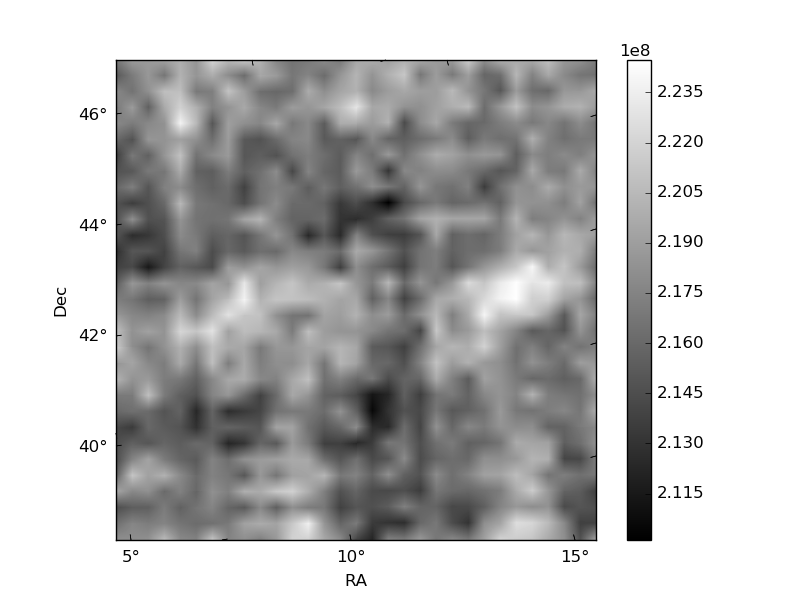
Quadrant B |
|---|---|---|---|
| Quadrant D | 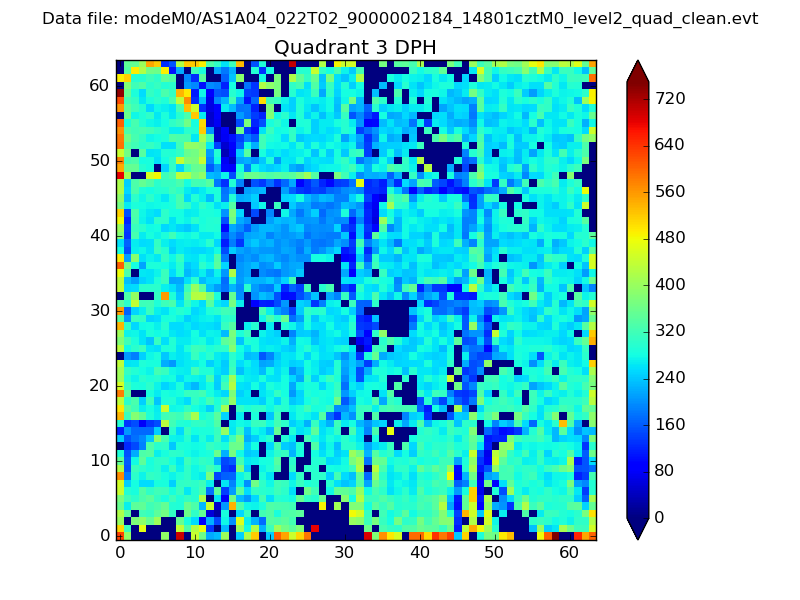 |
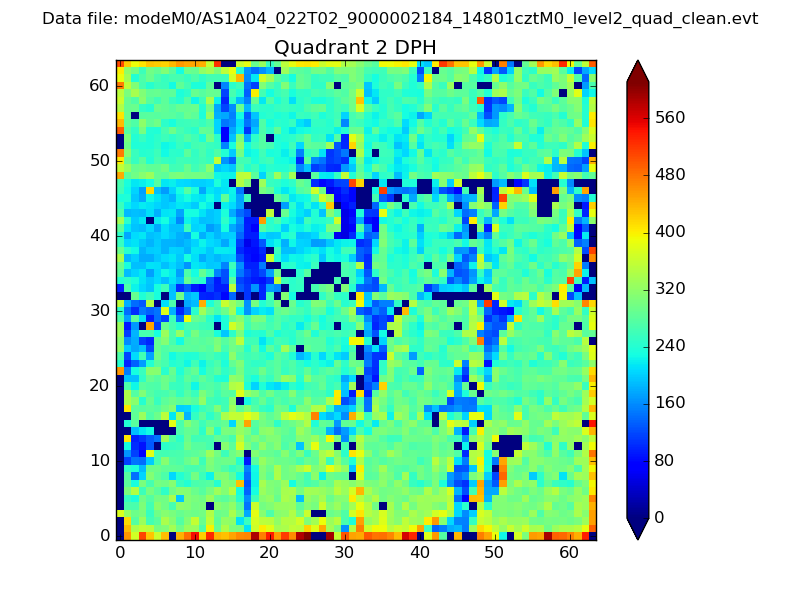 |
Quadrant C |
| Plot type | Count rate plots | Images |
|---|---|---|
| Comparison with Poisson distribution Blue bars denote a histogram of data divided into 1 sec bins. Red curve is a Poisson curve with rate = median count rate of data. |
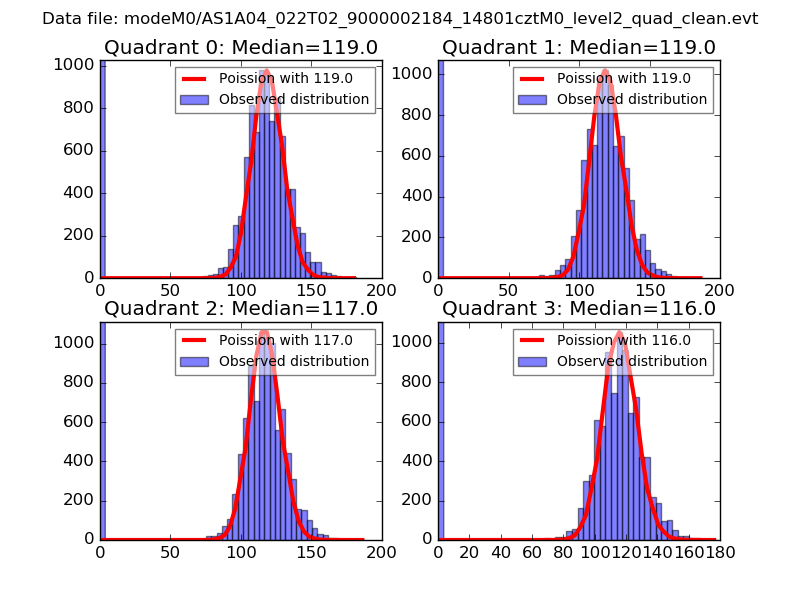 |
 |
| Quadrant-wise count rates Data is divided into 100 sec bins |
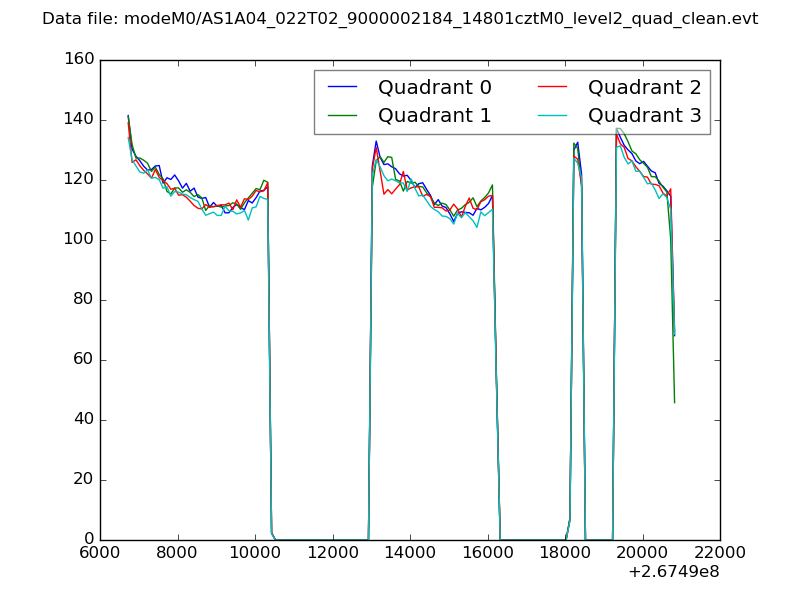 |
|
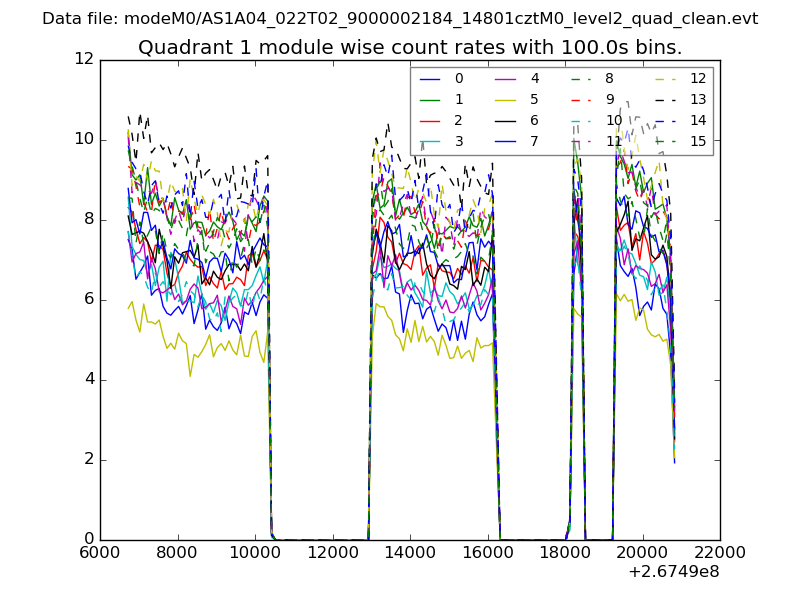
| Module-wise count rates for Quadrant A Data is divided into 100 sec bins |
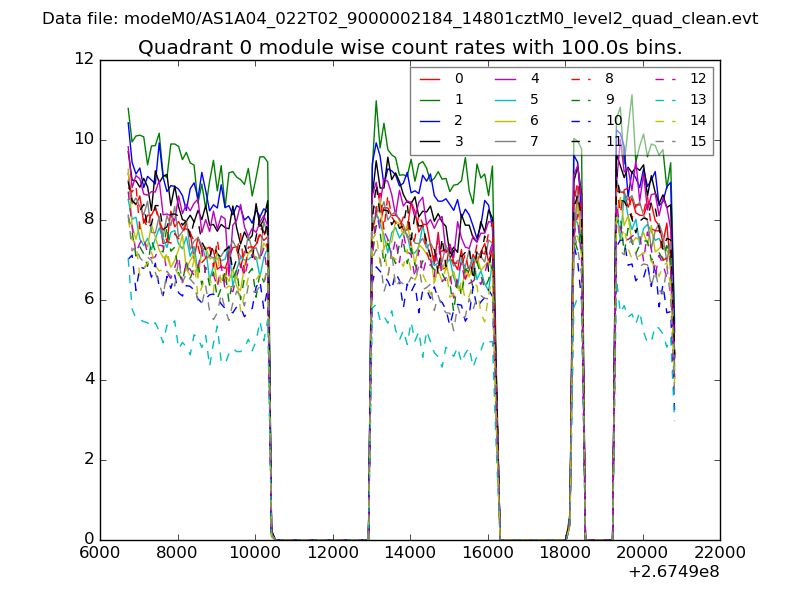 |
 |
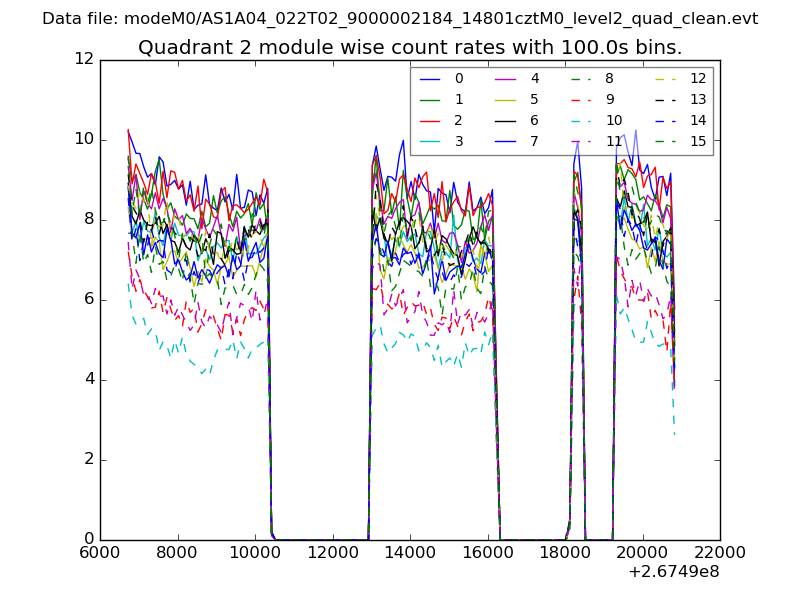
| Module-wise count rates for Quadrant B Data is divided into 100 sec bins |
 |
 |
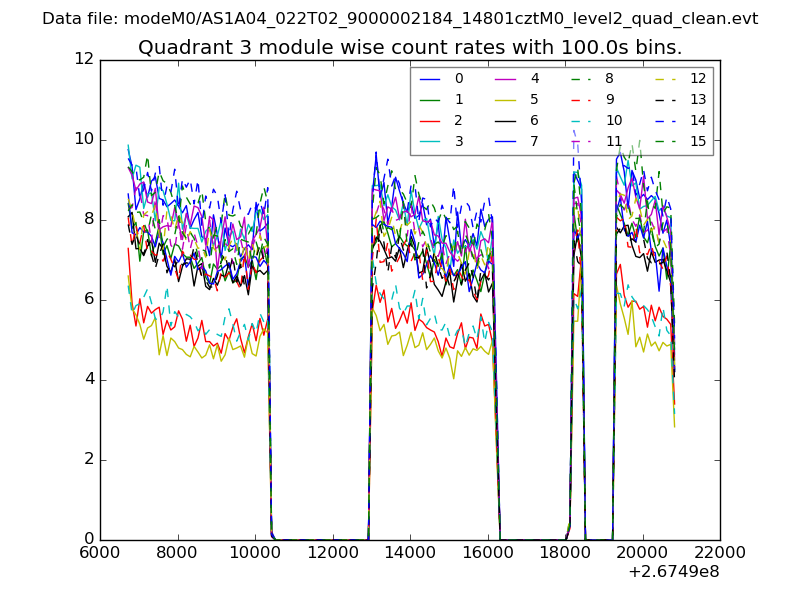
| Module-wise count rates for Quadrant C Data is divided into 100 sec bins |
 |
 |
| Module-wise count rates for Quadrant D Data is divided into 100 sec bins |
 |
 |
| Parameter | Plot |
|---|---|
| CZT HV Monitor | 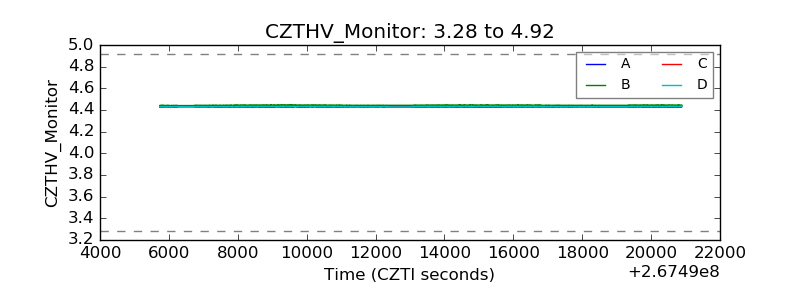 |
| D_VDD | 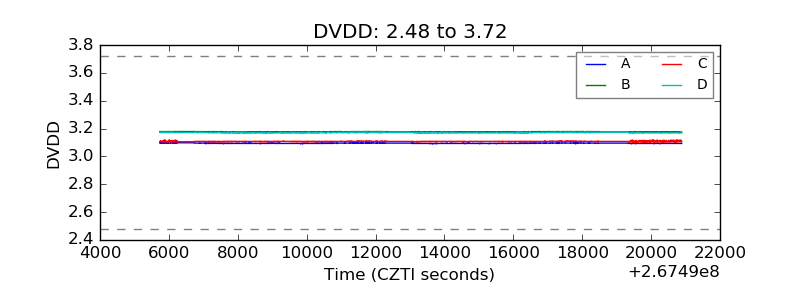 |
| Temperature 1 | 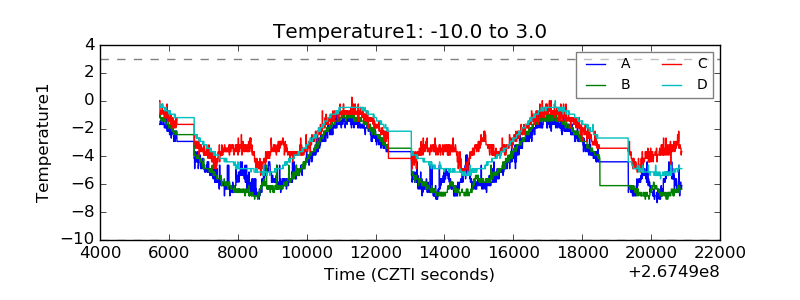 |
| Veto HV Monitor | 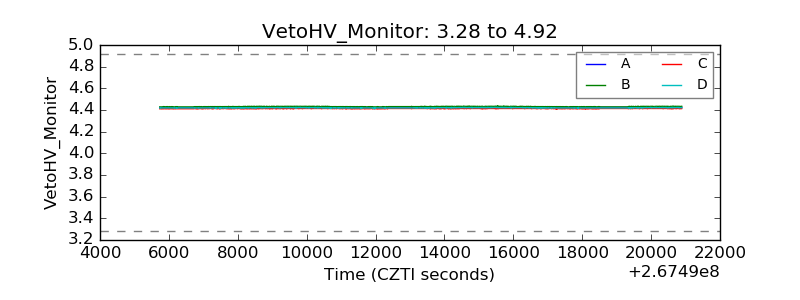 |
| Veto LLD | 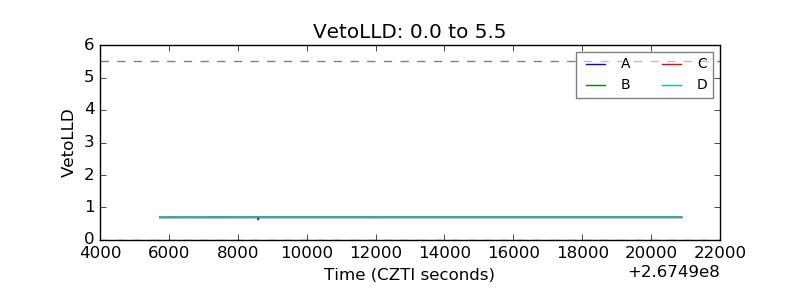 |
| Alpha Counter | 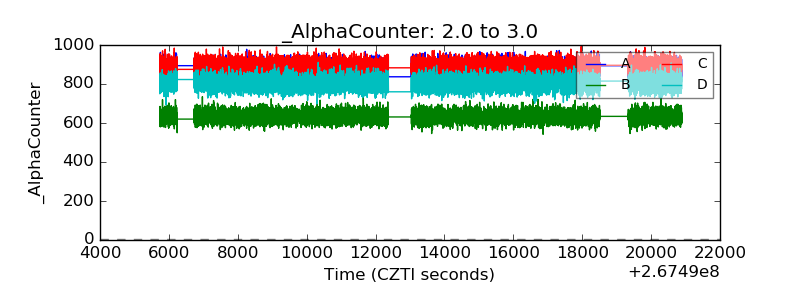 |
| _CPM_Rate | 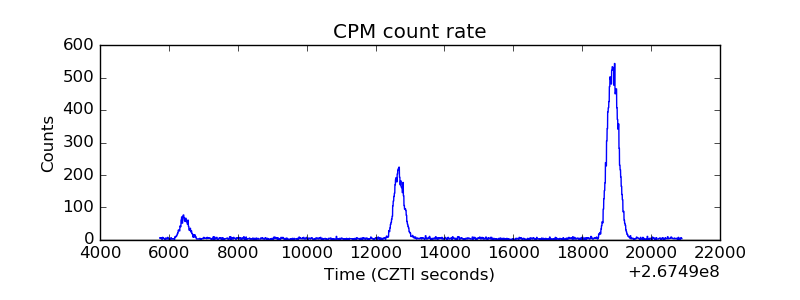 |
| CZT Counter | 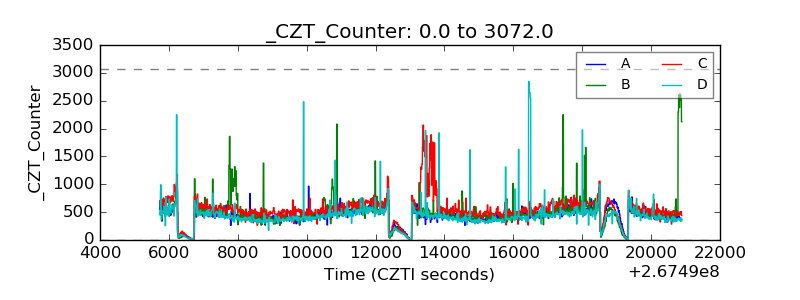 |
| +2.5 Volts monitor |  |
| +5 Volts monitor |  |
| _ROLL_ROT | 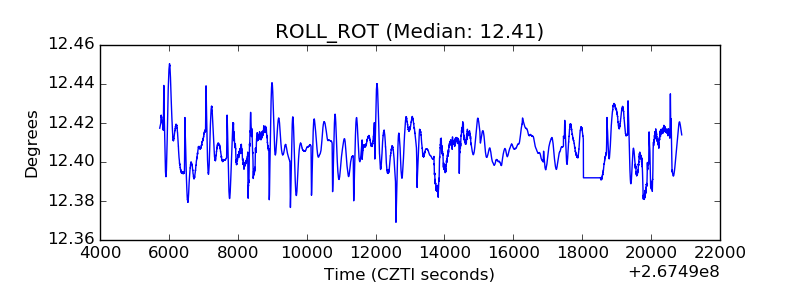 |
| _Roll_DEC |  |
| _Roll_RA | 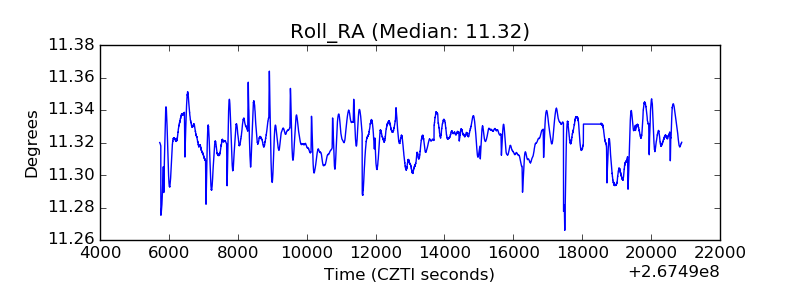 |
| Veto Counter | 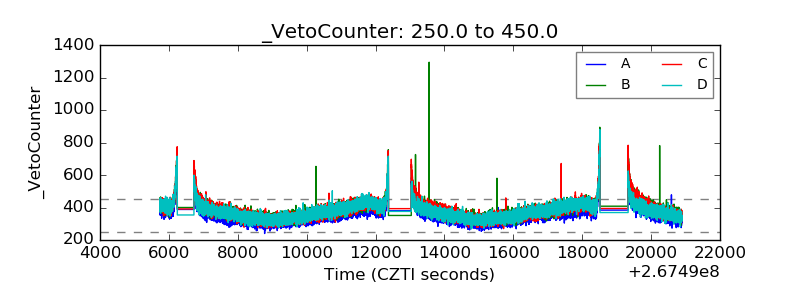 |