| Param | Original file | Final file |
|---|---|---|
| Filename | modeM0/AS1A04_022T02_9000002184_14802cztM0_level2.evt | modeM0/AS1A04_022T02_9000002184_14802cztM0_level2_quad_clean.evt |
| Size (bytes) | 368,907,840 | 64,647,360 |
| Size | 351.8 MB | 61.7 MB |
| Events in quadrant A | 2,418,708 | 407,271 |
| Events in quadrant B | 3,214,149 | 391,143 |
| Events in quadrant C | 2,858,199 | 402,626 |
| Events in quadrant D | 2,328,964 | 393,722 |
| Mode M0 | |||
|---|---|---|---|
| Quadrant | BADHDUFLAG | Total packets | Discarded packets |
| A | 0 | 12187 | 1509 |
| B | 0 | 15434 | 2571 |
| C | 0 | 13315 | 1526 |
| D | 0 | 12266 | 1539 |
| Mode M9 | |||
|---|---|---|---|
| Quadrant | BADHDUFLAG | Total packets | Discarded packets |
| A | 0 | 10 | 0 |
| B | 0 | 10 | 0 |
| C | 0 | 11 | 1 |
| D | 0 | 10 | 0 |
| Mode SS | |||
|---|---|---|---|
| Quadrant | BADHDUFLAG | Total packets | Discarded packets |
| A | 0 | 120 | 18 |
| B | 0 | 120 | 16 |
| C | 0 | 120 | 14 |
| D | 0 | 120 | 14 |
| Quadrant | Total seconds | Saturated seconds | Saturation percentage |
|---|---|---|---|
| A | 5198 | 34 | 0.654098% |
| B | 5121 | 206 | 4.022652% |
| C | 5195 | 28 | 0.538980% |
| D | 5200 | 31 | 0.596154% |
Noise dominated data is calculated using 1-second bins in cleaned event files. If a bin has >2000 counts, and if more than 50% of those come from <1% of pixels, then it is considered to be noise-dominated and hence unusable.
| Quadrant | # 1 sec bins | Bins with >0 counts | Bins with >2000 counts | High rate bins dominated by noise | Noise dominated (total time) | Noise dominated (detector-on time) | Marked lightcurve |
|---|---|---|---|---|---|---|---|
| A | 6937 | 5286 | 2 | 2 | 0.03% | 0.04% | 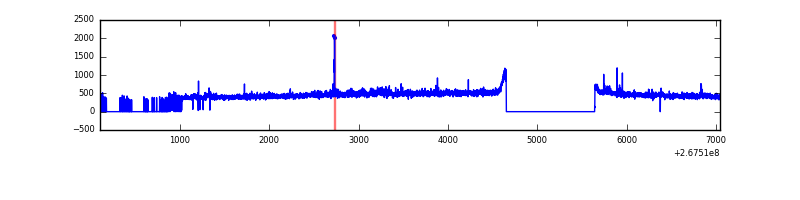 |
| B | 6915 | 5197 | 127 | 127 | 1.84% | 2.44% | 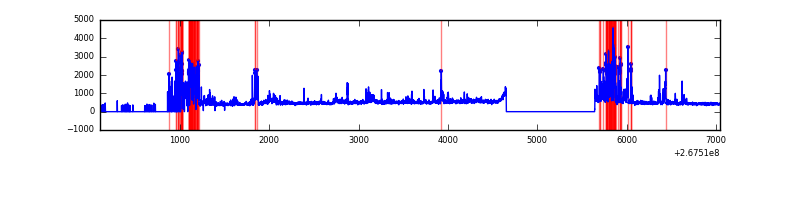 |
| C | 6922 | 5276 | 0 | 0 | 0.00% | 0.00% | 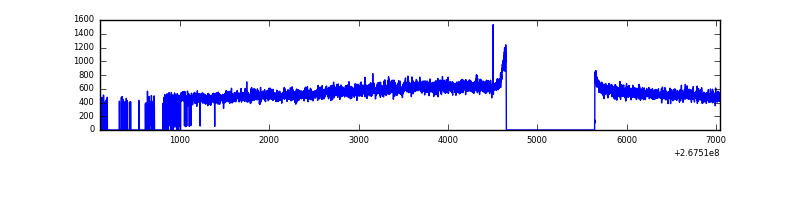 |
| D | 6924 | 5288 | 4 | 4 | 0.06% | 0.08% | 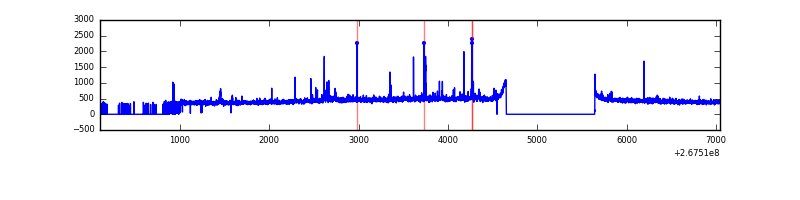 |
Top three noisy pixels from each quadrant. If the there are fewer than three noisy pixels in the level2.evt file, extra rows are filled as -1
| Pixel properties | Quadrant properties | ||||||
|---|---|---|---|---|---|---|---|
| Quadrant | DetID | PixID | Counts | Sigma | Mean | Median | Sigma |
| A | 12 | 189 | 51934 | 410.06 | 611 | 599 | 125.2 |
| A | 4 | 2 | 15085 | 115.71 | 611 | 599 | 125.2 |
| A | 0 | 226 | 5451 | 38.76 | 611 | 599 | 125.2 |
| B | 10 | 16 | 787344 | 6908.47 | 594 | 581 | 113.9 |
| B | 3 | 209 | 22530 | 192.73 | 594 | 581 | 113.9 |
| B | 0 | 205 | 20607 | 175.85 | 594 | 581 | 113.9 |
| C | 3 | 233 | 562078 | 4114.6 | 585 | 588 | 136.5 |
| C | 8 | 128 | 6317 | 41.98 | 585 | 588 | 136.5 |
| C | 13 | 61 | 4234 | 26.72 | 585 | 588 | 136.5 |
| D | 2 | 234 | 19626 | 131.62 | 588 | 571 | 144.8 |
| D | 7 | 254 | 17190 | 114.79 | 588 | 571 | 144.8 |
| D | 12 | 4 | 16980 | 113.34 | 588 | 571 | 144.8 |
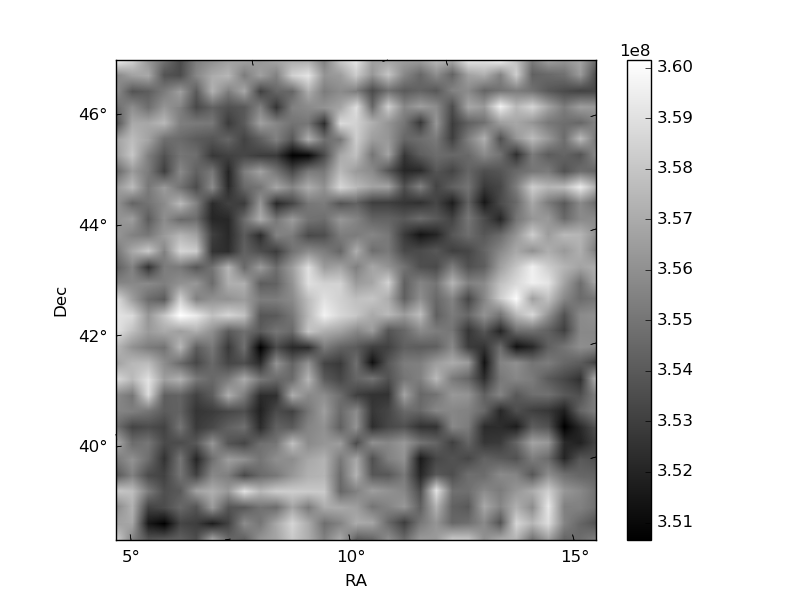
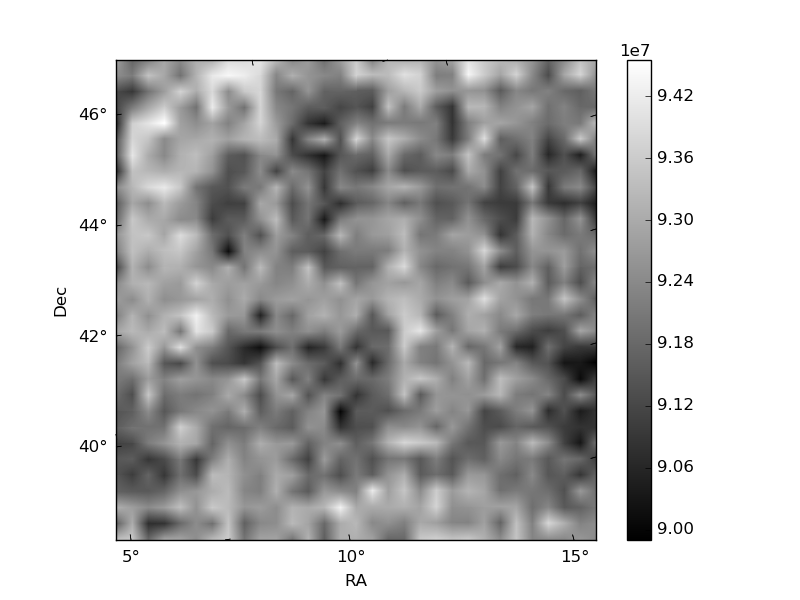
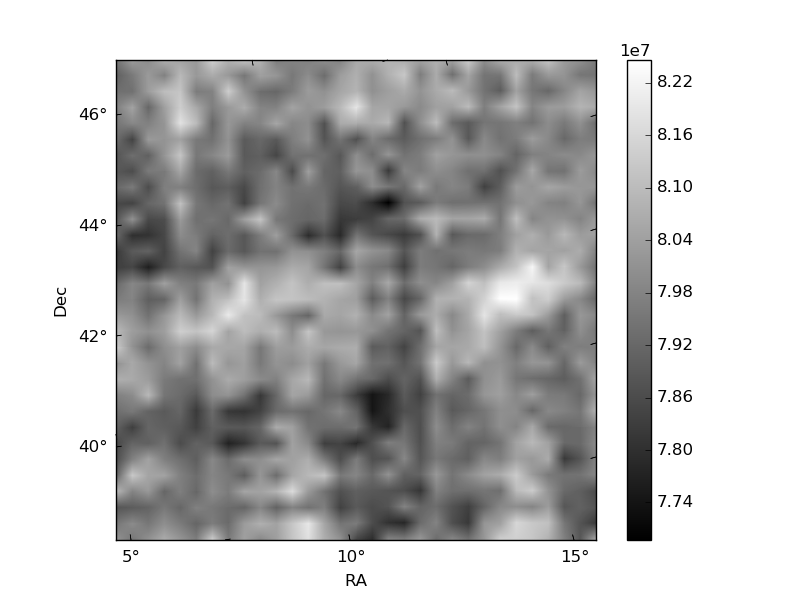
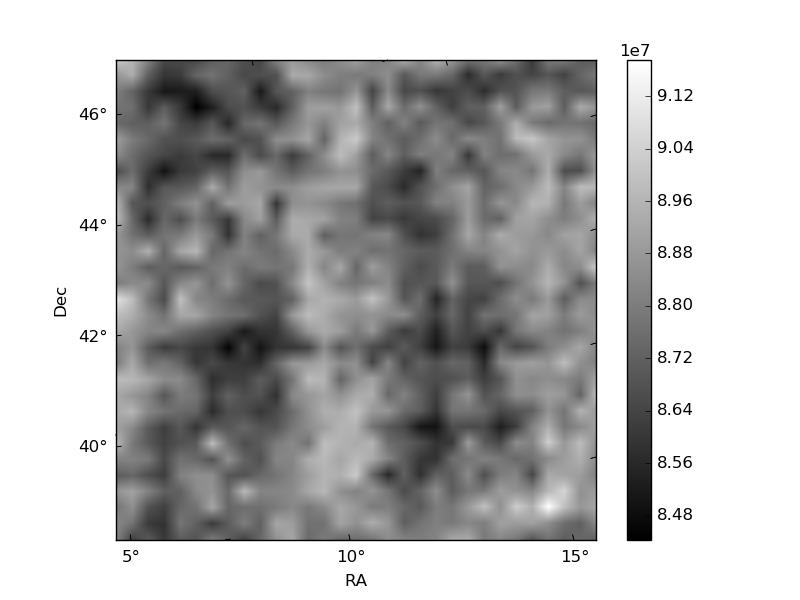
Histogram calculated using DETX and DETY for each event in the final _common_clean file
| Quadrant A |  |
 |
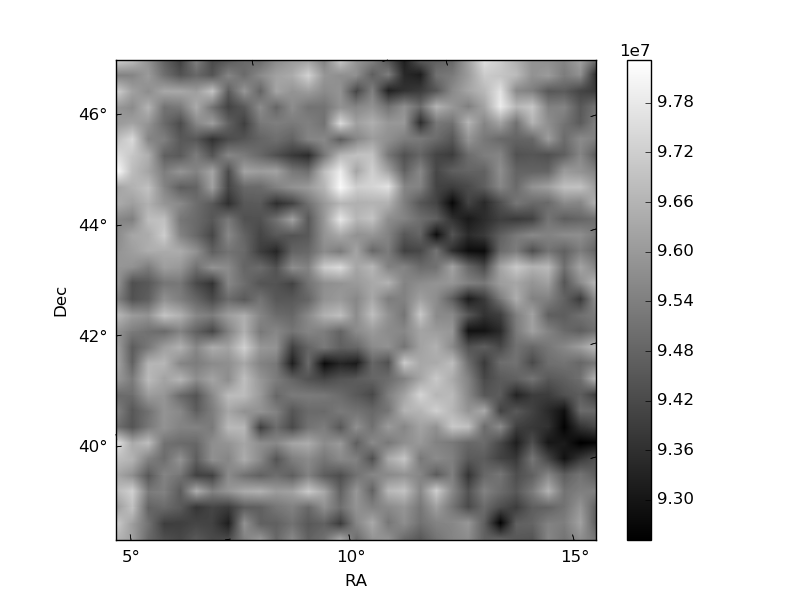
Quadrant B |
|---|---|---|---|
| Quadrant D |  |
 |
Quadrant C |
| Plot type | Count rate plots | Images |
|---|---|---|
| Comparison with Poisson distribution Blue bars denote a histogram of data divided into 1 sec bins. Red curve is a Poisson curve with rate = median count rate of data. |
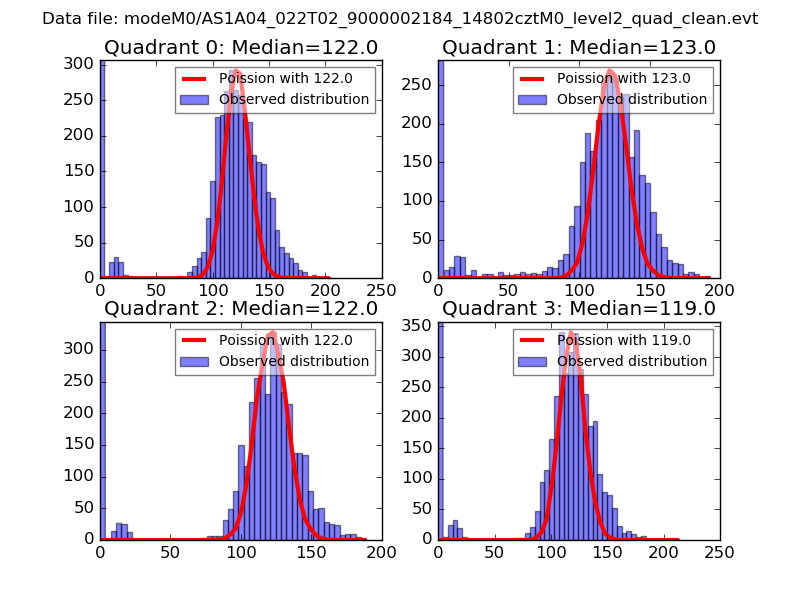 |
 |
| Quadrant-wise count rates Data is divided into 100 sec bins |
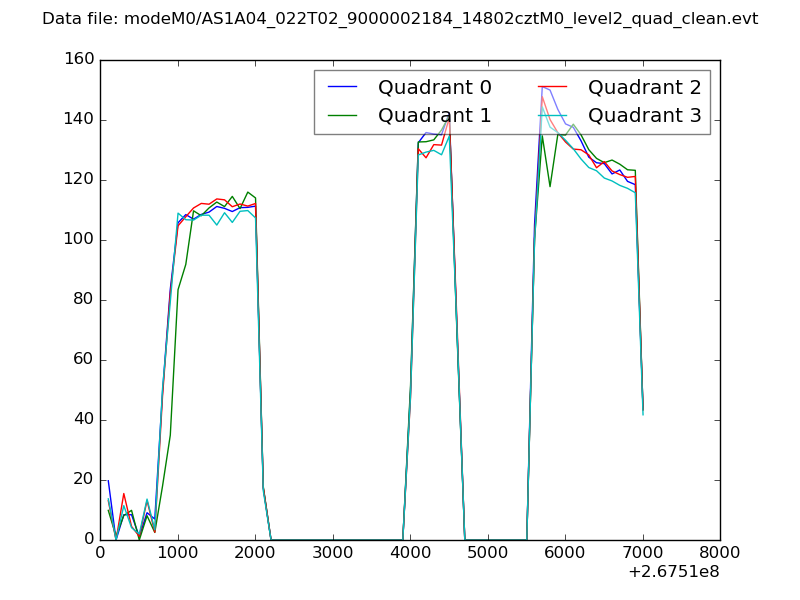 |
|
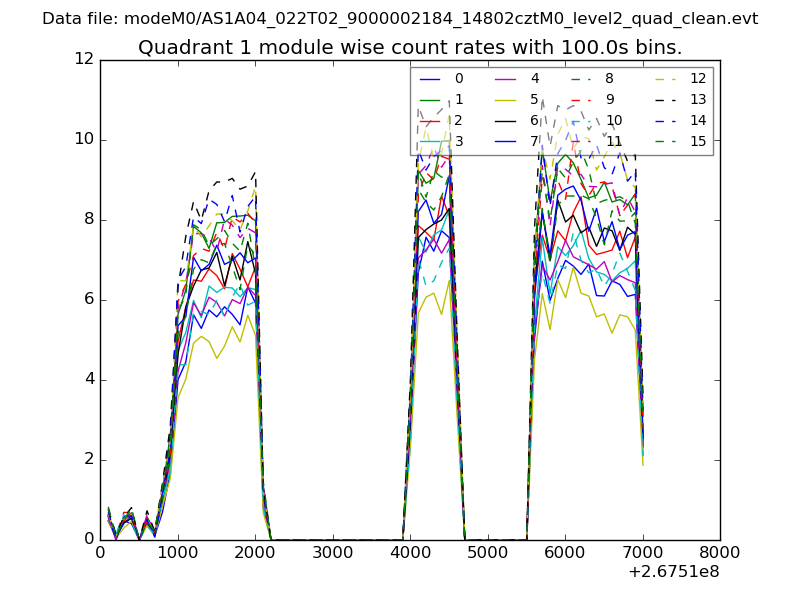
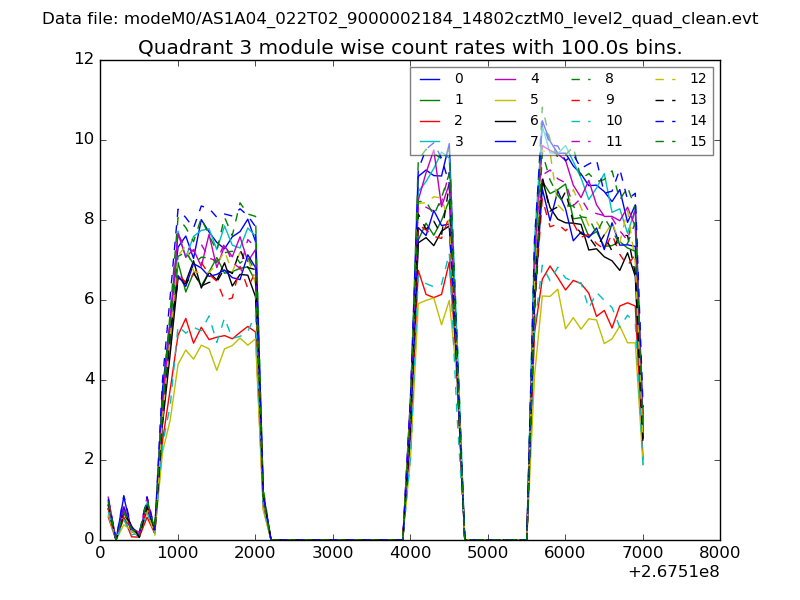
| Module-wise count rates for Quadrant A Data is divided into 100 sec bins |
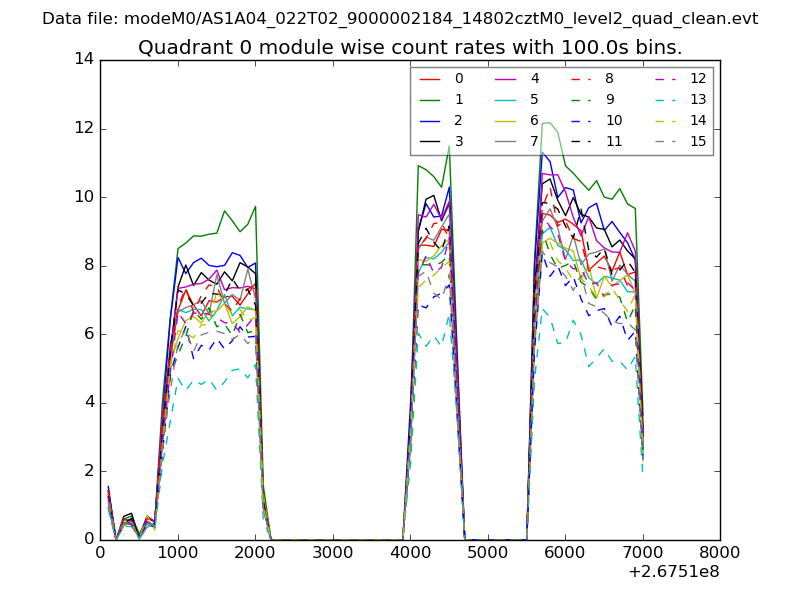 |
 |
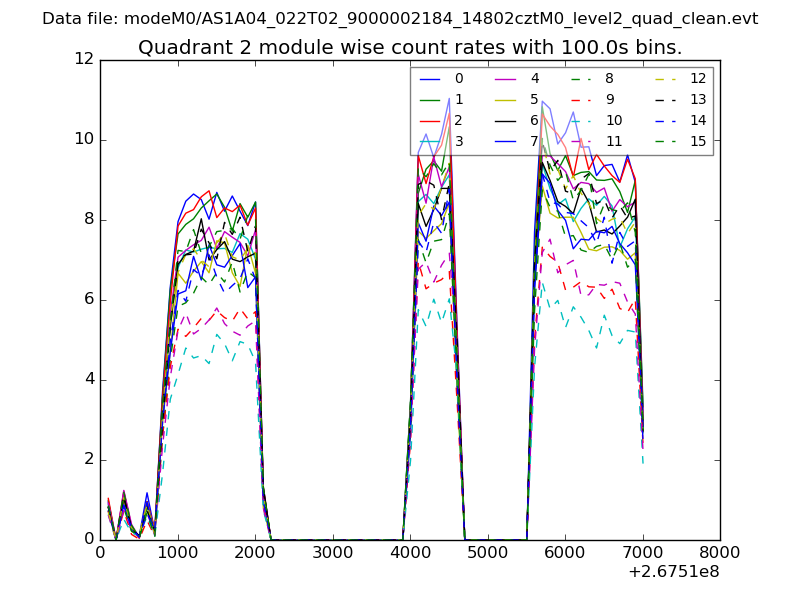
| Module-wise count rates for Quadrant B Data is divided into 100 sec bins |
 |
 |
| Module-wise count rates for Quadrant C Data is divided into 100 sec bins |
 |
 |
| Module-wise count rates for Quadrant D Data is divided into 100 sec bins |
 |
 |
| Parameter | Plot |
|---|---|
| CZT HV Monitor | 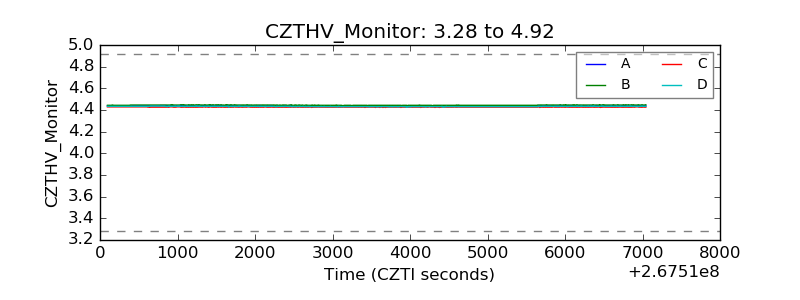 |
| D_VDD | 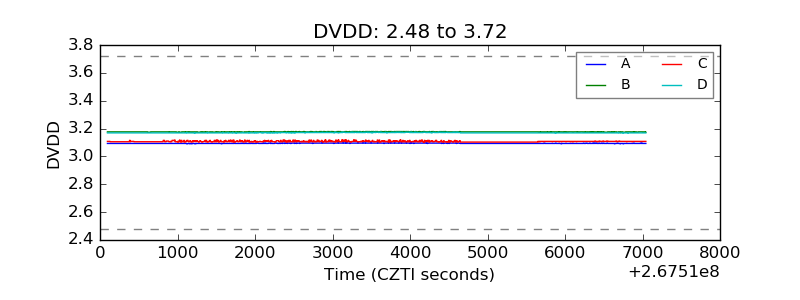 |
| Temperature 1 | 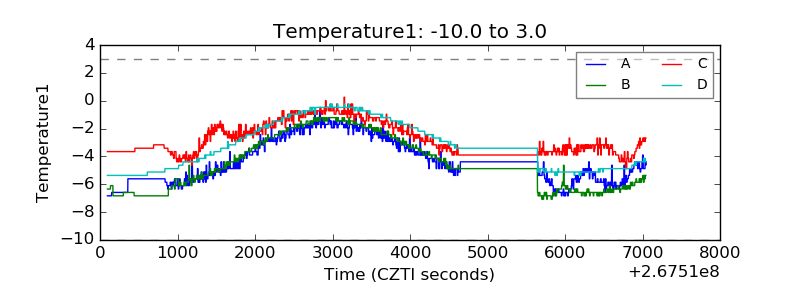 |
| Veto HV Monitor | 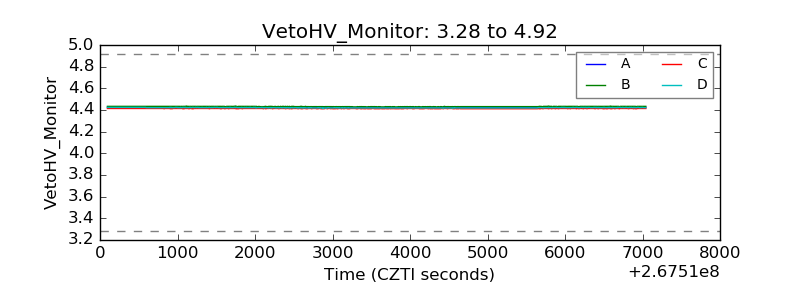 |
| Veto LLD |  |
| Alpha Counter | 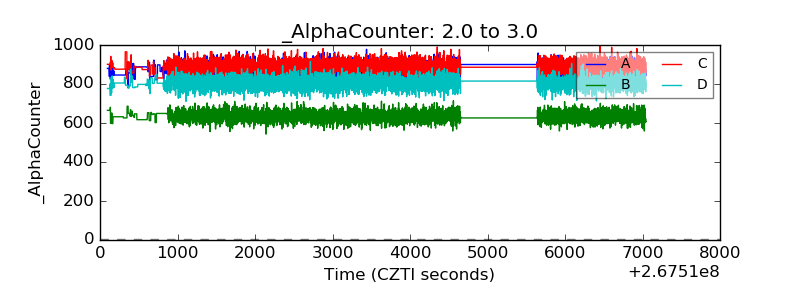 |
| _CPM_Rate | 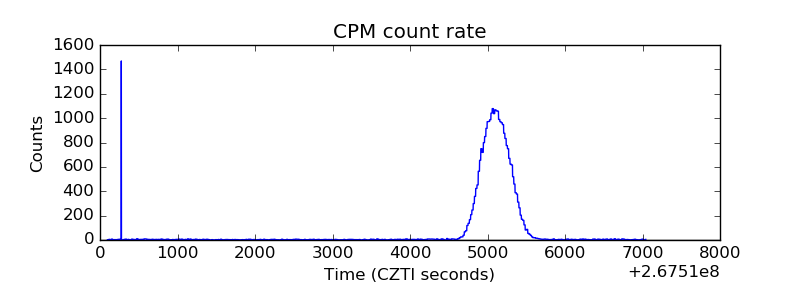 |
| CZT Counter | 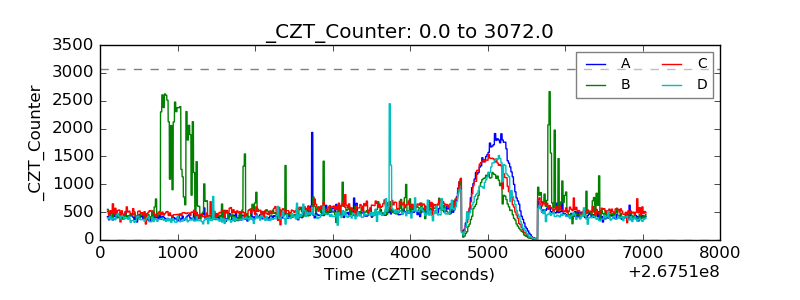 |
| +2.5 Volts monitor |  |
| +5 Volts monitor |  |
| _ROLL_ROT | 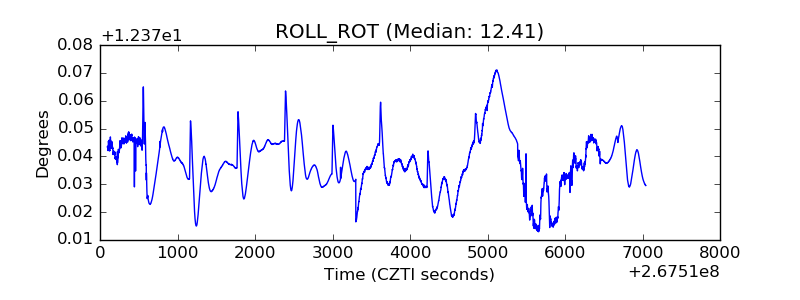 |
| _Roll_DEC | 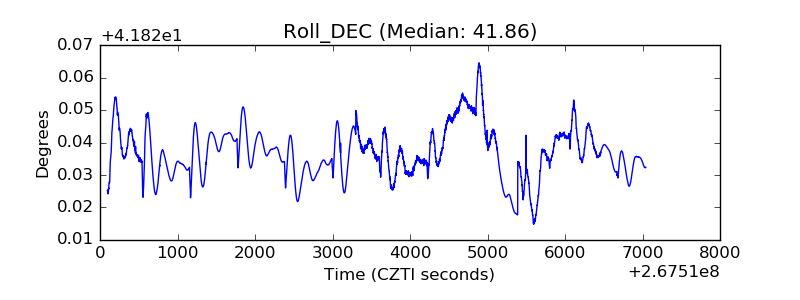 |
| _Roll_RA | 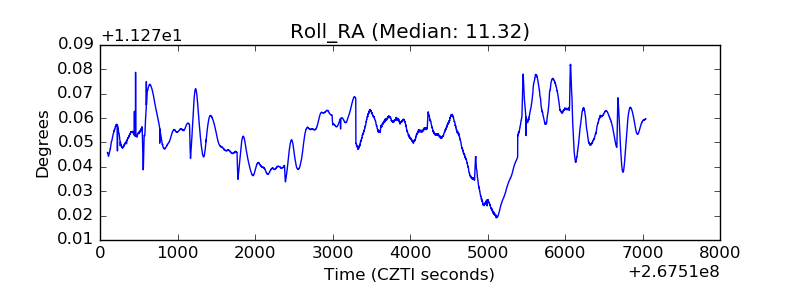 |
| Veto Counter | 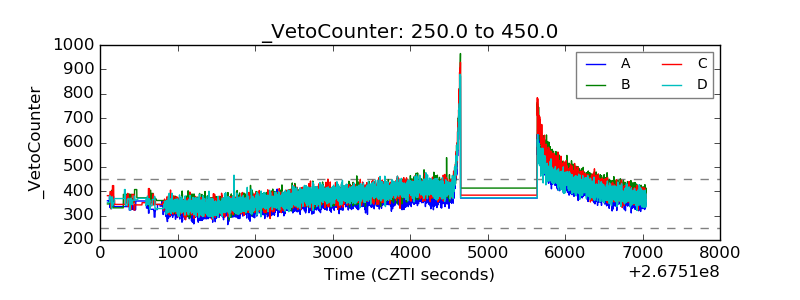 |