| Param | Original file | Final file |
|---|---|---|
| Filename | modeM0/AS1A04_022T02_9000002184_14803cztM0_level2.evt | modeM0/AS1A04_022T02_9000002184_14803cztM0_level2_quad_clean.evt |
| Size (bytes) | 95,791,680 | 28,823,040 |
| Size | 91.4 MB | 27.5 MB |
| Events in quadrant A | 688,373 | 196,106 |
| Events in quadrant B | 723,763 | 196,617 |
| Events in quadrant C | 758,612 | 190,929 |
| Events in quadrant D | 635,677 | 188,032 |
| Mode M0 | |||
|---|---|---|---|
| Quadrant | BADHDUFLAG | Total packets | Discarded packets |
| A | 0 | 2869 | 19 |
| B | 0 | 2993 | 8 |
| C | 0 | 3078 | 5 |
| D | 0 | 2807 | 6 |
| Mode M9 | |||
|---|---|---|---|
| Quadrant | BADHDUFLAG | Total packets | Discarded packets |
| A | 0 | 11 | 8 |
| B | 0 | 10 | 5 |
| C | 0 | 11 | 6 |
| D | 0 | 10 | 6 |
| Mode SS | |||
|---|---|---|---|
| Quadrant | BADHDUFLAG | Total packets | Discarded packets |
| A | 0 | 27 | 1 |
| B | 0 | 28 | 2 |
| C | 0 | 27 | 1 |
| D | 0 | 28 | 2 |
| Quadrant | Total seconds | Saturated seconds | Saturation percentage |
|---|---|---|---|
| A | 1347 | 5 | 0.371195% |
| B | 1353 | 19 | 1.404287% |
| C | 1352 | 1 | 0.073964% |
| D | 1351 | 4 | 0.296077% |
Noise dominated data is calculated using 1-second bins in cleaned event files. If a bin has >2000 counts, and if more than 50% of those come from <1% of pixels, then it is considered to be noise-dominated and hence unusable.
| Quadrant | # 1 sec bins | Bins with >0 counts | Bins with >2000 counts | High rate bins dominated by noise | Noise dominated (total time) | Noise dominated (detector-on time) | Marked lightcurve |
|---|---|---|---|---|---|---|---|
| A | 1355 | 1353 | 1 | 1 | 0.07% | 0.07% | 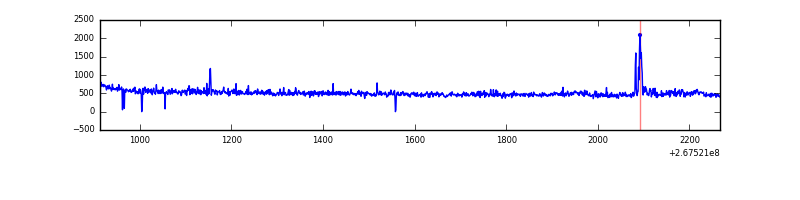 |
| B | 1355 | 1355 | 10 | 10 | 0.74% | 0.74% | 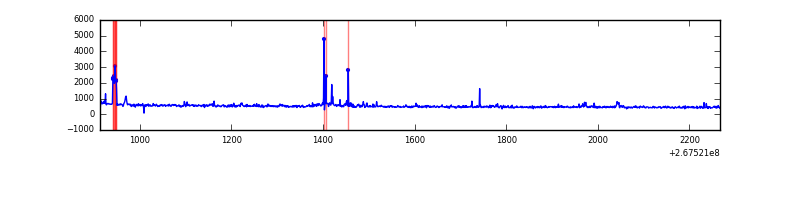 |
| C | 1355 | 1355 | 0 | 0 | 0.00% | 0.00% | 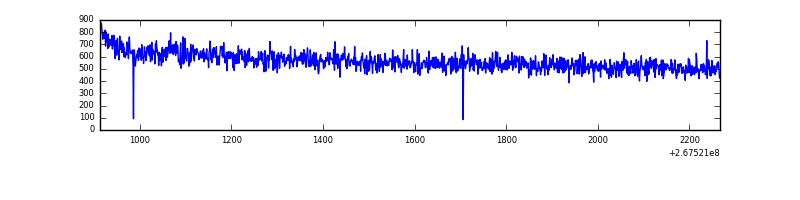 |
| D | 1355 | 1354 | 2 | 2 | 0.15% | 0.15% | 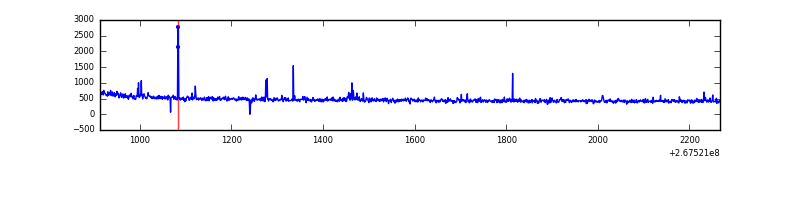 |
Top three noisy pixels from each quadrant. If the there are fewer than three noisy pixels in the level2.evt file, extra rows are filled as -1
| Pixel properties | Quadrant properties | ||||||
|---|---|---|---|---|---|---|---|
| Quadrant | DetID | PixID | Counts | Sigma | Mean | Median | Sigma |
| A | 4 | 2 | 15291 | 419.39 | 171 | 168 | 36.1 |
| A | 12 | 189 | 10083 | 274.96 | 171 | 168 | 36.1 |
| A | 7 | 32 | 2175 | 55.66 | 171 | 168 | 36.1 |
| B | 10 | 16 | 37523 | 1106.38 | 169 | 165 | 33.8 |
| B | 0 | 214 | 10916 | 318.4 | 169 | 165 | 33.8 |
| B | 3 | 64 | 8707 | 252.98 | 169 | 165 | 33.8 |
| C | 3 | 233 | 120095 | 3082.52 | 162 | 163 | 38.9 |
| C | 8 | 128 | 3387 | 82.86 | 162 | 163 | 38.9 |
| C | 8 | 112 | 1767 | 41.23 | 162 | 163 | 38.9 |
| D | 13 | 249 | 9399 | 231.99 | 161 | 157 | 39.8 |
| D | 10 | 70 | 8475 | 208.8 | 161 | 157 | 39.8 |
| D | 2 | 234 | 4319 | 104.47 | 161 | 157 | 39.8 |
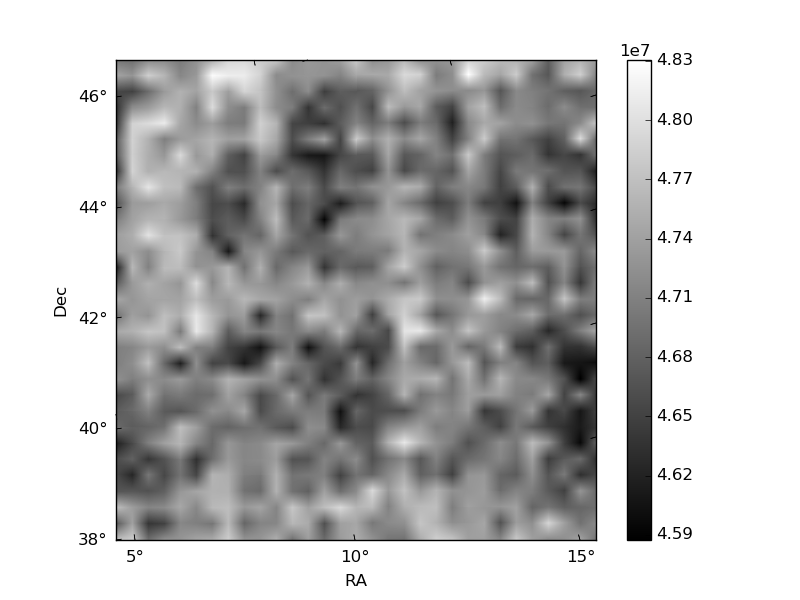
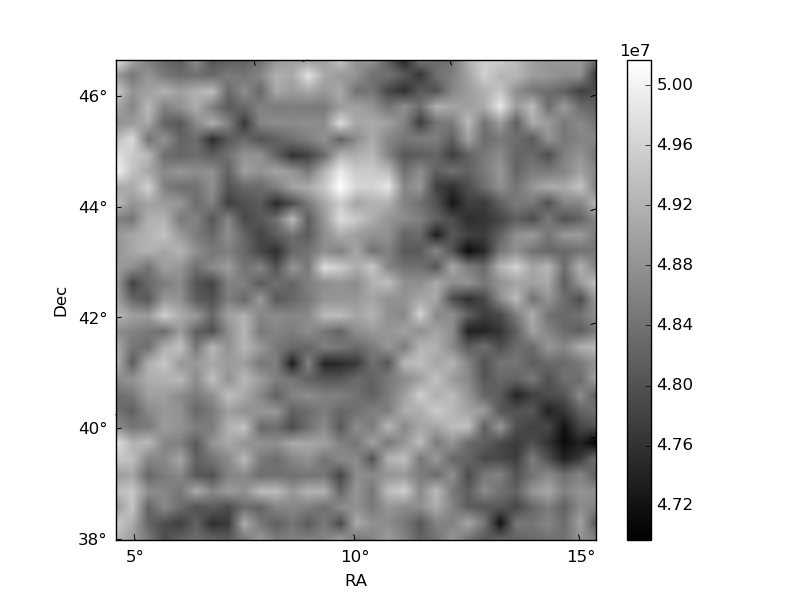
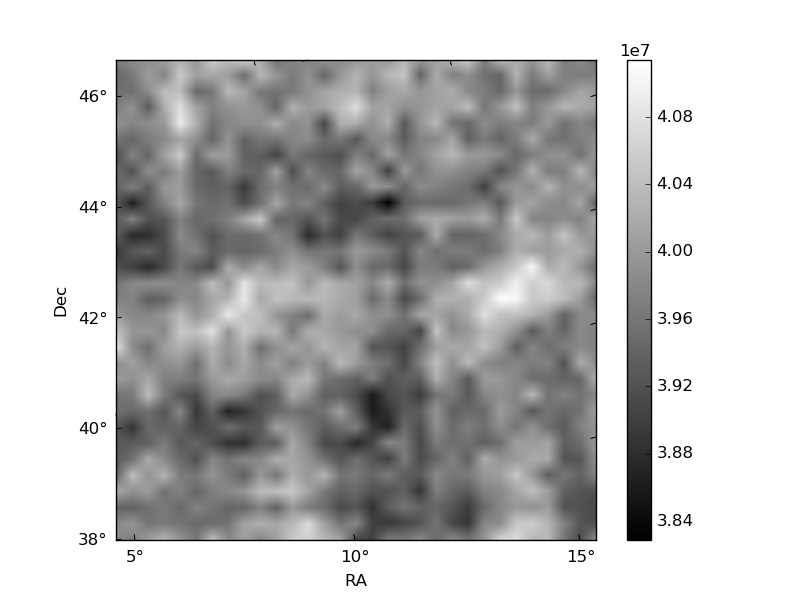
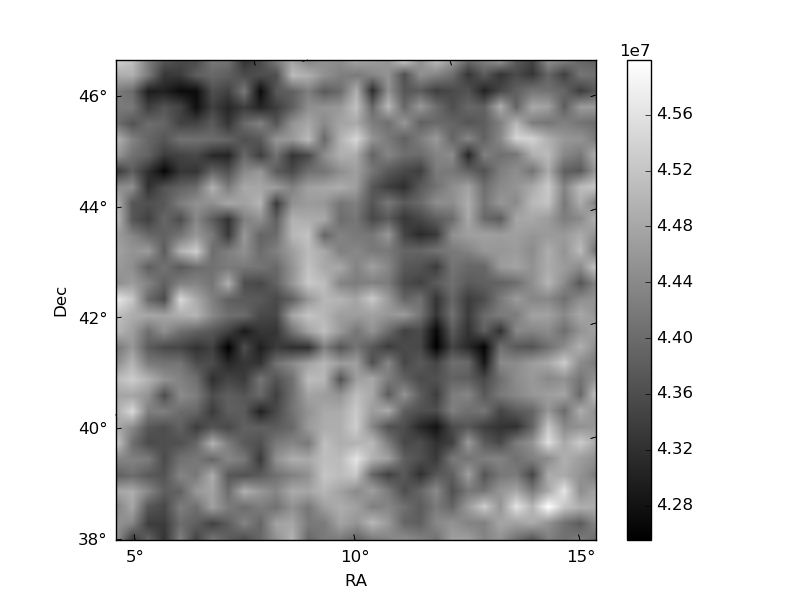
Histogram calculated using DETX and DETY for each event in the final _common_clean file
| Quadrant A | 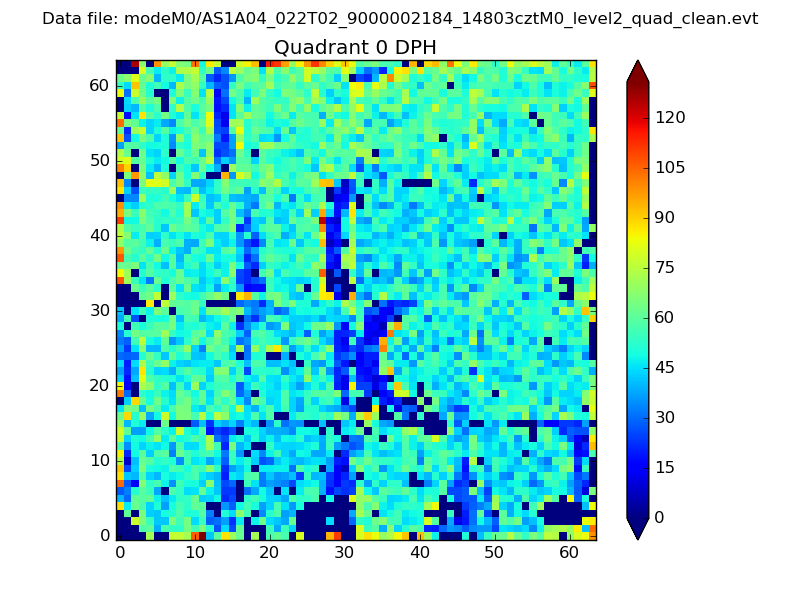 |
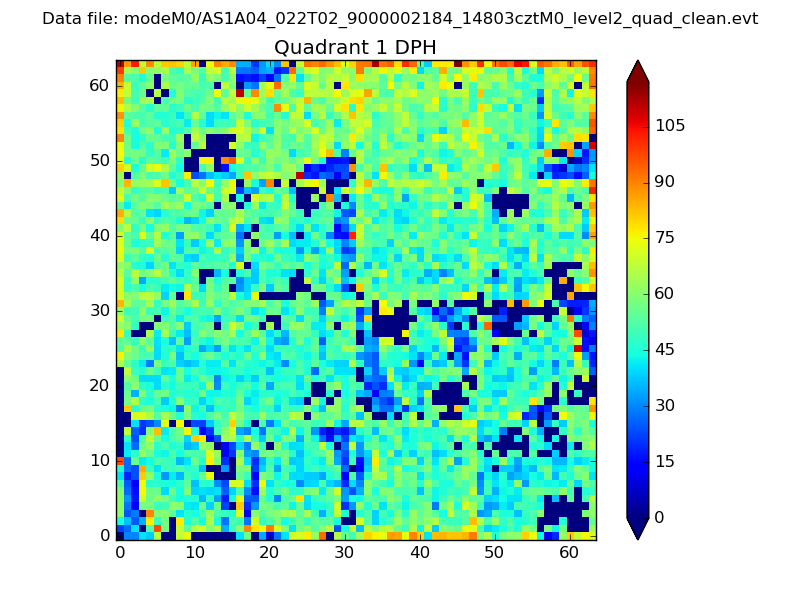 |
Quadrant B |
|---|---|---|---|
| Quadrant D | 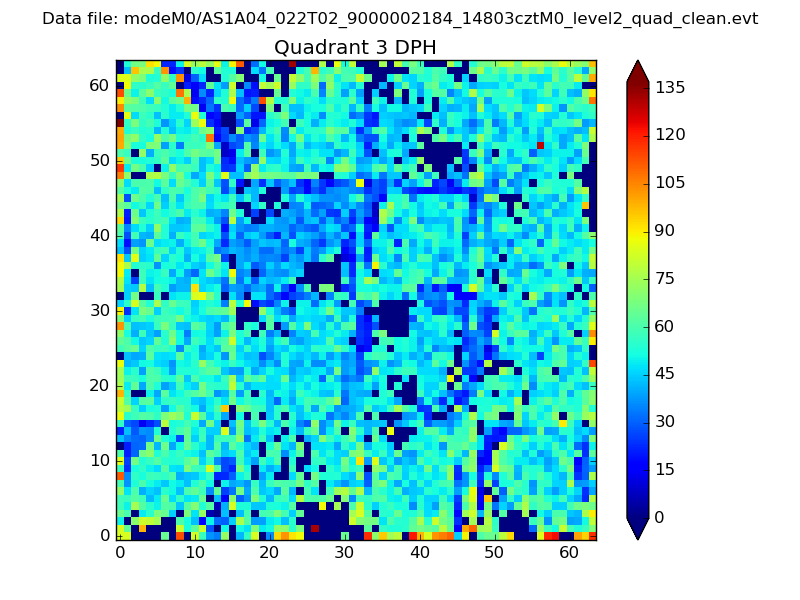 |
 |
Quadrant C |
| Plot type | Count rate plots | Images |
|---|---|---|
| Comparison with Poisson distribution Blue bars denote a histogram of data divided into 1 sec bins. Red curve is a Poisson curve with rate = median count rate of data. |
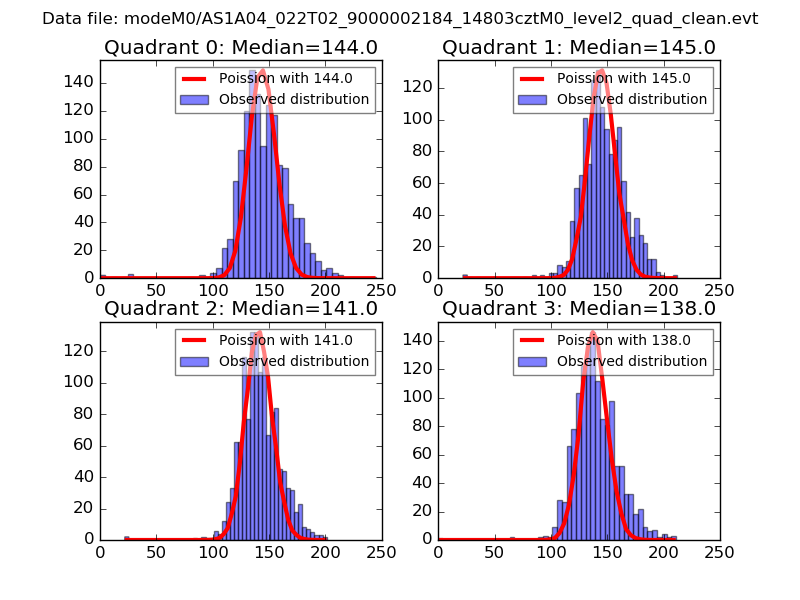 |
 |
| Quadrant-wise count rates Data is divided into 100 sec bins |
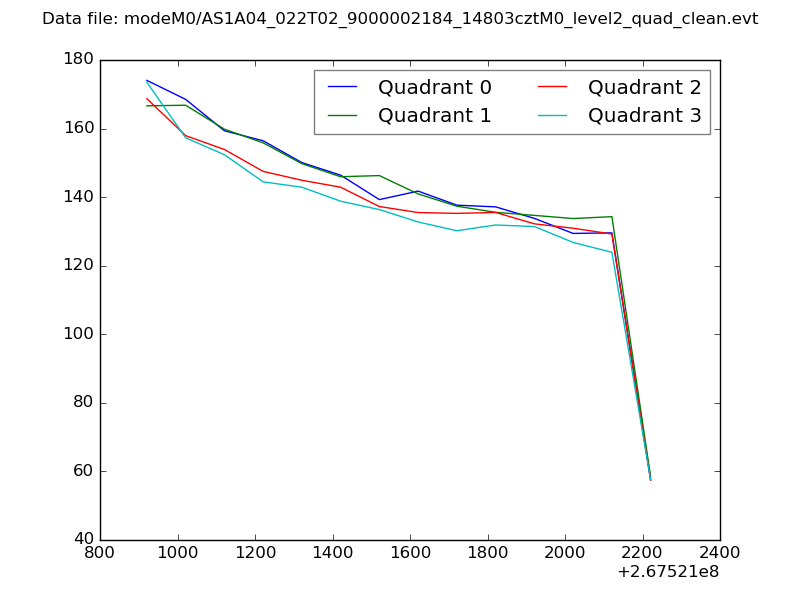 |
|
| Module-wise count rates for Quadrant A Data is divided into 100 sec bins |
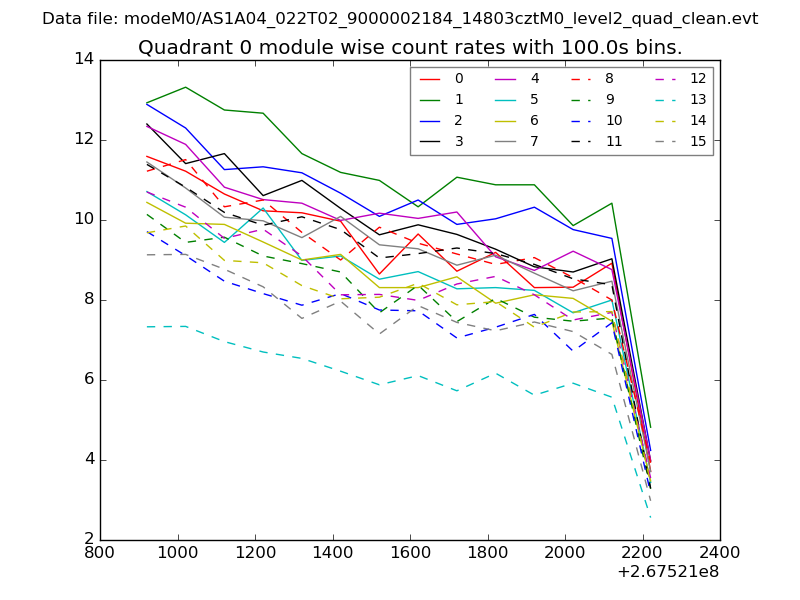 |
 |
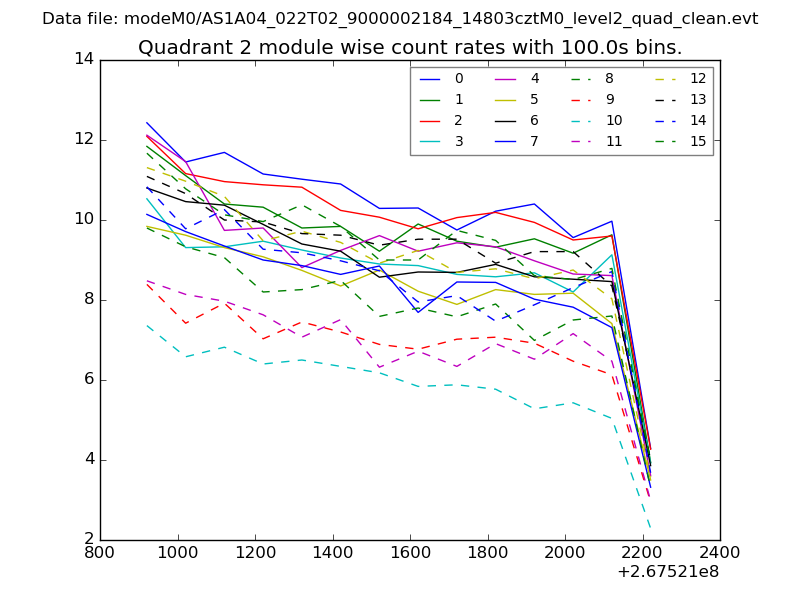
| Module-wise count rates for Quadrant B Data is divided into 100 sec bins |
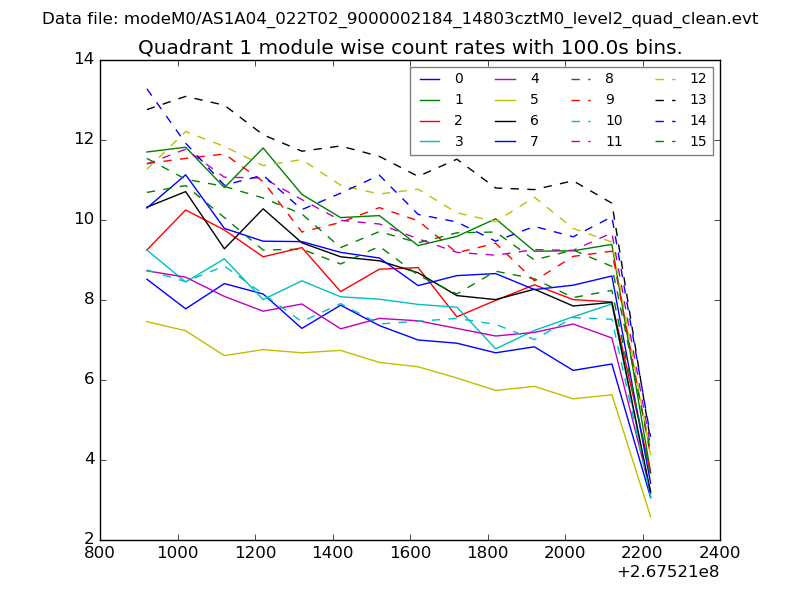 |
 |
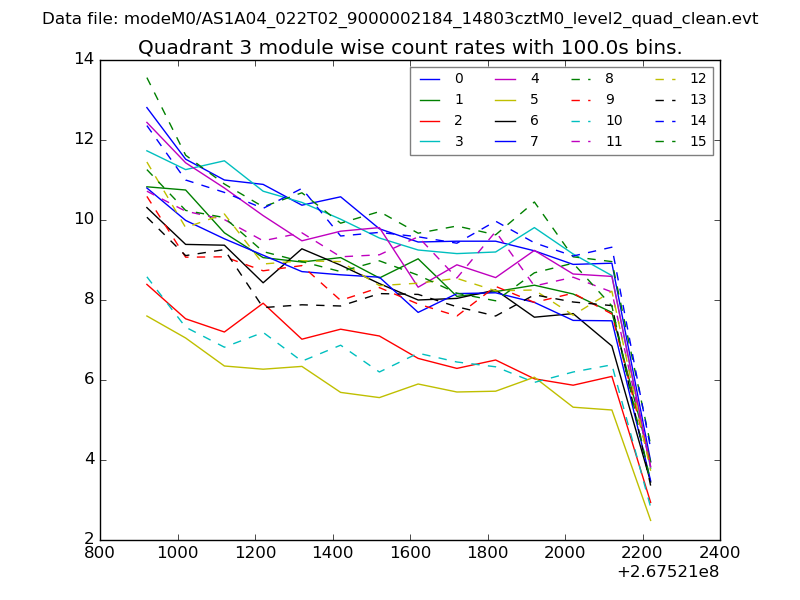
| Module-wise count rates for Quadrant C Data is divided into 100 sec bins |
 |
 |
| Module-wise count rates for Quadrant D Data is divided into 100 sec bins |
 |
 |
| Parameter | Plot |
|---|---|
| CZT HV Monitor | 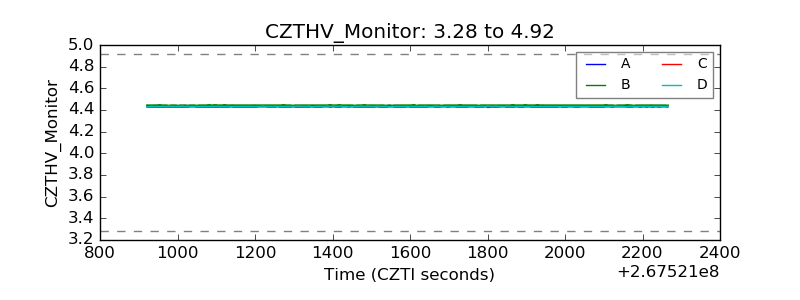 |
| D_VDD | 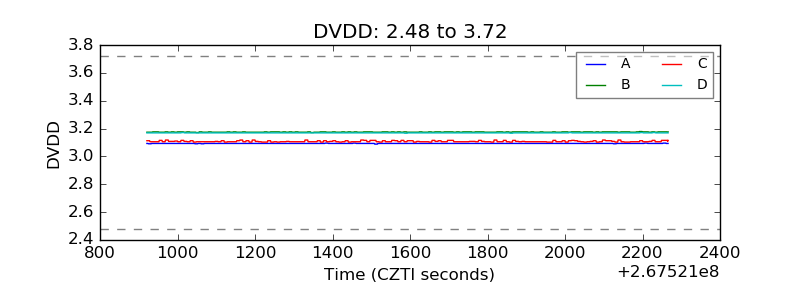 |
| Temperature 1 | 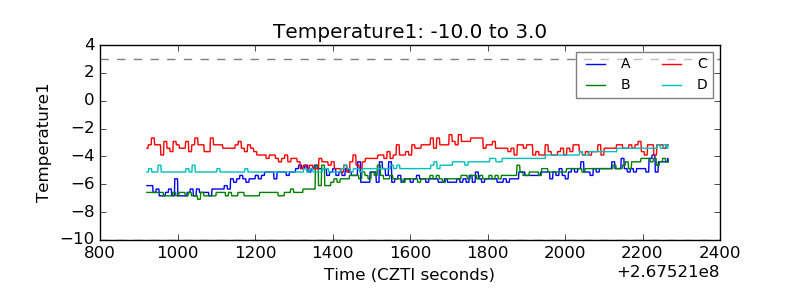 |
| Veto HV Monitor | 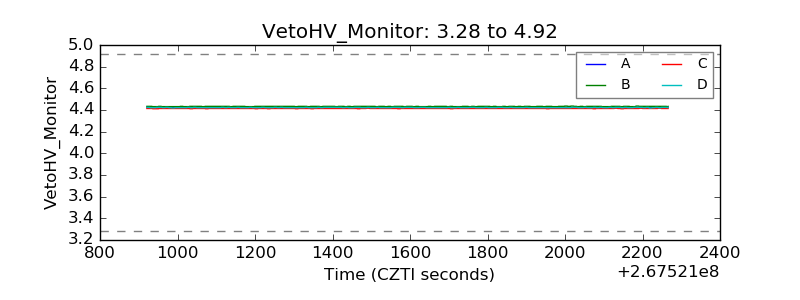 |
| Veto LLD | 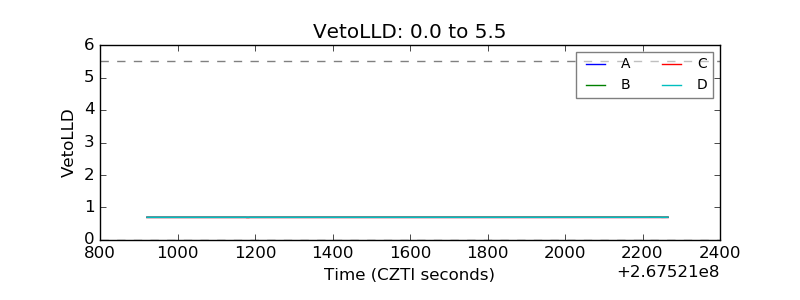 |
| Alpha Counter | 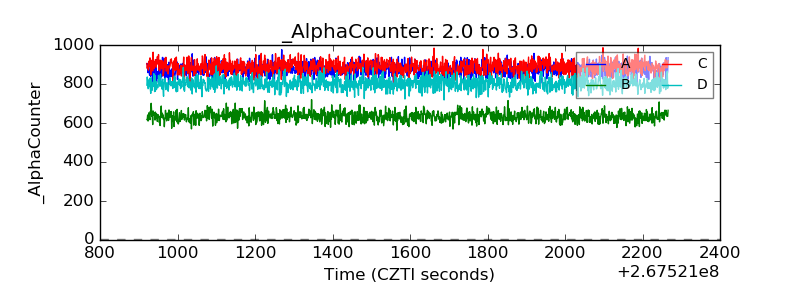 |
| _CPM_Rate | 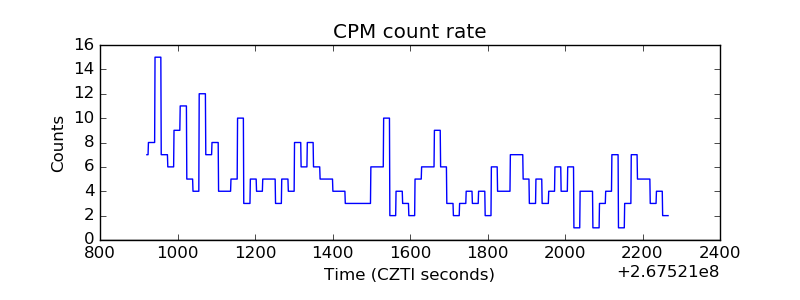 |
| CZT Counter | 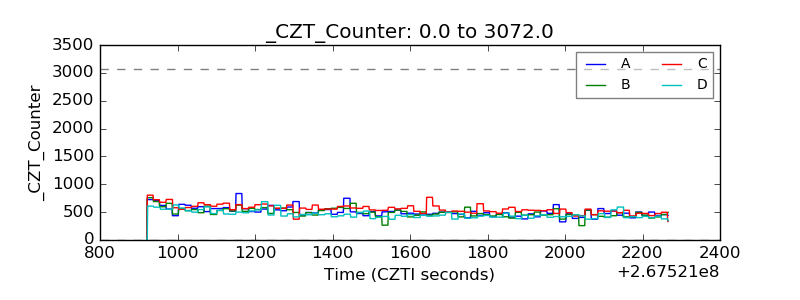 |
| +2.5 Volts monitor |  |
| +5 Volts monitor |  |
| _ROLL_ROT | 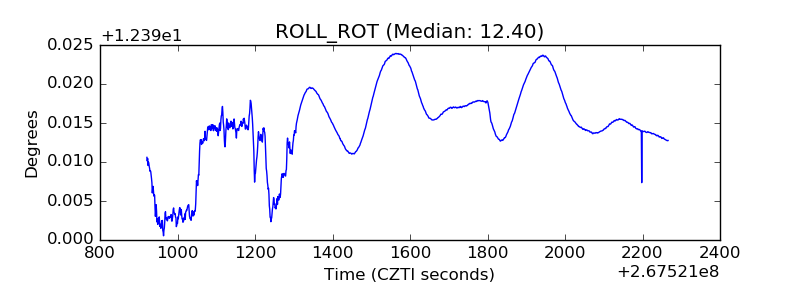 |
| _Roll_DEC | 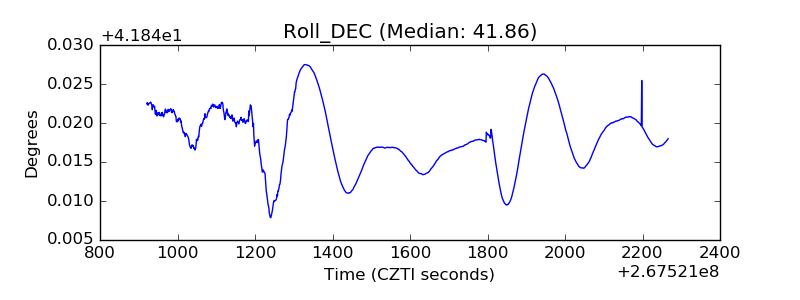 |
| _Roll_RA | 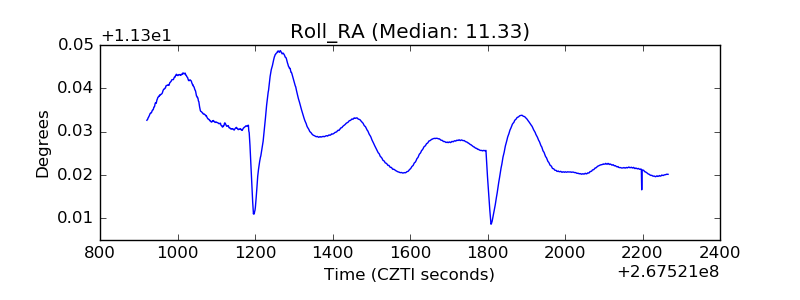 |
| Veto Counter | 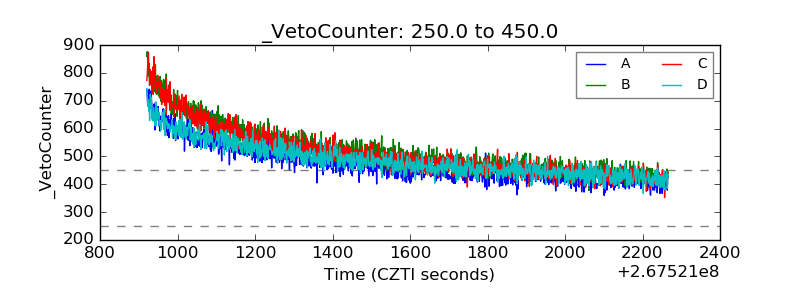 |