| Param | Original file | Final file |
|---|---|---|
| Filename | modeM0/AS1A04_022T02_9000002184_14805cztM0_level2.evt | modeM0/AS1A04_022T02_9000002184_14805cztM0_level2_quad_clean.evt |
| Size (bytes) | 1,280,217,600 | 202,124,160 |
| Size | 1.2 GB | 192.8 MB |
| Events in quadrant A | 7,672,589 | 1,308,124 |
| Events in quadrant B | 13,586,173 | 1,191,295 |
| Events in quadrant C | 8,913,091 | 1,284,823 |
| Events in quadrant D | 7,541,362 | 1,255,871 |
| Mode M0 | |||
|---|---|---|---|
| Quadrant | BADHDUFLAG | Total packets | Discarded packets |
| A | 0 | 32801 | 4 |
| B | 0 | 50556 | 3 |
| C | 0 | 36248 | 3 |
| D | 0 | 33368 | 3 |
| Mode M9 | |||
|---|---|---|---|
| Quadrant | BADHDUFLAG | Total packets | Discarded packets |
| A | 0 | 33 | 0 |
| B | 0 | 33 | 0 |
| C | 0 | 33 | 0 |
| D | 0 | 33 | 0 |
| Mode SS | |||
|---|---|---|---|
| Quadrant | BADHDUFLAG | Total packets | Discarded packets |
| A | 0 | 320 | 0 |
| B | 0 | 320 | 0 |
| C | 0 | 320 | 0 |
| D | 0 | 320 | 0 |
| Quadrant | Total seconds | Saturated seconds | Saturation percentage |
|---|---|---|---|
| A | 15666 | 116 | 0.740457% |
| B | 15666 | 2389 | 15.249585% |
| C | 15666 | 123 | 0.785140% |
| D | 15666 | 138 | 0.880889% |
Noise dominated data is calculated using 1-second bins in cleaned event files. If a bin has >2000 counts, and if more than 50% of those come from <1% of pixels, then it is considered to be noise-dominated and hence unusable.
| Quadrant | # 1 sec bins | Bins with >0 counts | Bins with >2000 counts | High rate bins dominated by noise | Noise dominated (total time) | Noise dominated (detector-on time) | Marked lightcurve |
|---|---|---|---|---|---|---|---|
| A | 18992 | 15670 | 13 | 13 | 0.07% | 0.08% | 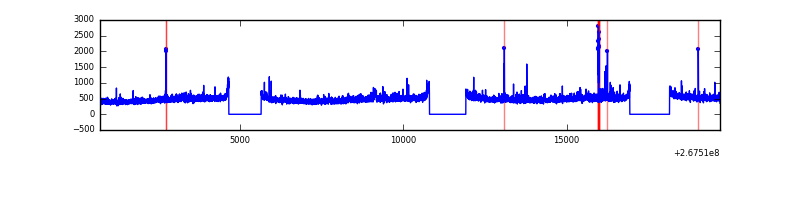 |
| B | 18992 | 15669 | 1941 | 1941 | 10.22% | 12.39% | 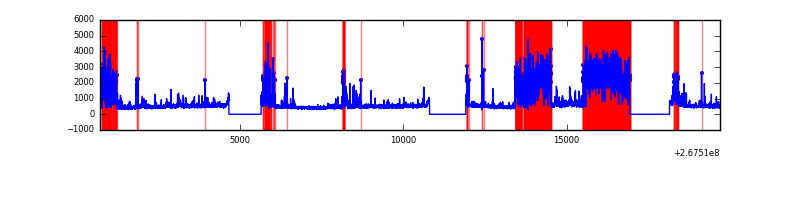 |
| C | 18992 | 15670 | 40 | 40 | 0.21% | 0.26% | 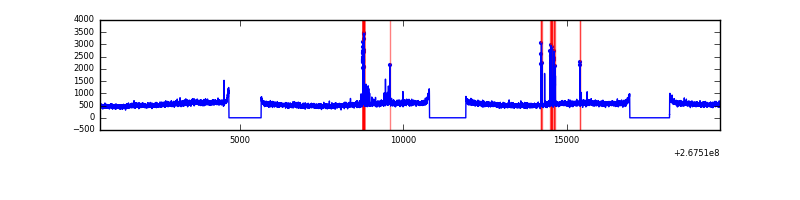 |
| D | 18992 | 15670 | 67 | 67 | 0.35% | 0.43% | 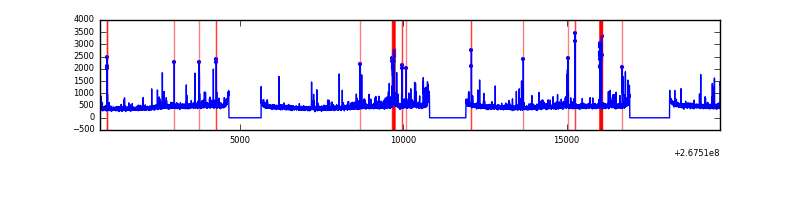 |
Top three noisy pixels from each quadrant. If the there are fewer than three noisy pixels in the level2.evt file, extra rows are filled as -1
| Pixel properties | Quadrant properties | ||||||
|---|---|---|---|---|---|---|---|
| Quadrant | DetID | PixID | Counts | Sigma | Mean | Median | Sigma |
| A | 12 | 189 | 242080 | 633.69 | 1899 | 1862 | 379.1 |
| A | 4 | 2 | 84383 | 217.69 | 1899 | 1862 | 379.1 |
| A | 15 | 223 | 21561 | 51.97 | 1899 | 1862 | 379.1 |
| B | 10 | 16 | 6386776 | 19727.8 | 1730 | 1693 | 323.7 |
| B | 3 | 64 | 109084 | 331.8 | 1730 | 1693 | 323.7 |
| B | 0 | 219 | 77012 | 232.71 | 1730 | 1693 | 323.7 |
| C | 3 | 233 | 1608371 | 3893.09 | 1806 | 1815 | 412.7 |
| C | 0 | 207 | 223737 | 537.77 | 1806 | 1815 | 412.7 |
| C | 8 | 128 | 16571 | 35.76 | 1806 | 1815 | 412.7 |
| D | 7 | 254 | 125471 | 285.15 | 1823 | 1775 | 433.8 |
| D | 15 | 0 | 121341 | 275.63 | 1823 | 1775 | 433.8 |
| D | 12 | 110 | 84546 | 190.81 | 1823 | 1775 | 433.8 |
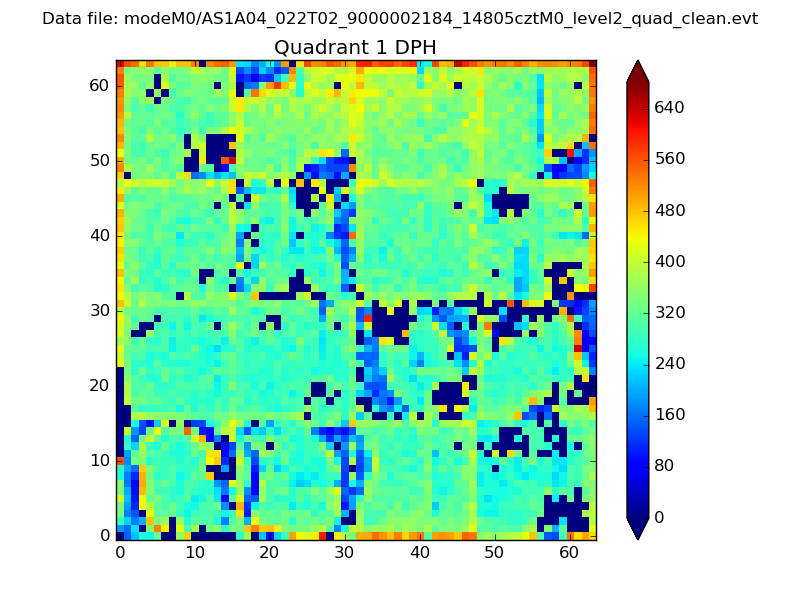
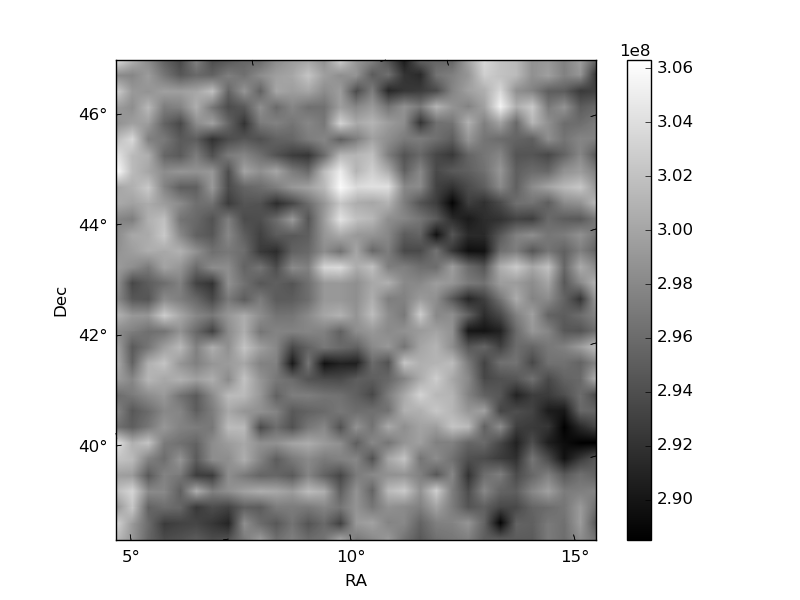
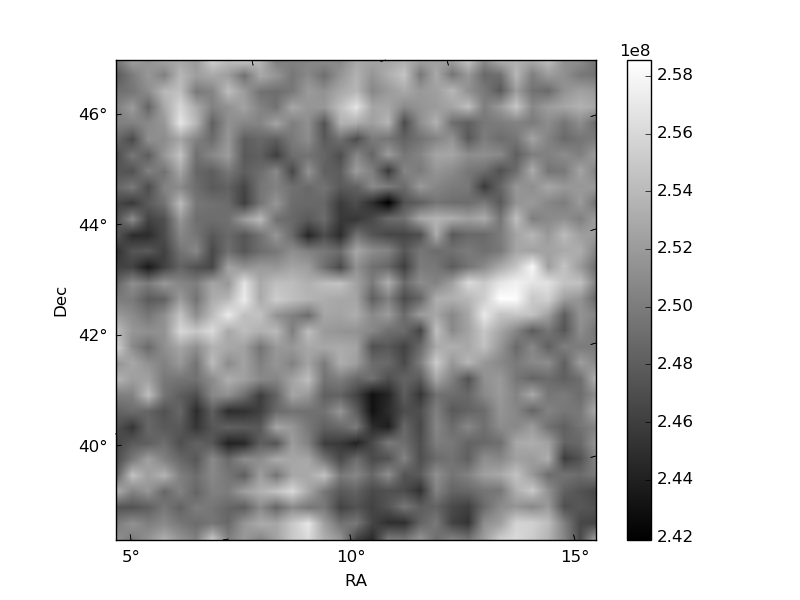
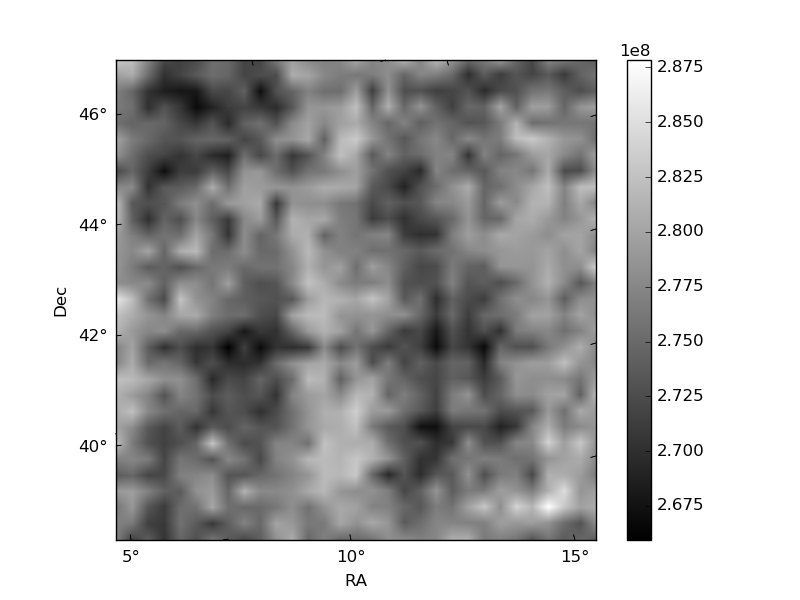
Histogram calculated using DETX and DETY for each event in the final _common_clean file
| Quadrant A |  |
 |
Quadrant B |
|---|---|---|---|
| Quadrant D | 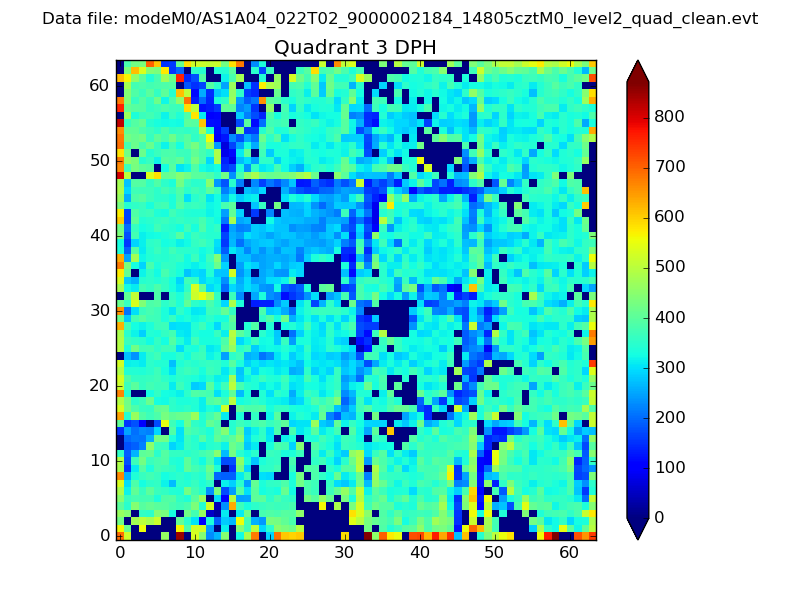 |
 |
Quadrant C |
| Plot type | Count rate plots | Images |
|---|---|---|
| Comparison with Poisson distribution Blue bars denote a histogram of data divided into 1 sec bins. Red curve is a Poisson curve with rate = median count rate of data. |
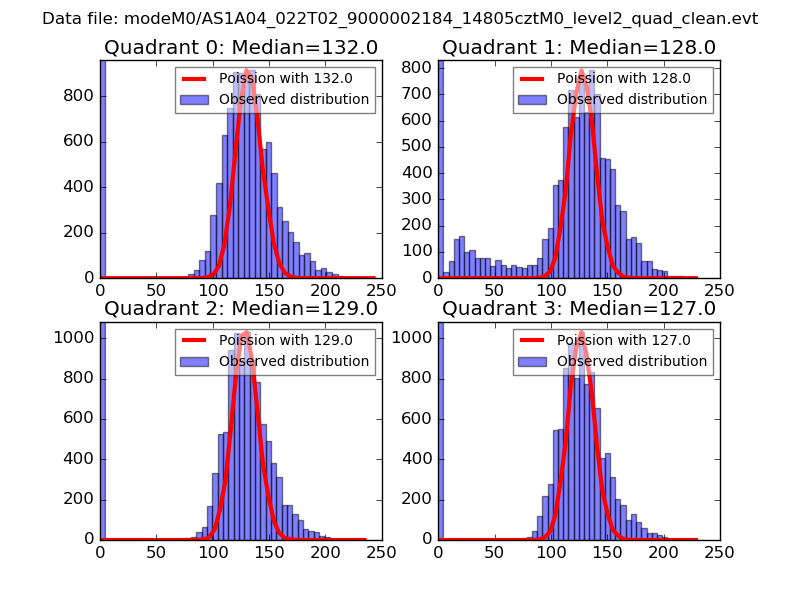 |
 |
| Quadrant-wise count rates Data is divided into 100 sec bins |
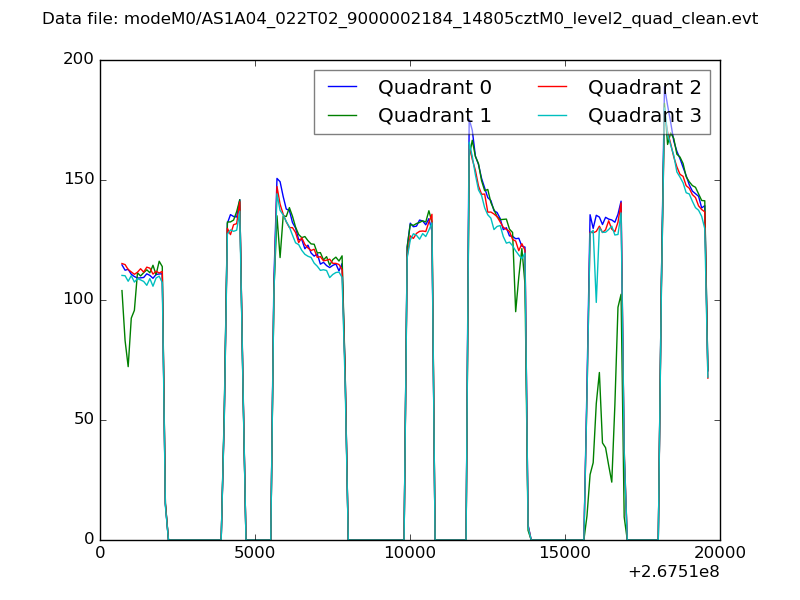 |
|
| Module-wise count rates for Quadrant A Data is divided into 100 sec bins |
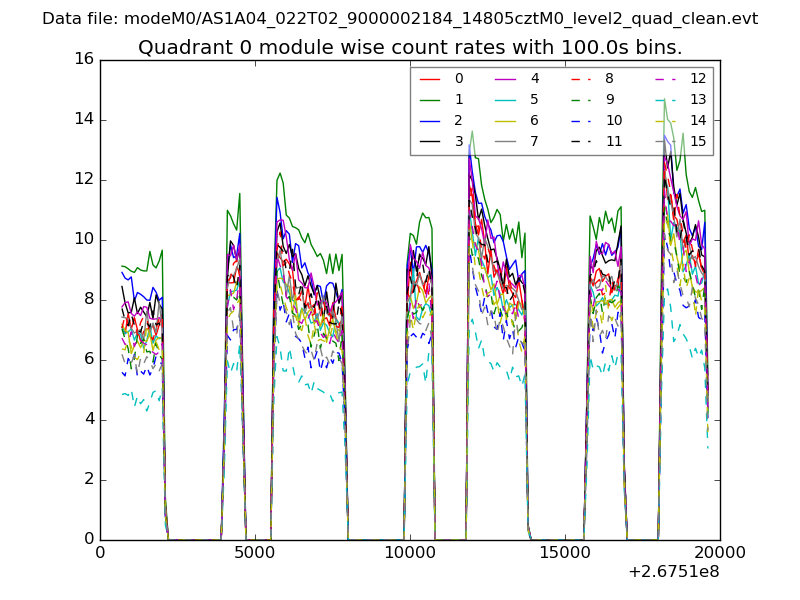 |
 |
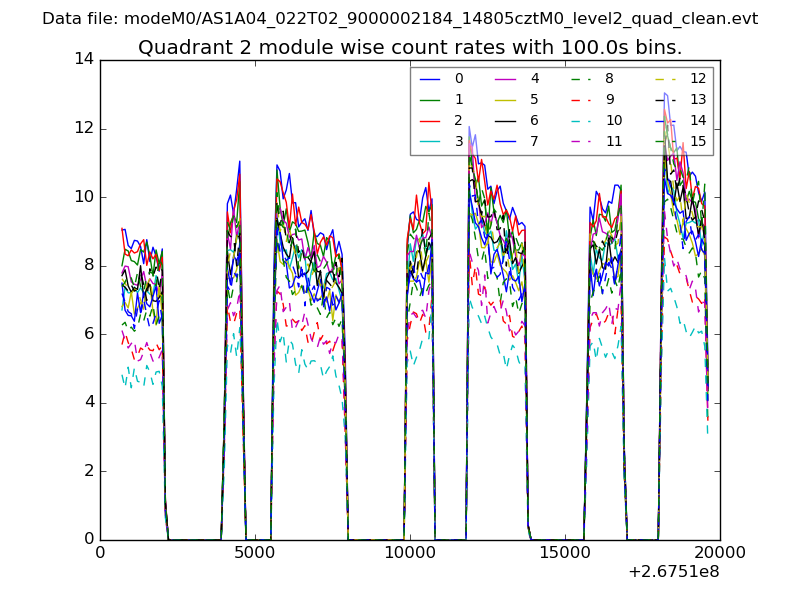
| Module-wise count rates for Quadrant B Data is divided into 100 sec bins |
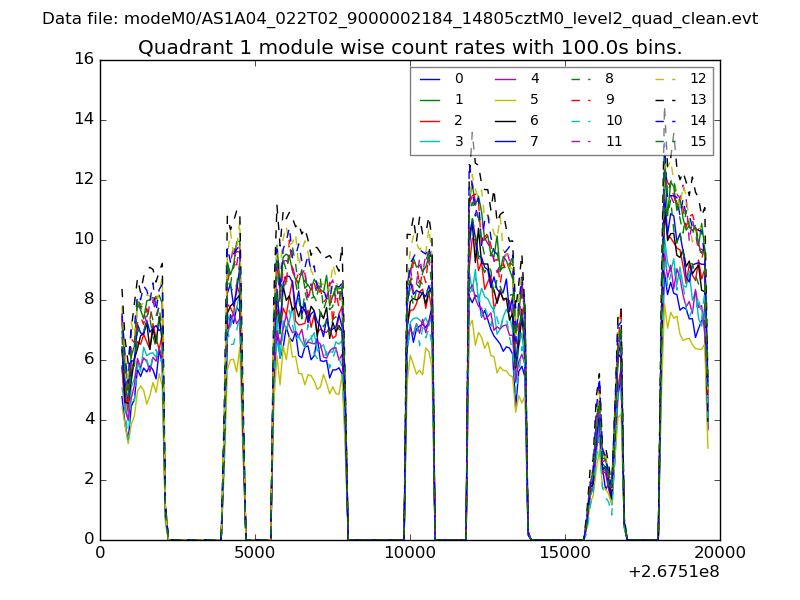 |
 |
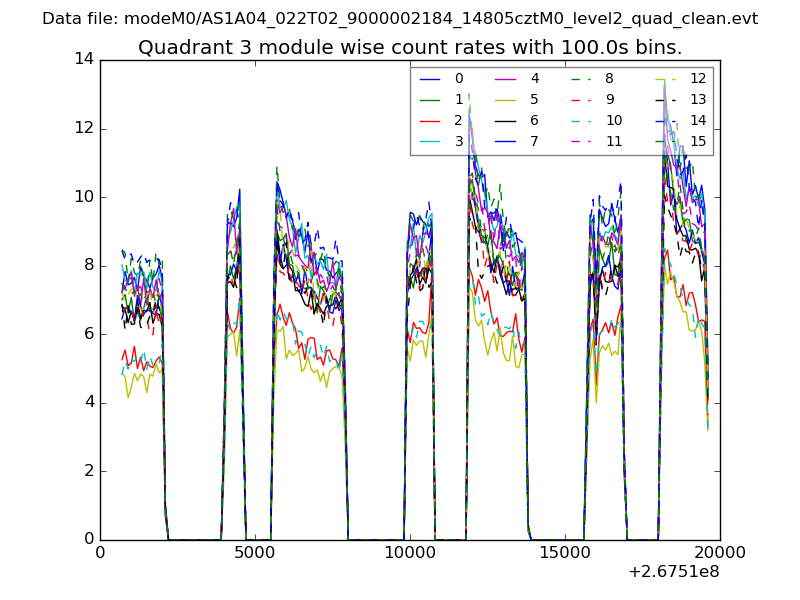
| Module-wise count rates for Quadrant C Data is divided into 100 sec bins |
 |
 |
| Module-wise count rates for Quadrant D Data is divided into 100 sec bins |
 |
 |
| Parameter | Plot |
|---|---|
| CZT HV Monitor | 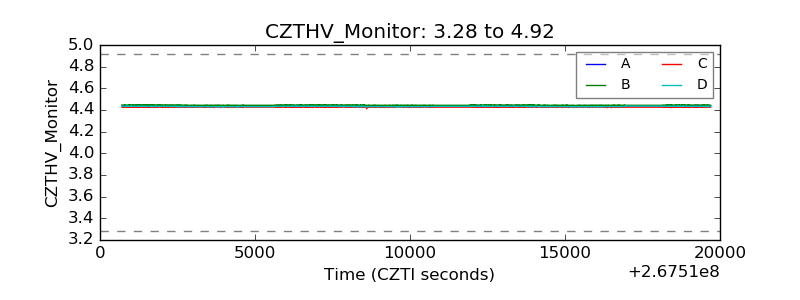 |
| D_VDD | 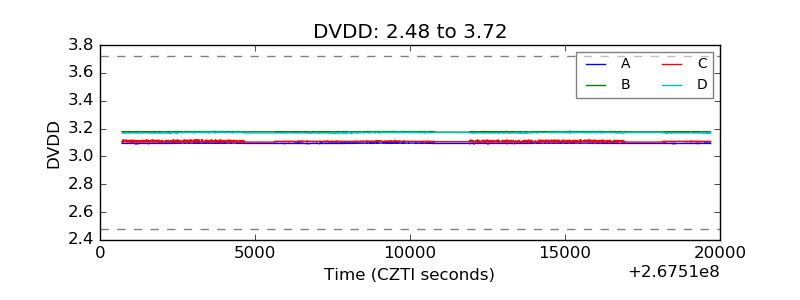 |
| Temperature 1 | 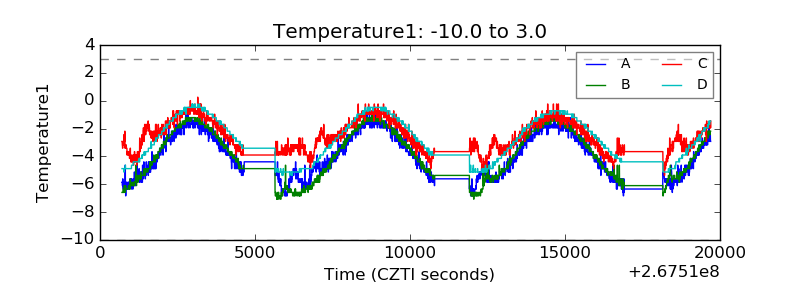 |
| Veto HV Monitor | 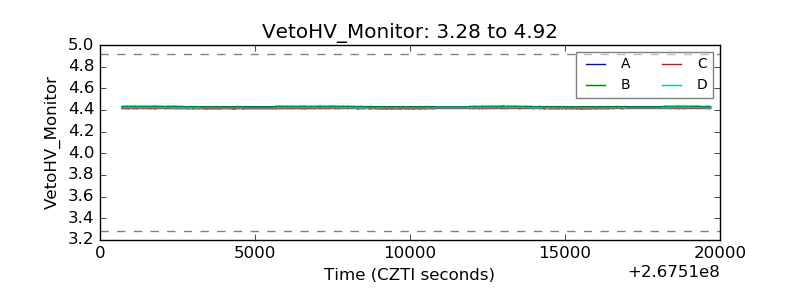 |
| Veto LLD | 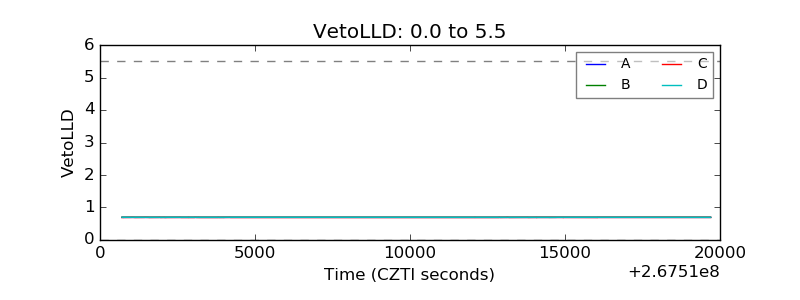 |
| Alpha Counter | 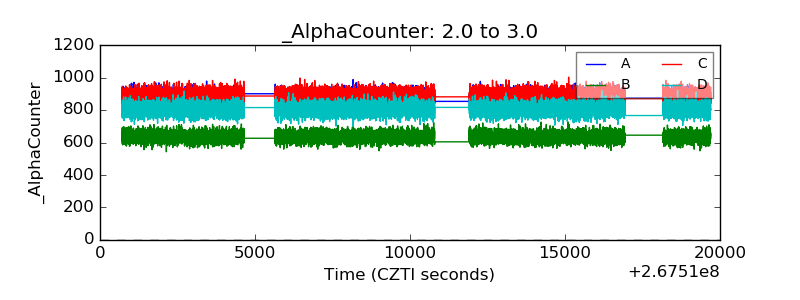 |
| _CPM_Rate | 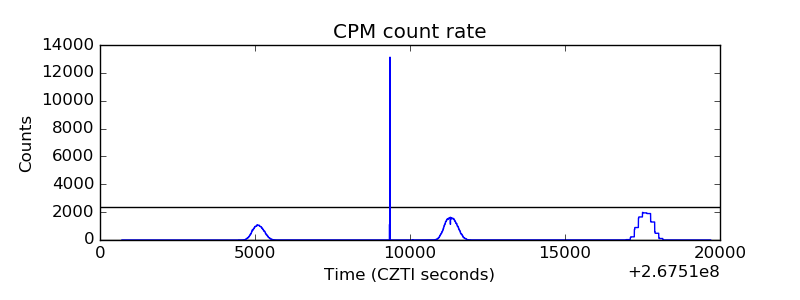 |
| CZT Counter |  |
| +2.5 Volts monitor |  |
| +5 Volts monitor |  |
| _ROLL_ROT | 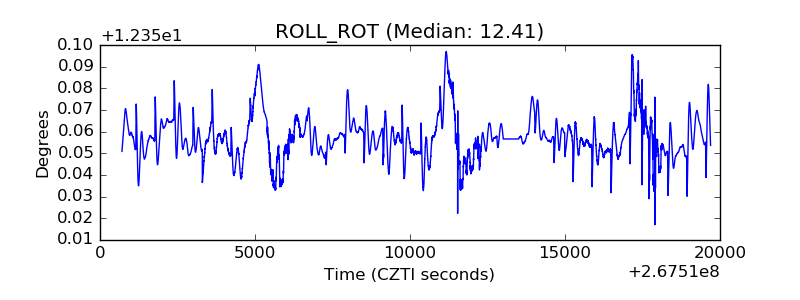 |
| _Roll_DEC | 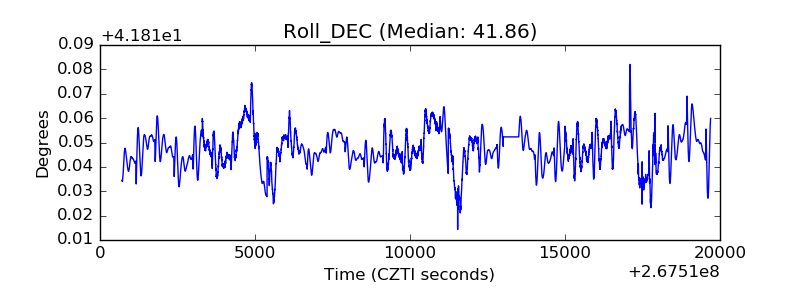 |
| _Roll_RA | 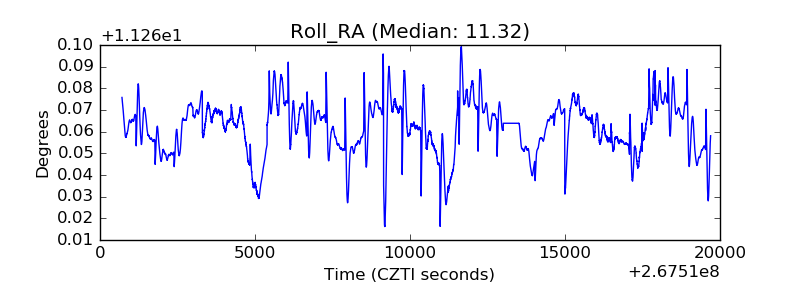 |
| Veto Counter | 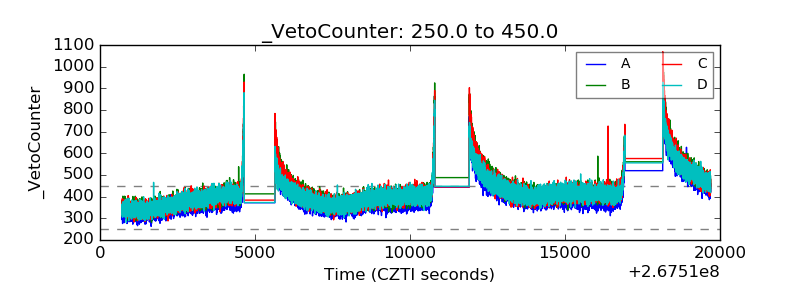 |