| Param | Original file | Final file |
|---|---|---|
| Filename | modeM0/AS1A04_022T02_9000002184_14806cztM0_level2.evt | modeM0/AS1A04_022T02_9000002184_14806cztM0_level2_quad_clean.evt |
| Size (bytes) | 279,794,880 | 45,682,560 |
| Size | 266.8 MB | 43.6 MB |
| Events in quadrant A | 2,057,951 | 281,525 |
| Events in quadrant B | 2,032,095 | 280,695 |
| Events in quadrant C | 2,216,561 | 272,462 |
| Events in quadrant D | 1,897,791 | 270,058 |
| Mode M0 | |||
|---|---|---|---|
| Quadrant | BADHDUFLAG | Total packets | Discarded packets |
| A | 0 | 8389 | 0 |
| B | 0 | 8251 | 0 |
| C | 0 | 8807 | 0 |
| D | 0 | 8132 | 0 |
| Mode SS | |||
|---|---|---|---|
| Quadrant | BADHDUFLAG | Total packets | Discarded packets |
| A | 0 | 78 | 0 |
| B | 0 | 78 | 0 |
| C | 0 | 78 | 0 |
| D | 0 | 78 | 0 |
| Quadrant | Total seconds | Saturated seconds | Saturation percentage |
|---|---|---|---|
| A | 3943 | 8 | 0.202891% |
| B | 3943 | 7 | 0.177530% |
| C | 3943 | 4 | 0.101446% |
| D | 3943 | 6 | 0.152168% |
Noise dominated data is calculated using 1-second bins in cleaned event files. If a bin has >2000 counts, and if more than 50% of those come from <1% of pixels, then it is considered to be noise-dominated and hence unusable.
| Quadrant | # 1 sec bins | Bins with >0 counts | Bins with >2000 counts | High rate bins dominated by noise | Noise dominated (total time) | Noise dominated (detector-on time) | Marked lightcurve |
|---|---|---|---|---|---|---|---|
| A | 3944 | 3944 | 3 | 3 | 0.08% | 0.08% | 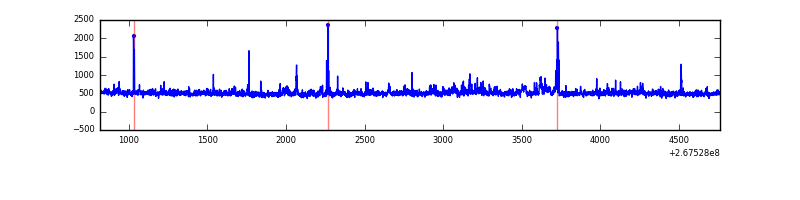 |
| B | 3944 | 3944 | 2 | 2 | 0.05% | 0.05% | 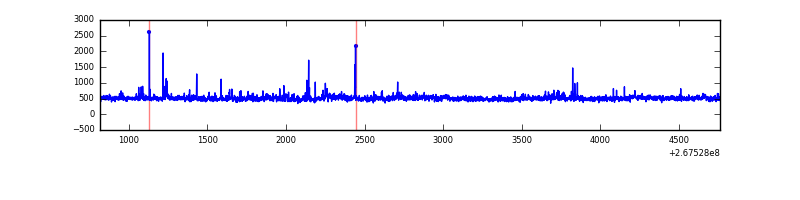 |
| C | 3944 | 3944 | 1 | 1 | 0.03% | 0.03% | 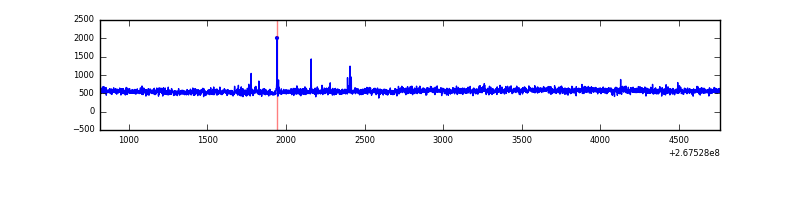 |
| D | 3944 | 3944 | 8 | 8 | 0.20% | 0.20% | 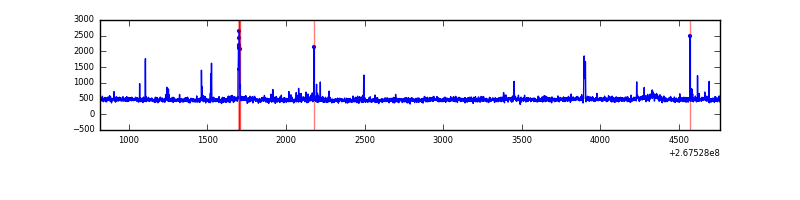 |
Top three noisy pixels from each quadrant. If the there are fewer than three noisy pixels in the level2.evt file, extra rows are filled as -1
| Pixel properties | Quadrant properties | ||||||
|---|---|---|---|---|---|---|---|
| Quadrant | DetID | PixID | Counts | Sigma | Mean | Median | Sigma |
| A | 12 | 189 | 131716 | 1316.88 | 489 | 479 | 99.7 |
| A | 4 | 2 | 25445 | 250.52 | 489 | 479 | 99.7 |
| A | 9 | 143 | 15656 | 152.29 | 489 | 479 | 99.7 |
| B | 0 | 219 | 44361 | 481.75 | 482 | 470 | 91.1 |
| B | 3 | 64 | 33674 | 364.45 | 482 | 470 | 91.1 |
| B | 3 | 209 | 14123 | 149.85 | 482 | 470 | 91.1 |
| C | 3 | 233 | 391655 | 3656.94 | 463 | 465 | 107.0 |
| C | 0 | 207 | 11478 | 102.95 | 463 | 465 | 107.0 |
| C | 10 | 22 | 3813 | 31.3 | 463 | 465 | 107.0 |
| D | 12 | 110 | 61870 | 543.76 | 472 | 461 | 112.9 |
| D | 2 | 234 | 15613 | 134.17 | 472 | 461 | 112.9 |
| D | 10 | 199 | 15585 | 133.92 | 472 | 461 | 112.9 |
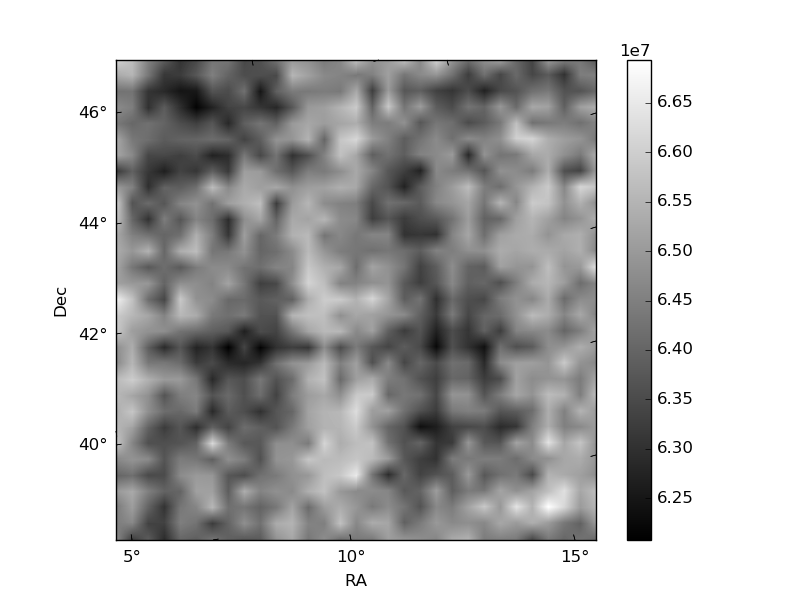
Histogram calculated using DETX and DETY for each event in the final _common_clean file
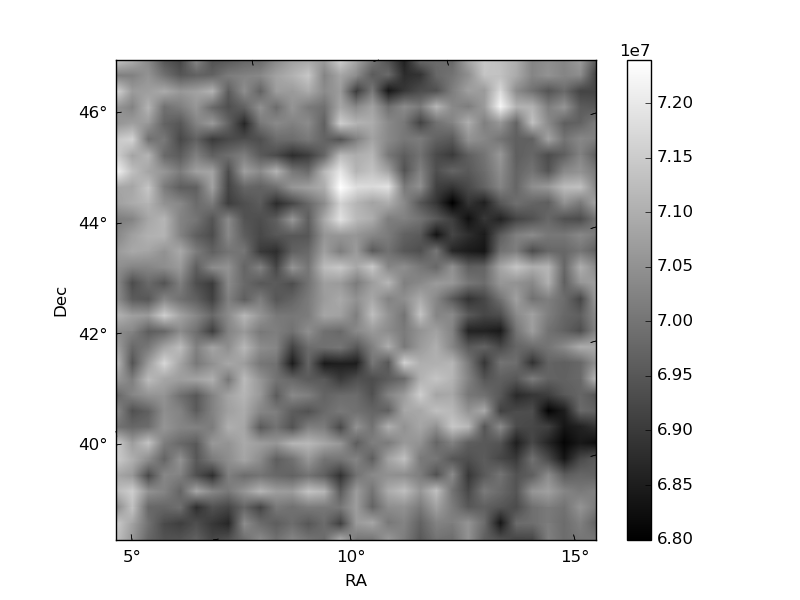
| Quadrant A | 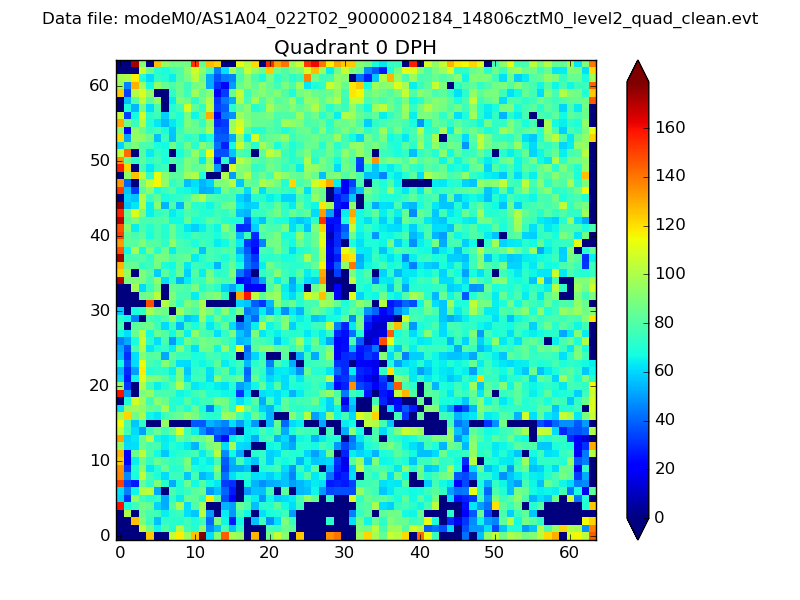 |
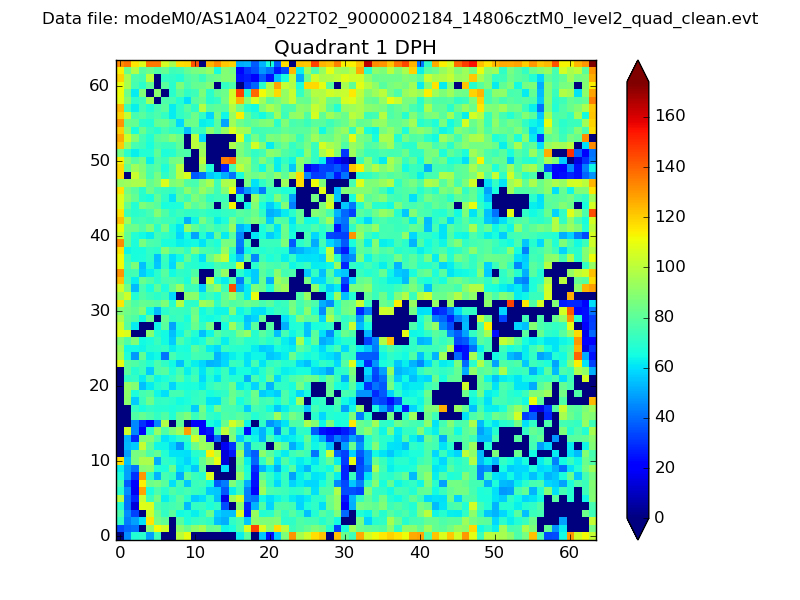 |
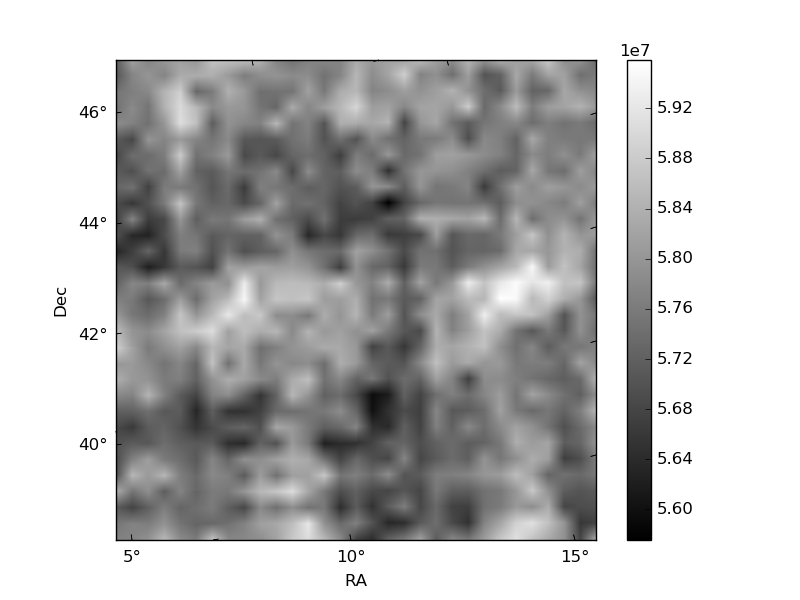
Quadrant B |
|---|---|---|---|
| Quadrant D | 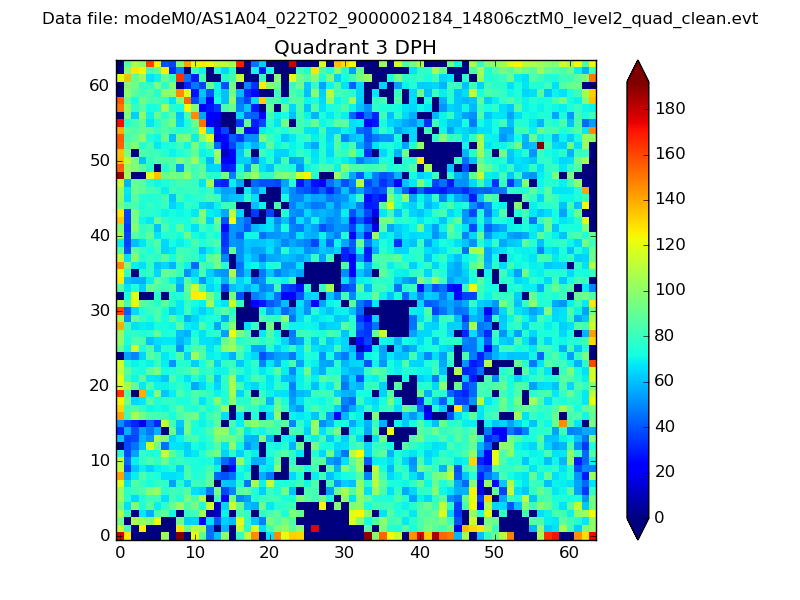 |
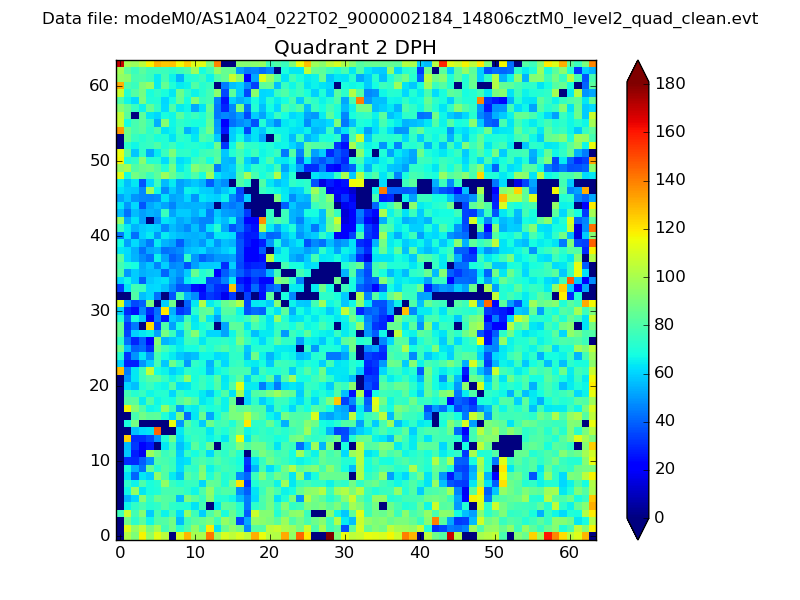 |
Quadrant C |
| Plot type | Count rate plots | Images |
|---|---|---|
| Comparison with Poisson distribution Blue bars denote a histogram of data divided into 1 sec bins. Red curve is a Poisson curve with rate = median count rate of data. |
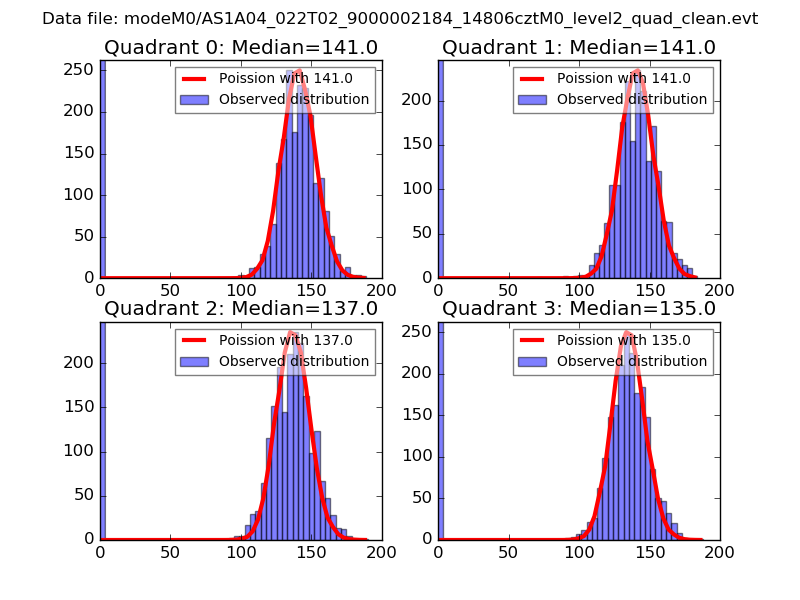 |
 |
| Quadrant-wise count rates Data is divided into 100 sec bins |
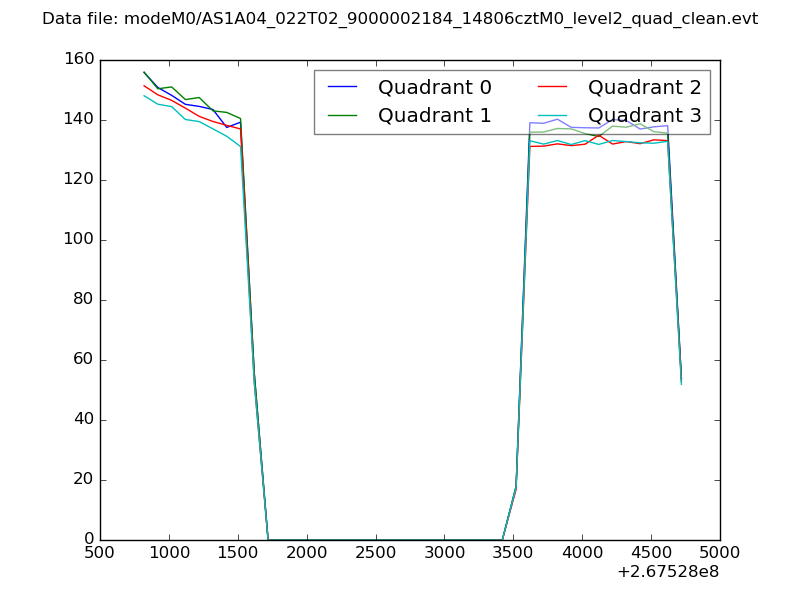 |
|
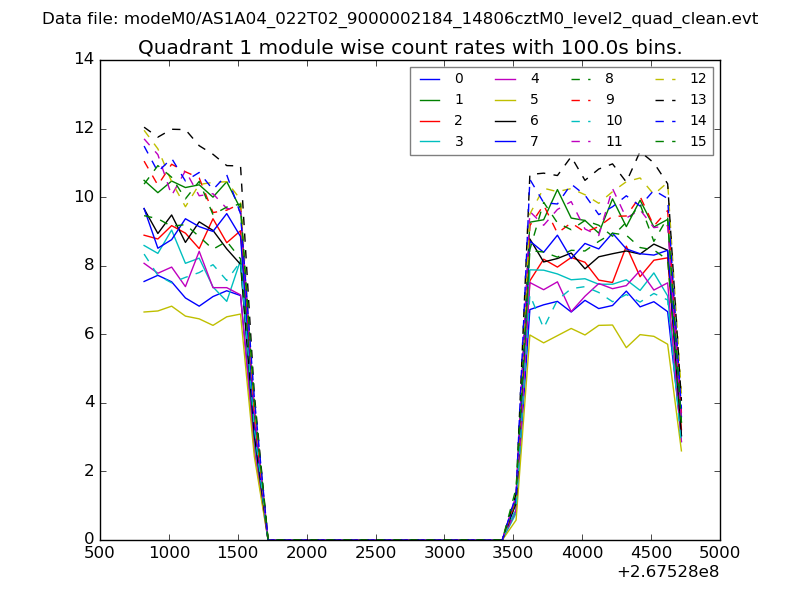
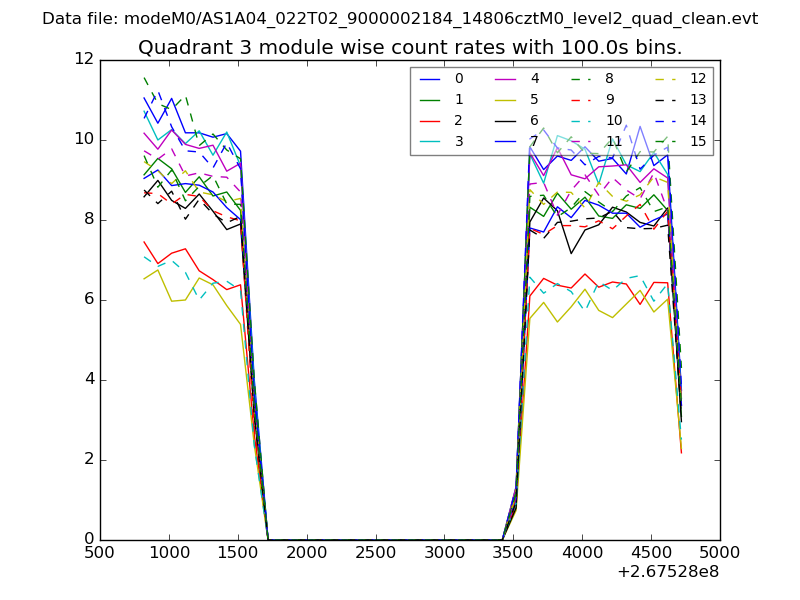
| Module-wise count rates for Quadrant A Data is divided into 100 sec bins |
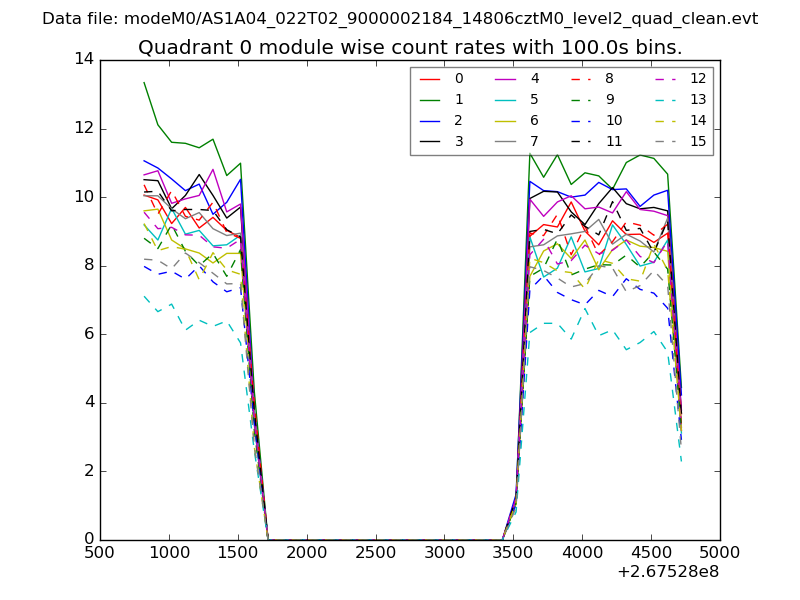 |
 |
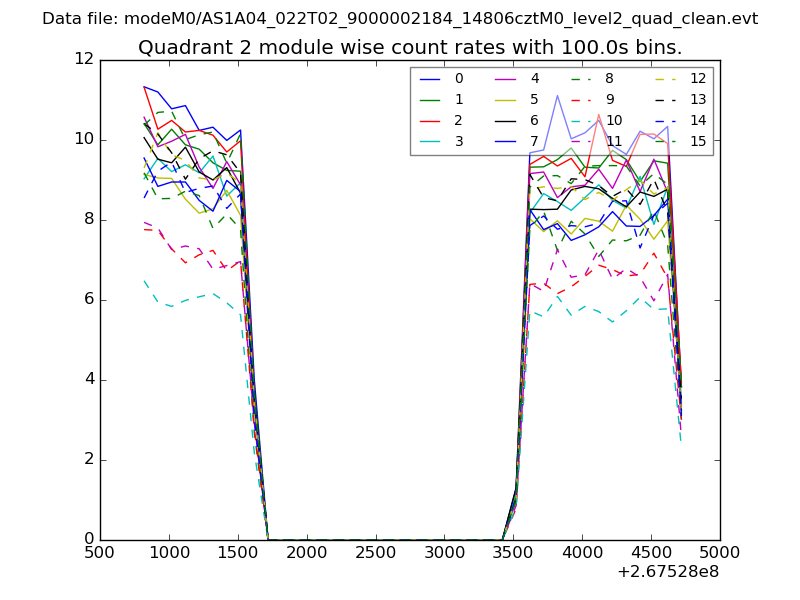
| Module-wise count rates for Quadrant B Data is divided into 100 sec bins |
 |
 |
| Module-wise count rates for Quadrant C Data is divided into 100 sec bins |
 |
 |
| Module-wise count rates for Quadrant D Data is divided into 100 sec bins |
 |
 |
| Parameter | Plot |
|---|---|
| CZT HV Monitor | 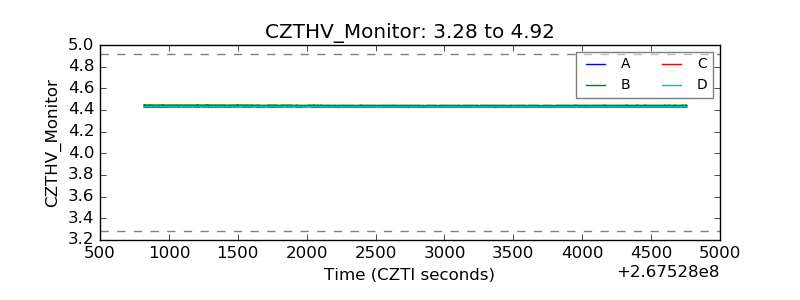 |
| D_VDD | 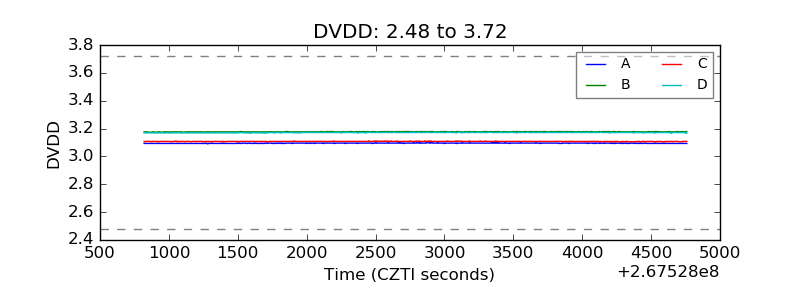 |
| Temperature 1 | 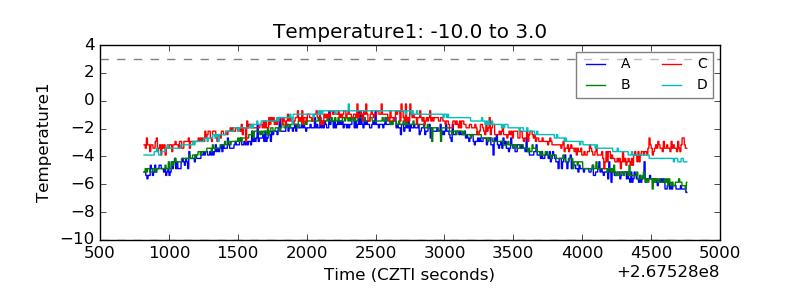 |
| Veto HV Monitor | 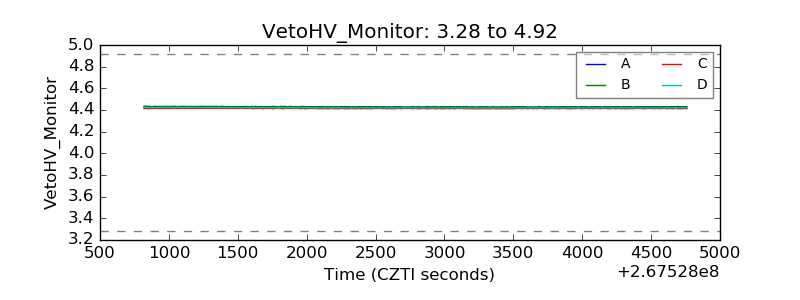 |
| Veto LLD | 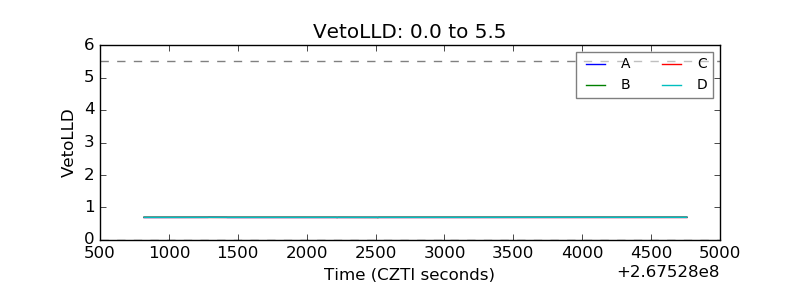 |
| Alpha Counter |  |
| _CPM_Rate | 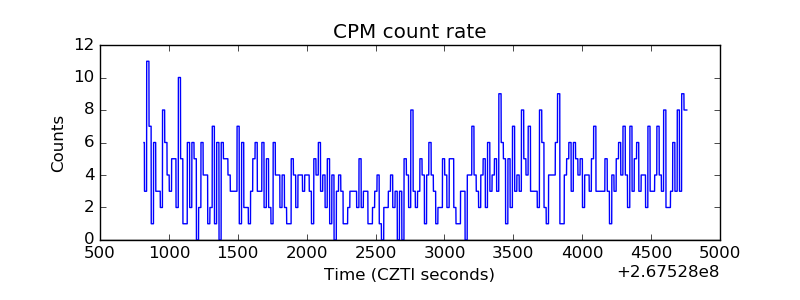 |
| CZT Counter | 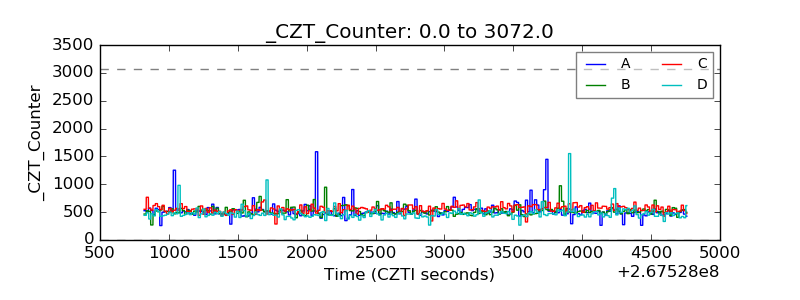 |
| +2.5 Volts monitor |  |
| +5 Volts monitor |  |
| _ROLL_ROT | 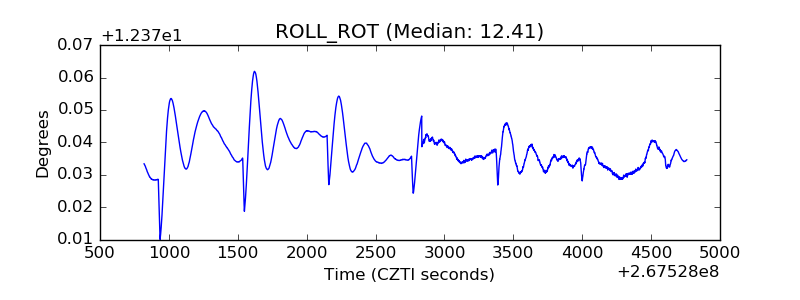 |
| _Roll_DEC | 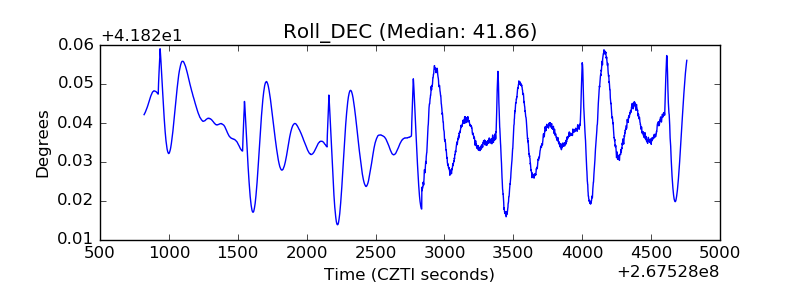 |
| _Roll_RA |  |
| Veto Counter | 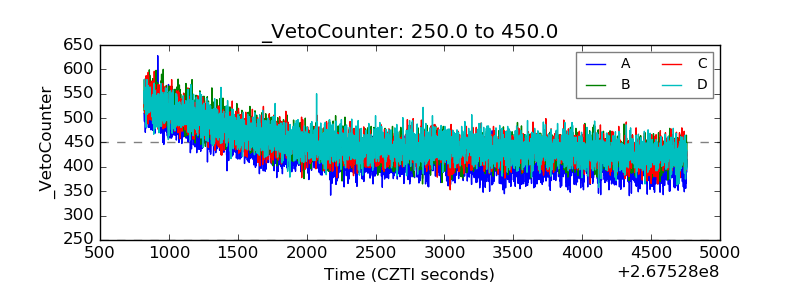 |