| Param | Original file | Final file |
|---|---|---|
| Filename | modeM0/AS1A04_130T03_9000002186_14806cztM0_level2.evt | modeM0/AS1A04_130T03_9000002186_14806cztM0_level2_quad_clean.evt |
| Size (bytes) | 132,696,000 | 12,297,600 |
| Size | 126.5 MB | 11.7 MB |
| Events in quadrant A | 960,587 | 65,844 |
| Events in quadrant B | 1,013,051 | 66,916 |
| Events in quadrant C | 1,019,818 | 63,672 |
| Events in quadrant D | 918,925 | 62,100 |
| Mode M0 | |||
|---|---|---|---|
| Quadrant | BADHDUFLAG | Total packets | Discarded packets |
| A | 0 | 3943 | 2 |
| B | 0 | 4248 | 1 |
| C | 0 | 4325 | 1 |
| D | 0 | 3646 | 1 |
| Mode SS | |||
|---|---|---|---|
| Quadrant | BADHDUFLAG | Total packets | Discarded packets |
| A | 0 | 30 | 0 |
| B | 0 | 30 | 0 |
| C | 0 | 30 | 0 |
| D | 0 | 30 | 0 |
| Mode M9 | |||
|---|---|---|---|
| Quadrant | BADHDUFLAG | Total packets | Discarded packets |
| A | 0 | 8 | 0 |
| B | 0 | 8 | 0 |
| C | 0 | 8 | 0 |
| D | 0 | 8 | 0 |
| Quadrant | Total seconds | Saturated seconds | Saturation percentage |
|---|---|---|---|
| A | 1530 | 23 | 1.503268% |
| B | 1530 | 28 | 1.830065% |
| C | 1530 | 15 | 0.980392% |
| D | 1530 | 26 | 1.699346% |
Noise dominated data is calculated using 1-second bins in cleaned event files. If a bin has >2000 counts, and if more than 50% of those come from <1% of pixels, then it is considered to be noise-dominated and hence unusable.
| Quadrant | # 1 sec bins | Bins with >0 counts | Bins with >2000 counts | High rate bins dominated by noise | Noise dominated (total time) | Noise dominated (detector-on time) | Marked lightcurve |
|---|---|---|---|---|---|---|---|
| A | 1531 | 1531 | 3 | 3 | 0.20% | 0.20% | 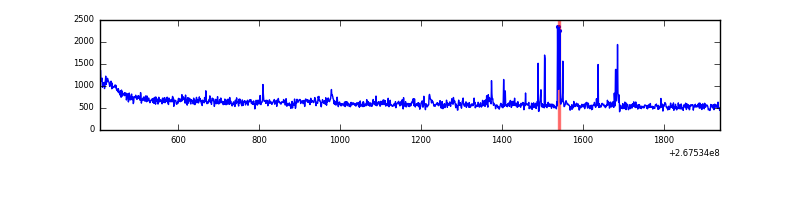 |
| B | 1531 | 1531 | 0 | 0 | 0.00% | 0.00% | 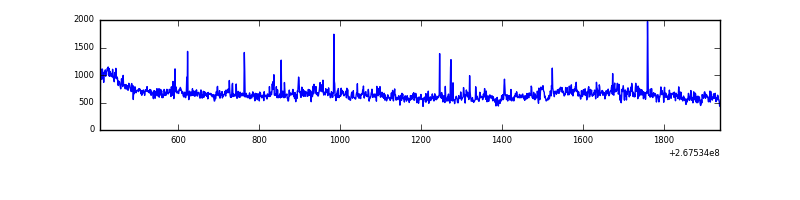 |
| C | 1531 | 1531 | 0 | 0 | 0.00% | 0.00% | 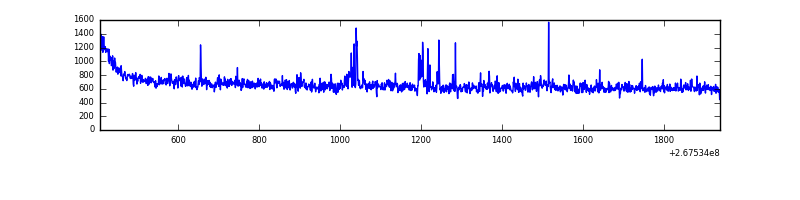 |
| D | 1531 | 1531 | 8 | 8 | 0.52% | 0.52% | 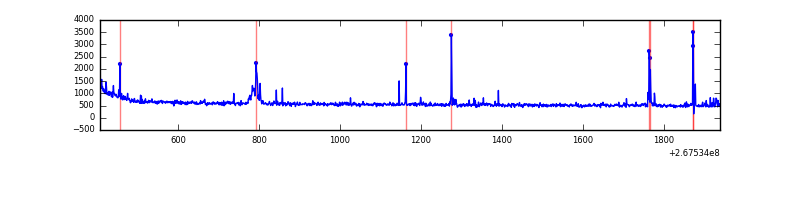 |
Top three noisy pixels from each quadrant. If the there are fewer than three noisy pixels in the level2.evt file, extra rows are filled as -1
| Pixel properties | Quadrant properties | ||||||
|---|---|---|---|---|---|---|---|
| Quadrant | DetID | PixID | Counts | Sigma | Mean | Median | Sigma |
| A | 14 | 237 | 34217 | 705.35 | 236 | 231 | 48.2 |
| A | 12 | 189 | 18397 | 377.02 | 236 | 231 | 48.2 |
| A | 0 | 226 | 2139 | 39.6 | 236 | 231 | 48.2 |
| B | 0 | 219 | 63426 | 1410.97 | 231 | 227 | 44.8 |
| B | 3 | 64 | 10738 | 234.67 | 231 | 227 | 44.8 |
| B | 3 | 209 | 8881 | 193.21 | 231 | 227 | 44.8 |
| C | 3 | 233 | 140732 | 2740.41 | 220 | 221 | 51.3 |
| C | 0 | 207 | 18953 | 365.33 | 220 | 221 | 51.3 |
| C | 7 | 247 | 1768 | 30.17 | 220 | 221 | 51.3 |
| D | 10 | 70 | 21222 | 385.25 | 225 | 219 | 54.5 |
| D | 13 | 104 | 18238 | 330.52 | 225 | 219 | 54.5 |
| D | 13 | 249 | 9245 | 165.56 | 225 | 219 | 54.5 |
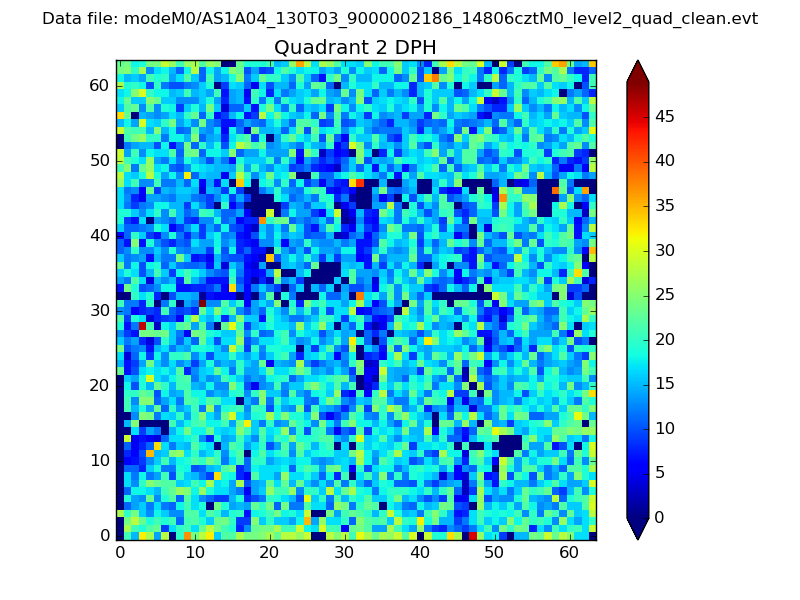
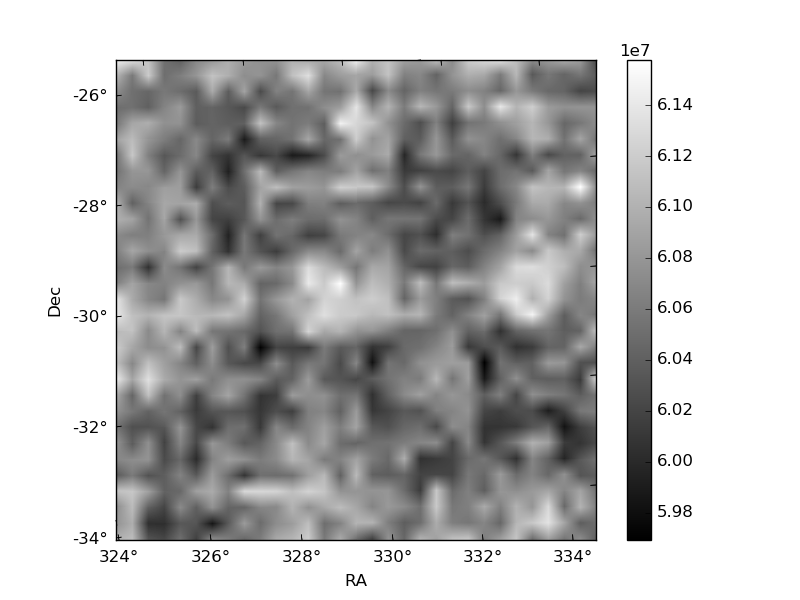
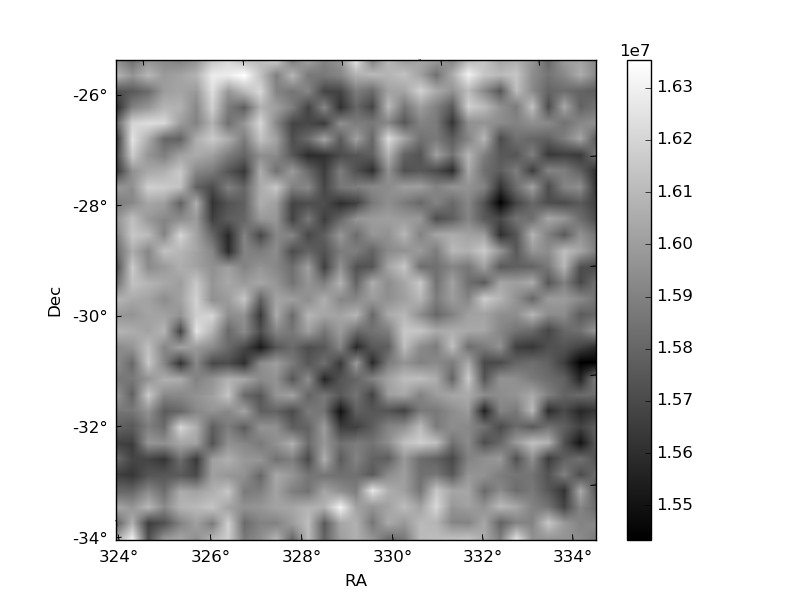
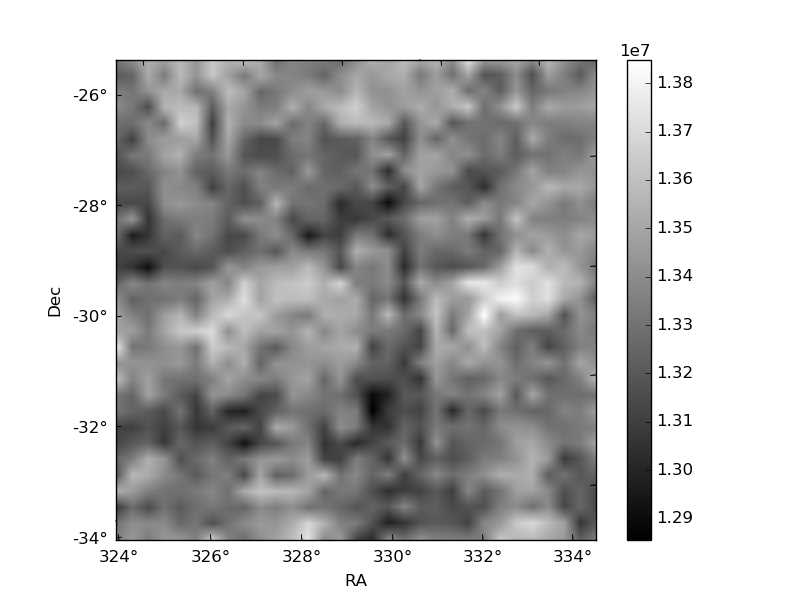
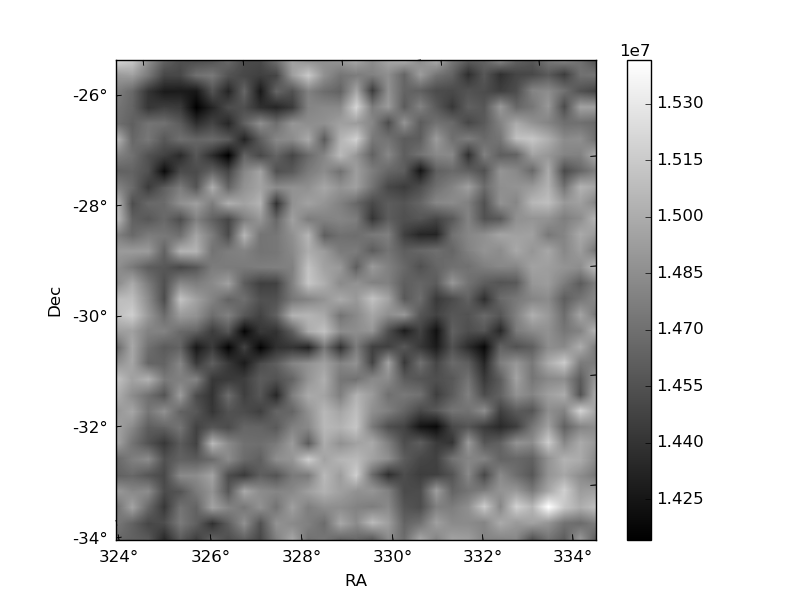
Histogram calculated using DETX and DETY for each event in the final _common_clean file
| Quadrant A | 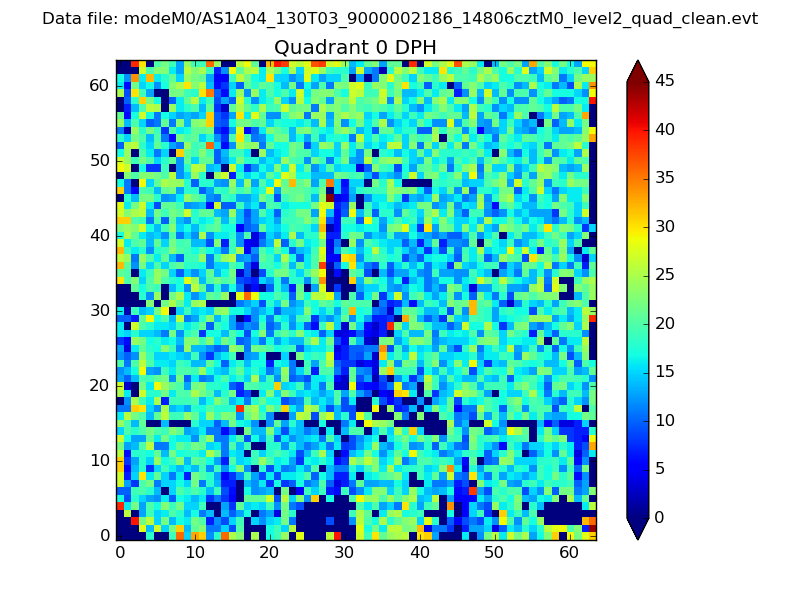 |
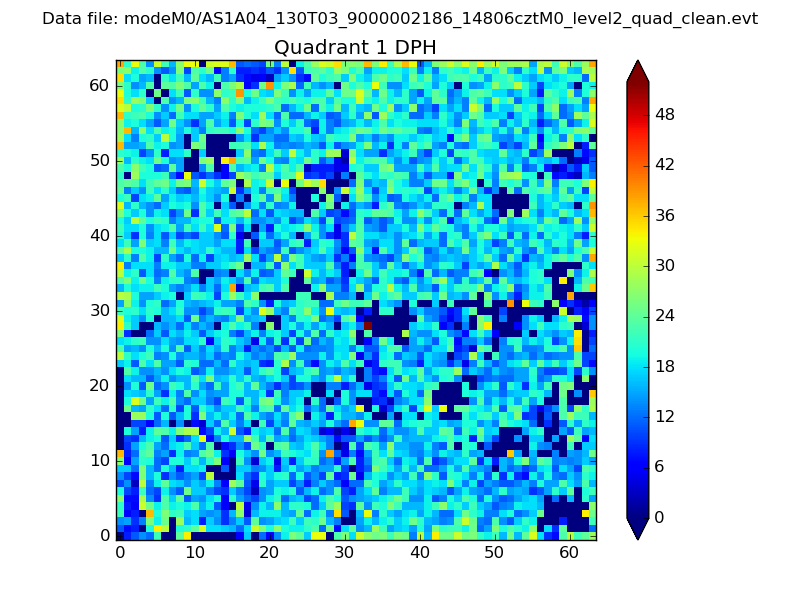 |
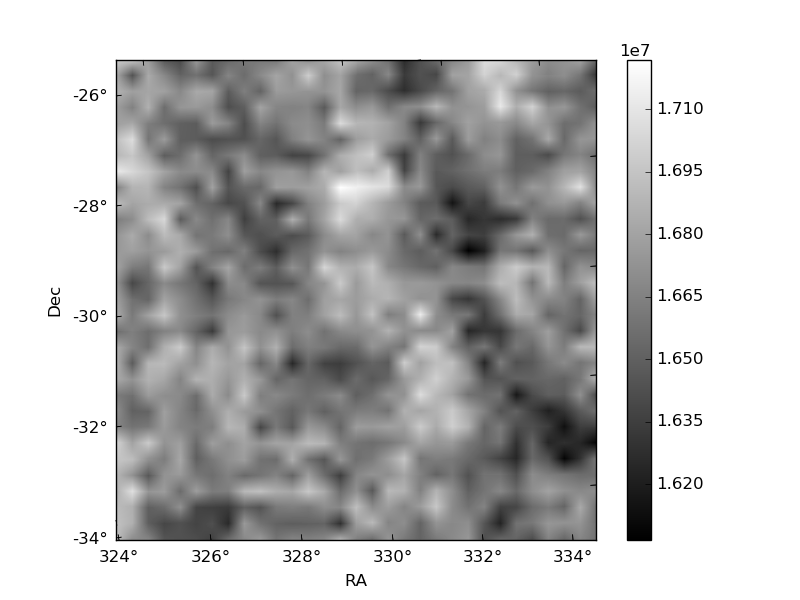
Quadrant B |
|---|---|---|---|
| Quadrant D | 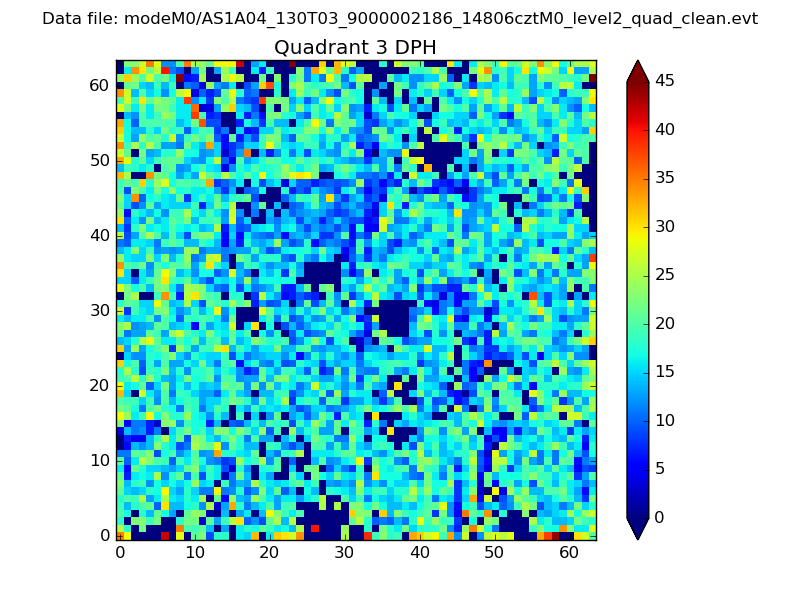 |
 |
Quadrant C |
| Plot type | Count rate plots | Images |
|---|---|---|
| Comparison with Poisson distribution Blue bars denote a histogram of data divided into 1 sec bins. Red curve is a Poisson curve with rate = median count rate of data. |
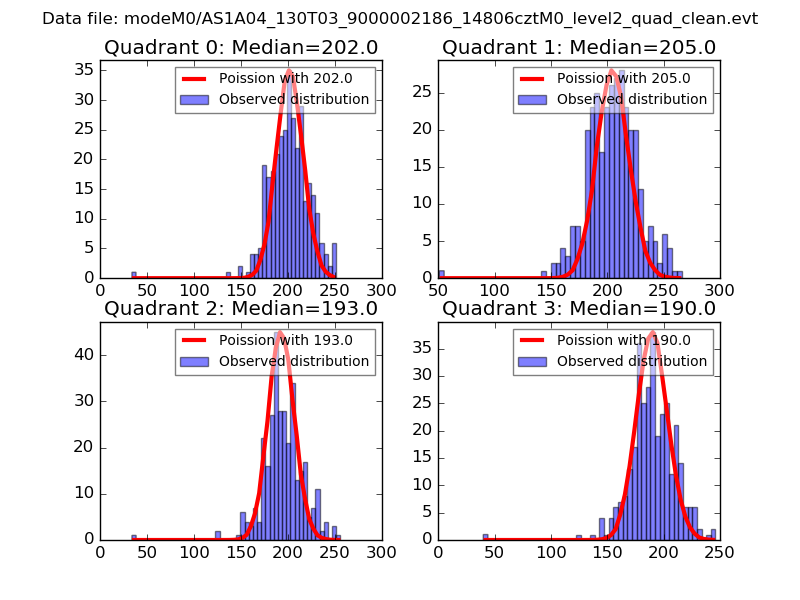 |
 |
| Quadrant-wise count rates Data is divided into 100 sec bins |
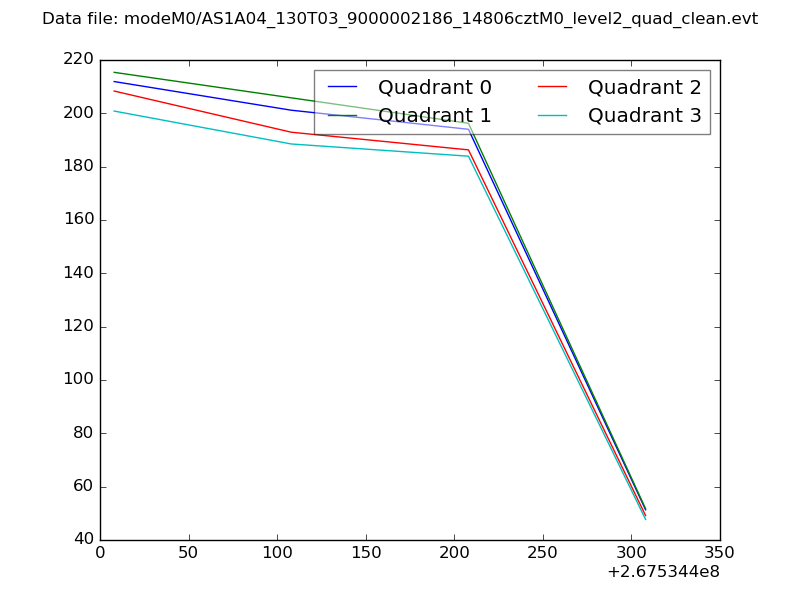 |
|
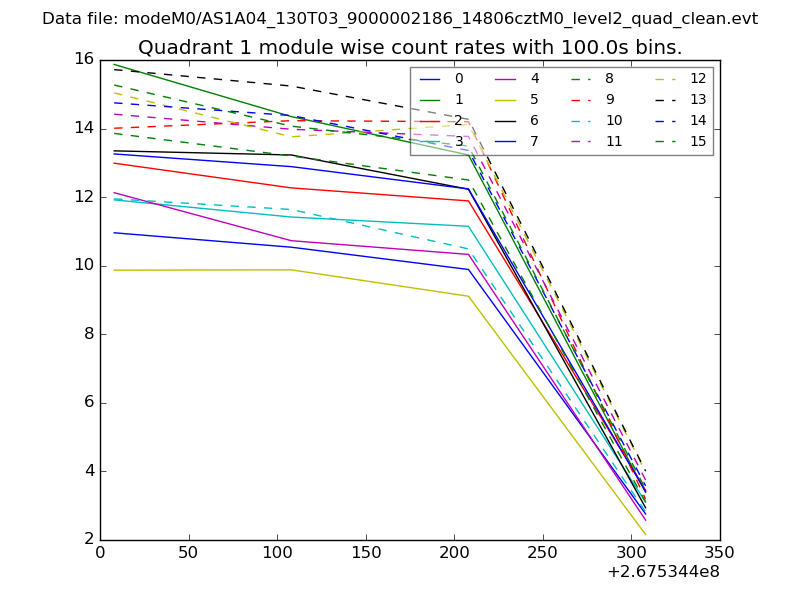
| Module-wise count rates for Quadrant A Data is divided into 100 sec bins |
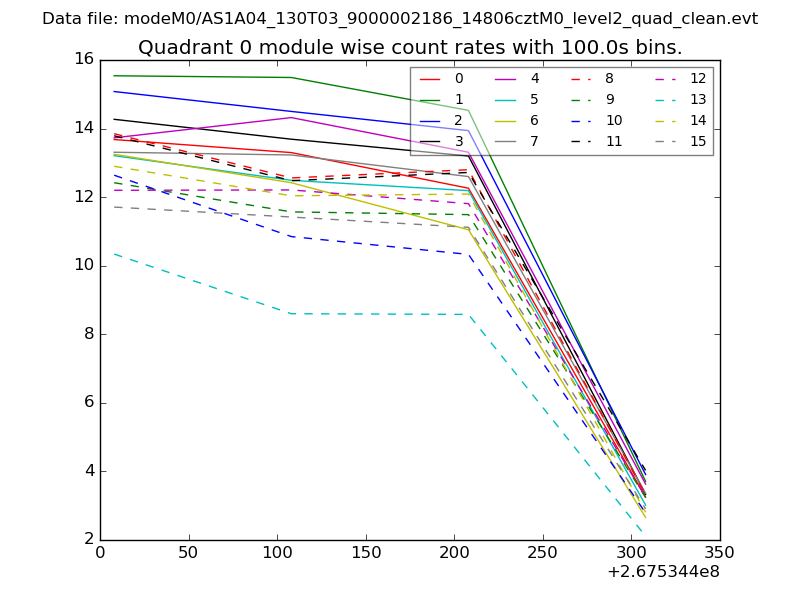 |
 |
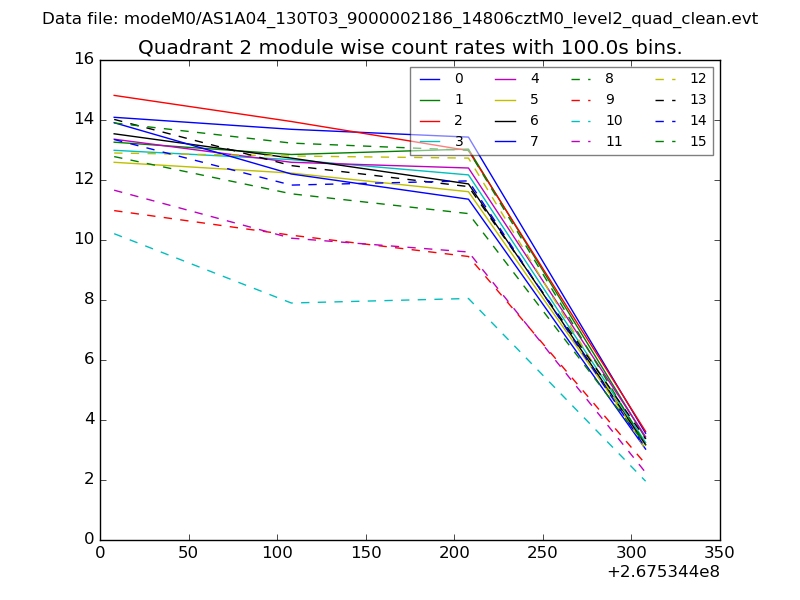
| Module-wise count rates for Quadrant B Data is divided into 100 sec bins |
 |
 |
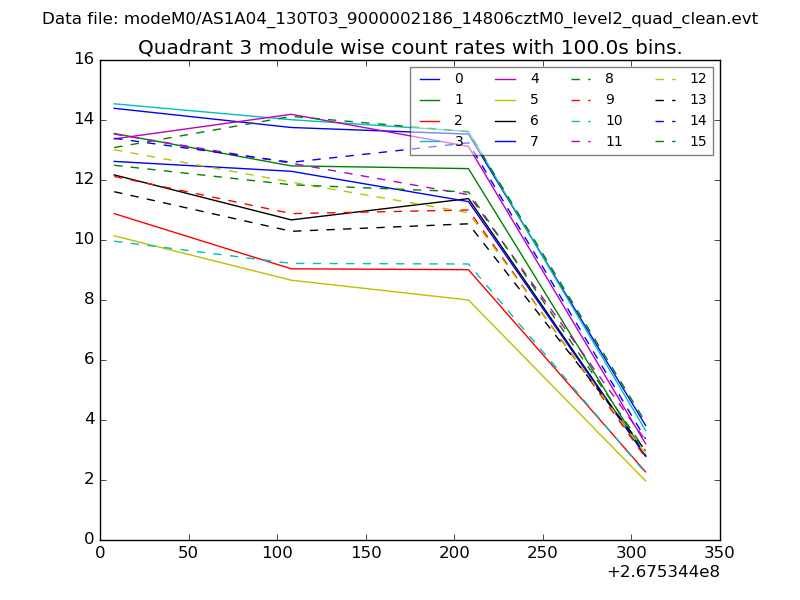
| Module-wise count rates for Quadrant C Data is divided into 100 sec bins |
 |
 |
| Module-wise count rates for Quadrant D Data is divided into 100 sec bins |
 |
 |
| Parameter | Plot |
|---|---|
| CZT HV Monitor | 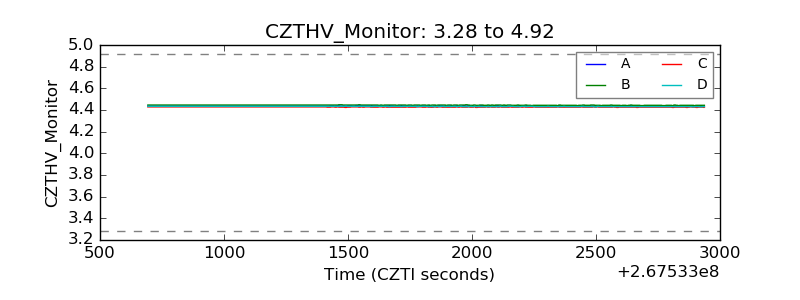 |
| D_VDD | 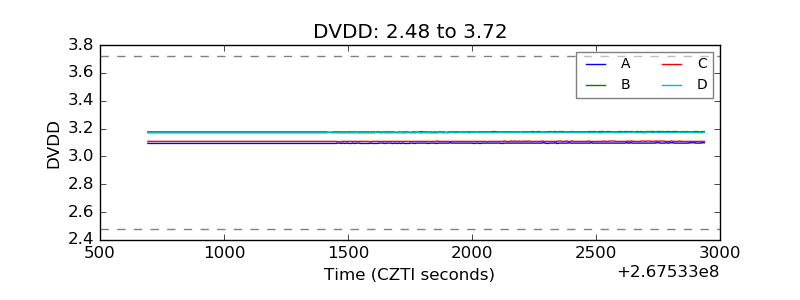 |
| Temperature 1 | 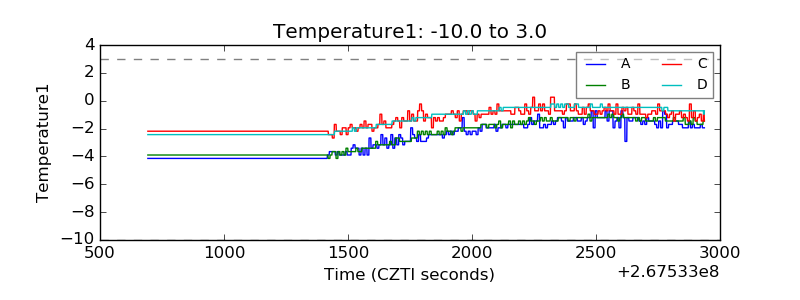 |
| Veto HV Monitor | 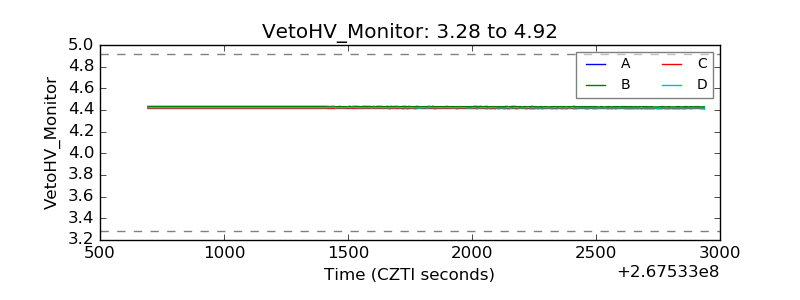 |
| Veto LLD | 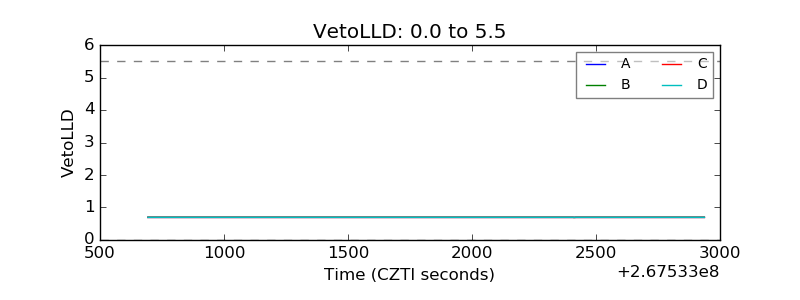 |
| Alpha Counter | 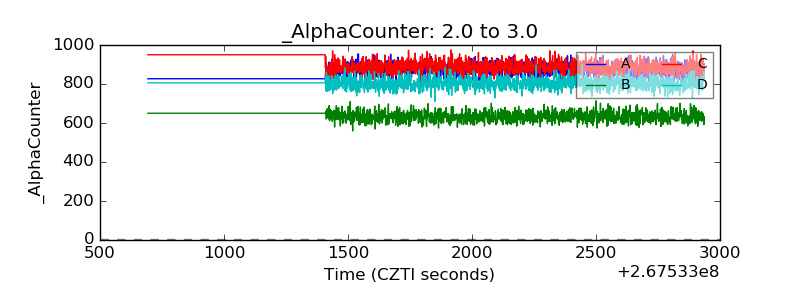 |
| _CPM_Rate | 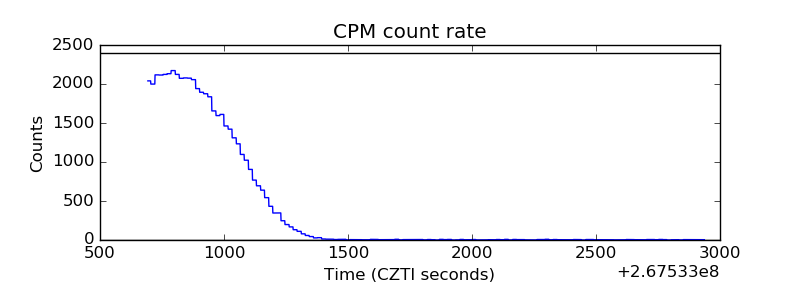 |
| CZT Counter | 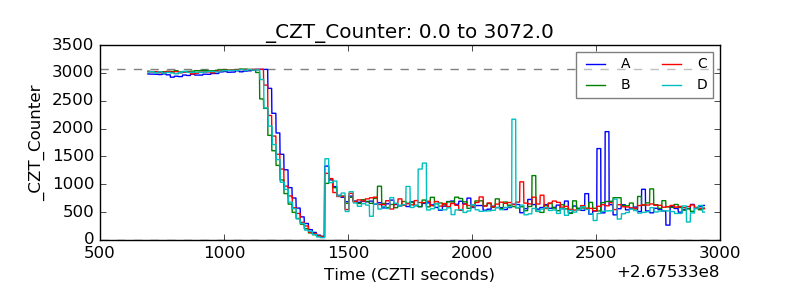 |
| +2.5 Volts monitor |  |
| +5 Volts monitor |  |
| _ROLL_ROT | 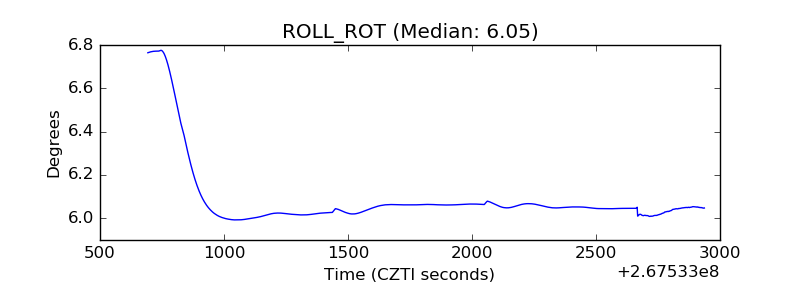 |
| _Roll_DEC | 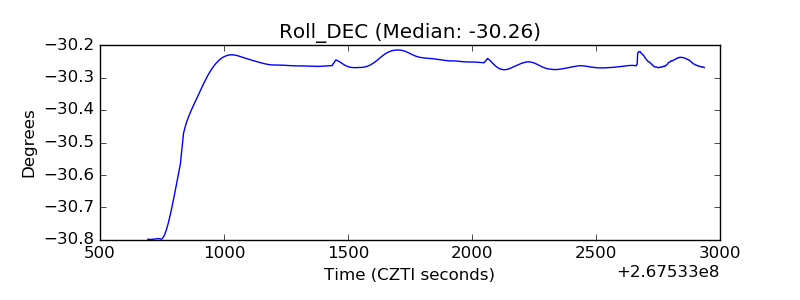 |
| _Roll_RA | 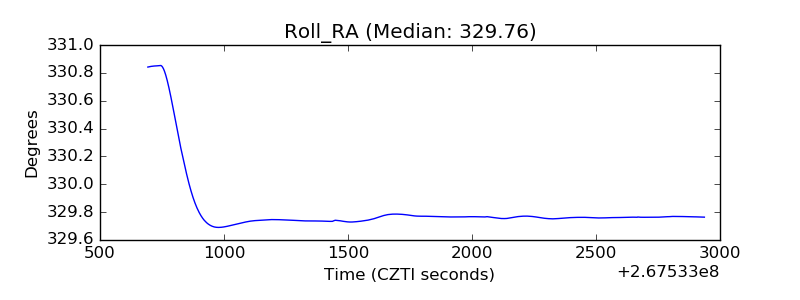 |
| Veto Counter | 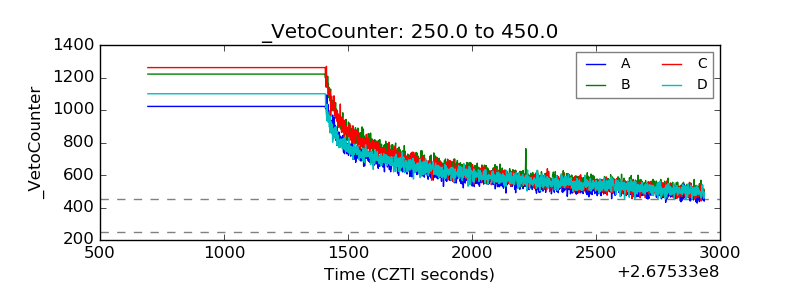 |