| Param | Original file | Final file |
|---|---|---|
| Filename | modeM0/AS1A04_130T03_9000002186_14809cztM0_level2.evt | modeM0/AS1A04_130T03_9000002186_14809cztM0_level2_quad_clean.evt |
| Size (bytes) | 478,618,560 | 76,685,760 |
| Size | 456.4 MB | 73.1 MB |
| Events in quadrant A | 3,342,696 | 479,837 |
| Events in quadrant B | 3,642,741 | 476,251 |
| Events in quadrant C | 3,810,172 | 455,595 |
| Events in quadrant D | 3,259,861 | 458,703 |
| Mode M0 | |||
|---|---|---|---|
| Quadrant | BADHDUFLAG | Total packets | Discarded packets |
| A | 0 | 13824 | 3 |
| B | 0 | 14707 | 2 |
| C | 0 | 15528 | 2 |
| D | 0 | 13868 | 2 |
| Mode SS | |||
|---|---|---|---|
| Quadrant | BADHDUFLAG | Total packets | Discarded packets |
| A | 0 | 130 | 0 |
| B | 0 | 130 | 0 |
| C | 0 | 130 | 0 |
| D | 0 | 130 | 0 |
| Mode M9 | |||
|---|---|---|---|
| Quadrant | BADHDUFLAG | Total packets | Discarded packets |
| A | 0 | 17 | 0 |
| B | 0 | 17 | 0 |
| C | 0 | 17 | 0 |
| D | 0 | 18 | 0 |
| Quadrant | Total seconds | Saturated seconds | Saturation percentage |
|---|---|---|---|
| A | 6480 | 101 | 1.558642% |
| B | 6480 | 181 | 2.793210% |
| C | 6480 | 62 | 0.956790% |
| D | 6480 | 57 | 0.879630% |
Noise dominated data is calculated using 1-second bins in cleaned event files. If a bin has >2000 counts, and if more than 50% of those come from <1% of pixels, then it is considered to be noise-dominated and hence unusable.
| Quadrant | # 1 sec bins | Bins with >0 counts | Bins with >2000 counts | High rate bins dominated by noise | Noise dominated (total time) | Noise dominated (detector-on time) | Marked lightcurve |
|---|---|---|---|---|---|---|---|
| A | 7556 | 6482 | 0 | 0 | 0.00% | 0.00% | 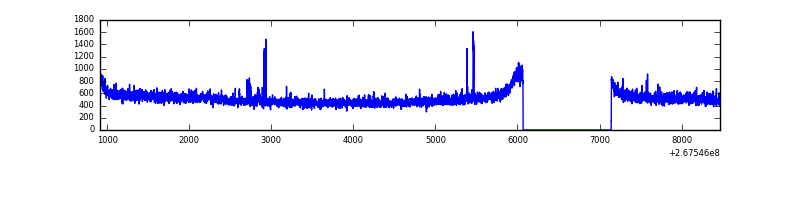 |
| B | 7556 | 6482 | 37 | 37 | 0.49% | 0.57% | 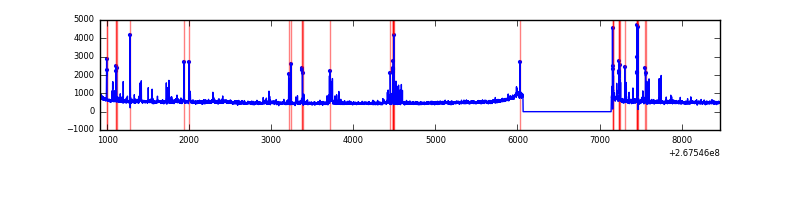 |
| C | 7556 | 6482 | 1 | 1 | 0.01% | 0.02% | 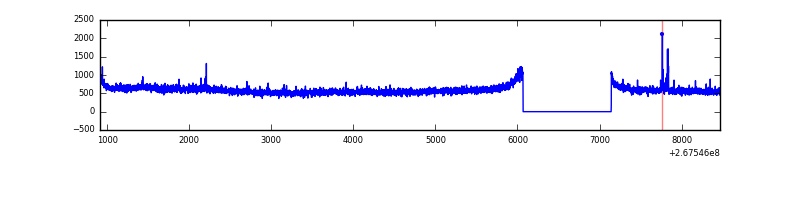 |
| D | 7556 | 6482 | 8 | 8 | 0.11% | 0.12% | 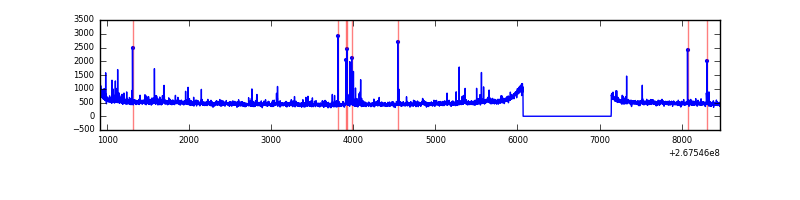 |
Top three noisy pixels from each quadrant. If the there are fewer than three noisy pixels in the level2.evt file, extra rows are filled as -1
| Pixel properties | Quadrant properties | ||||||
|---|---|---|---|---|---|---|---|
| Quadrant | DetID | PixID | Counts | Sigma | Mean | Median | Sigma |
| A | 12 | 189 | 65218 | 376.88 | 847 | 828 | 170.8 |
| A | 14 | 237 | 10066 | 54.07 | 847 | 828 | 170.8 |
| A | 13 | 248 | 9594 | 51.31 | 847 | 828 | 170.8 |
| B | 3 | 64 | 171862 | 1079.0 | 836 | 817 | 158.5 |
| B | 4 | 173 | 76285 | 476.07 | 836 | 817 | 158.5 |
| B | 15 | 35 | 36084 | 222.47 | 836 | 817 | 158.5 |
| C | 3 | 233 | 638660 | 3440.41 | 805 | 809 | 185.4 |
| C | 0 | 207 | 23478 | 122.27 | 805 | 809 | 185.4 |
| C | 10 | 22 | 6286 | 29.54 | 805 | 809 | 185.4 |
| D | 10 | 199 | 58513 | 296.87 | 815 | 796 | 194.4 |
| D | 10 | 70 | 39207 | 197.57 | 815 | 796 | 194.4 |
| D | 13 | 249 | 27426 | 136.97 | 815 | 796 | 194.4 |
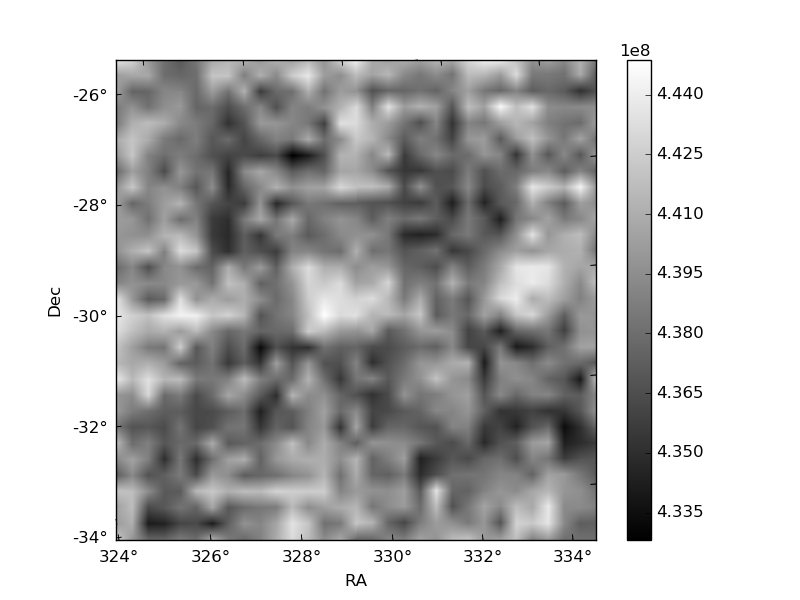
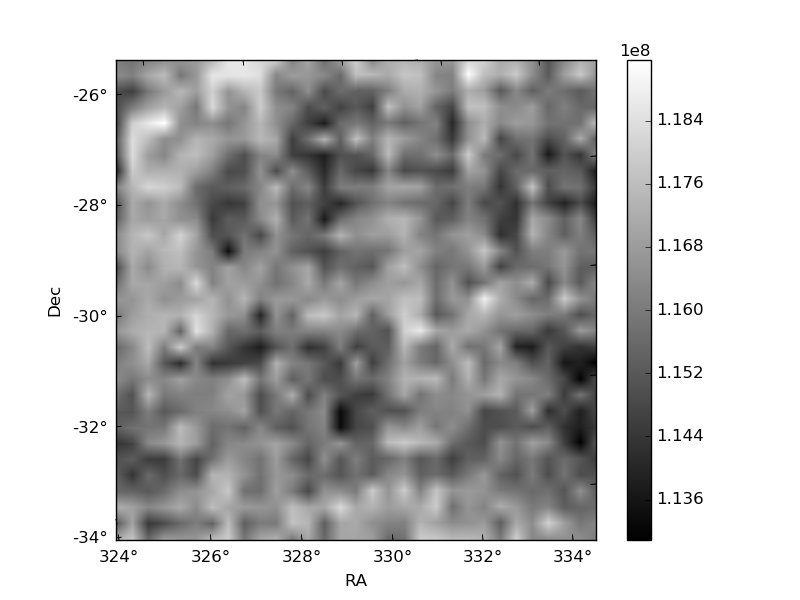
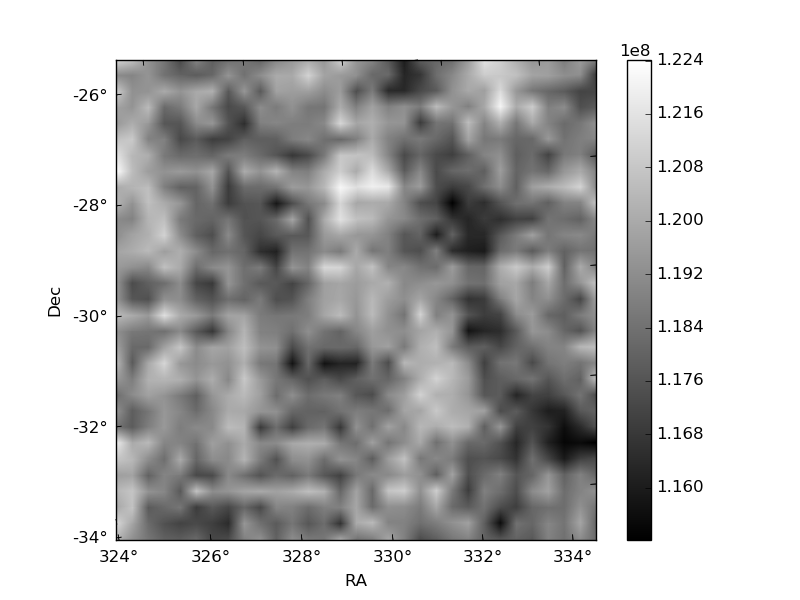
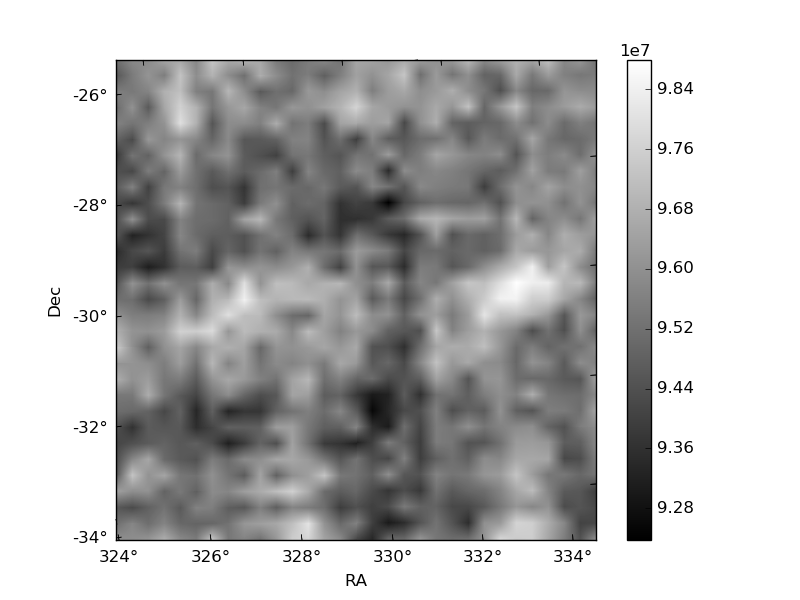
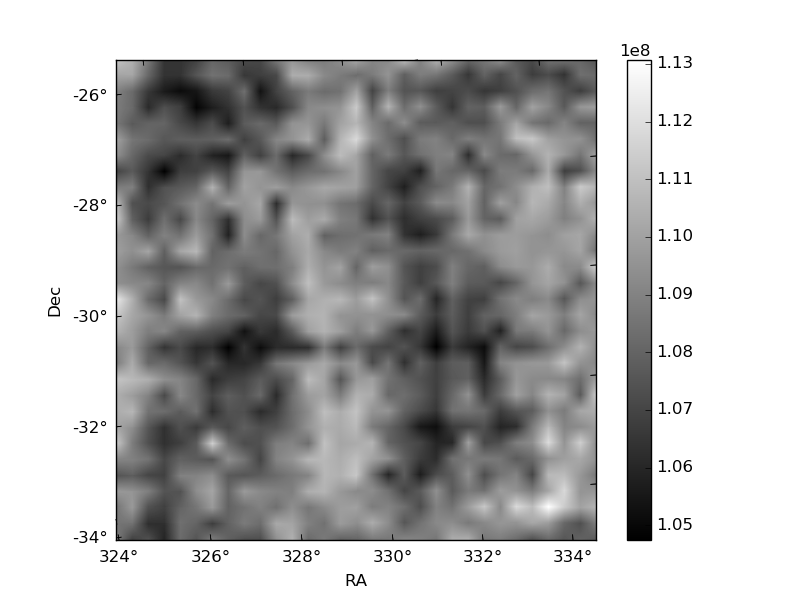
Histogram calculated using DETX and DETY for each event in the final _common_clean file
| Quadrant A | 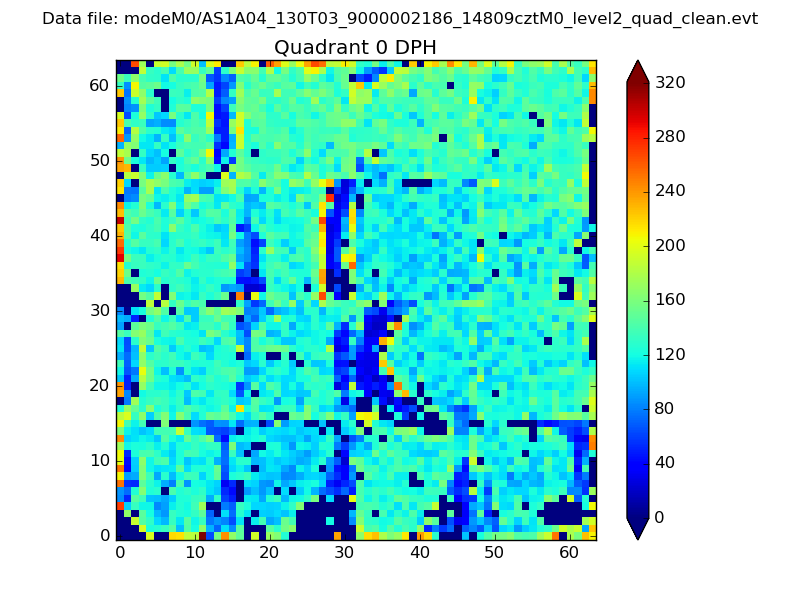 |
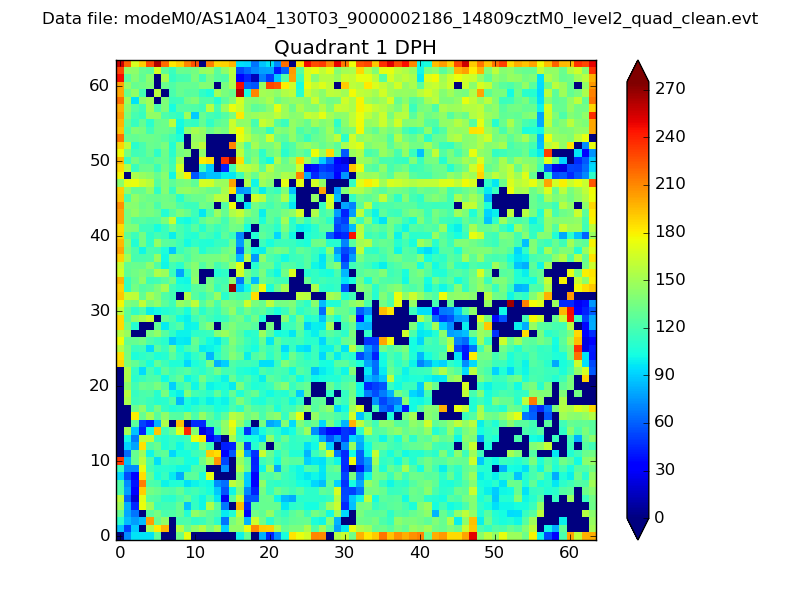 |
Quadrant B |
|---|---|---|---|
| Quadrant D | 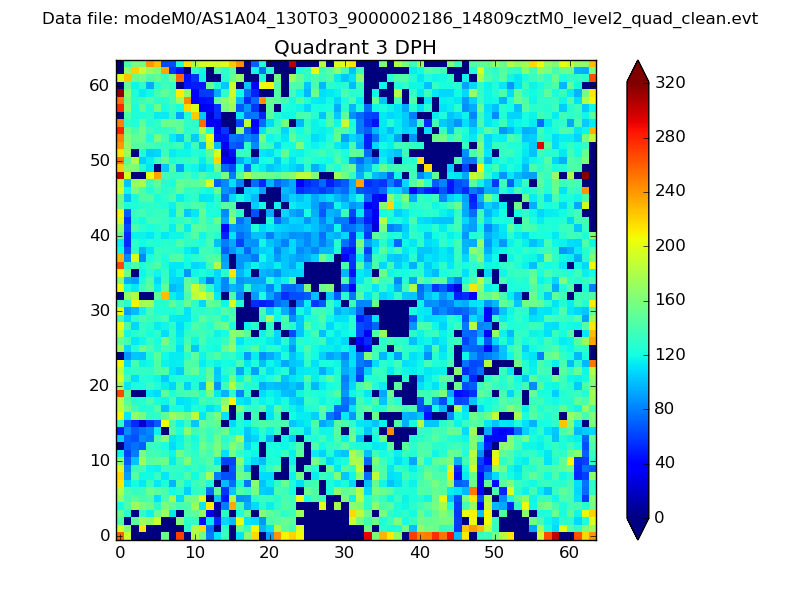 |
 |
Quadrant C |
| Plot type | Count rate plots | Images |
|---|---|---|
| Comparison with Poisson distribution Blue bars denote a histogram of data divided into 1 sec bins. Red curve is a Poisson curve with rate = median count rate of data. |
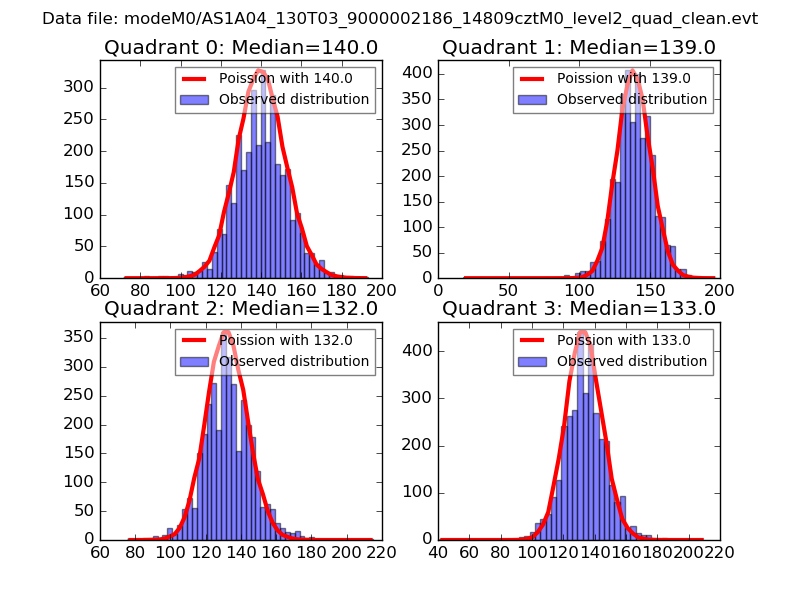 |
 |
| Quadrant-wise count rates Data is divided into 100 sec bins |
 |
|
| Module-wise count rates for Quadrant A Data is divided into 100 sec bins |
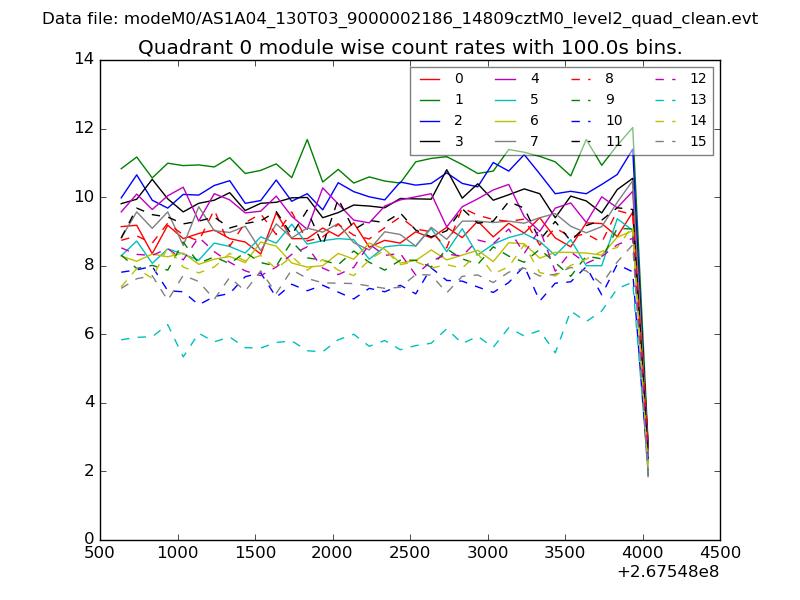 |
 |
| Module-wise count rates for Quadrant B Data is divided into 100 sec bins |
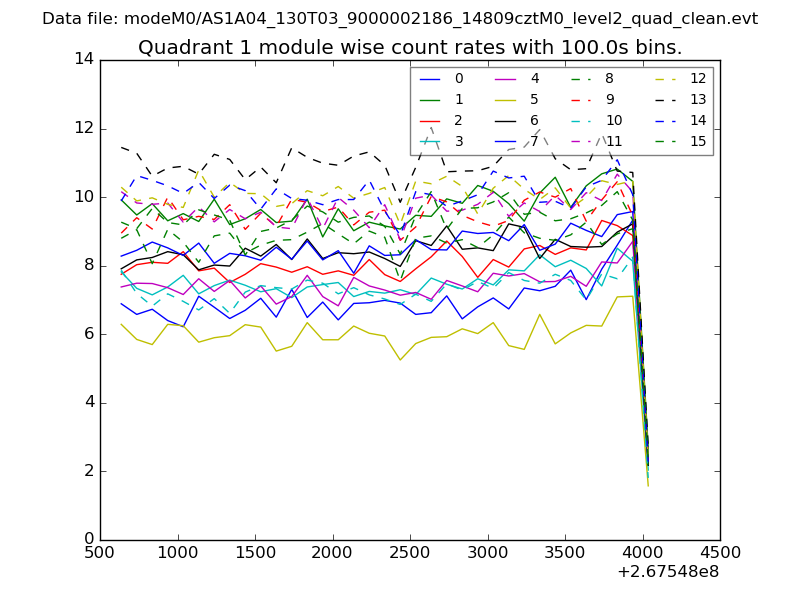 |
 |
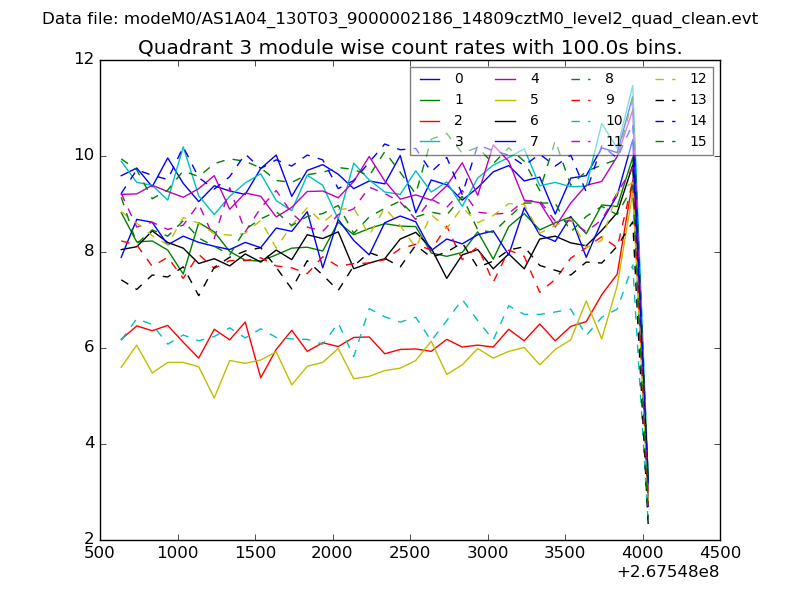
| Module-wise count rates for Quadrant C Data is divided into 100 sec bins |
 |
 |
| Module-wise count rates for Quadrant D Data is divided into 100 sec bins |
 |
 |
| Parameter | Plot |
|---|---|
| CZT HV Monitor |  |
| D_VDD | 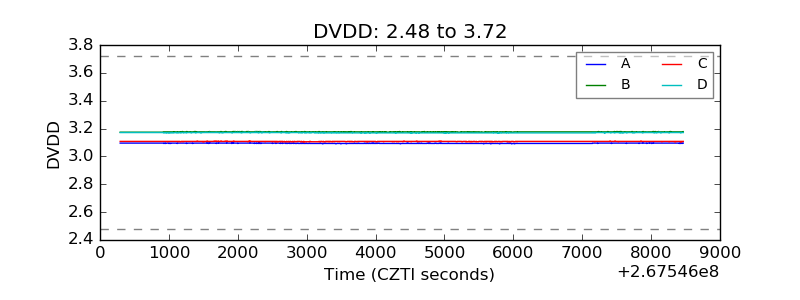 |
| Temperature 1 | 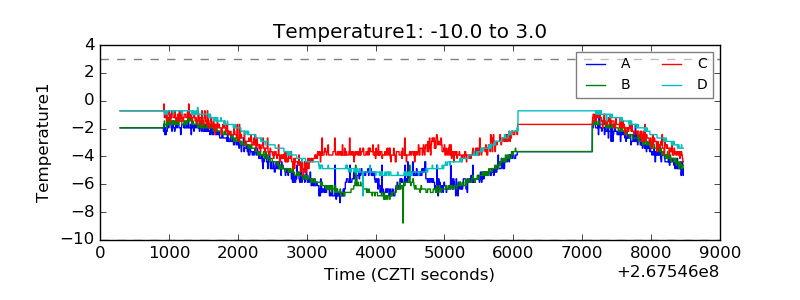 |
| Veto HV Monitor | 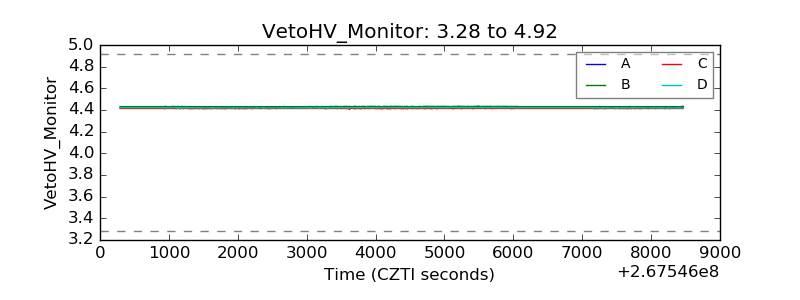 |
| Veto LLD | 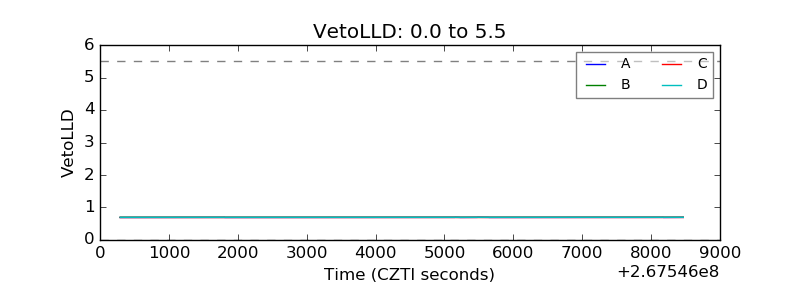 |
| Alpha Counter | 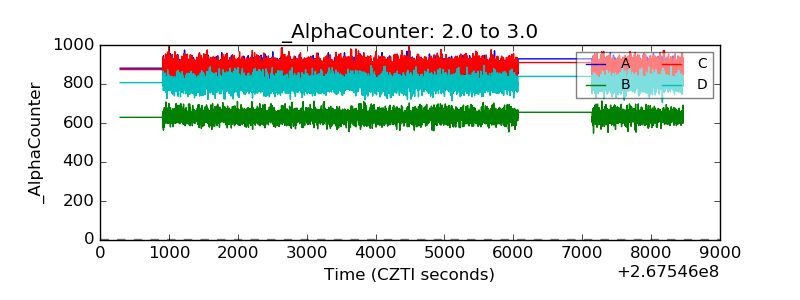 |
| _CPM_Rate | 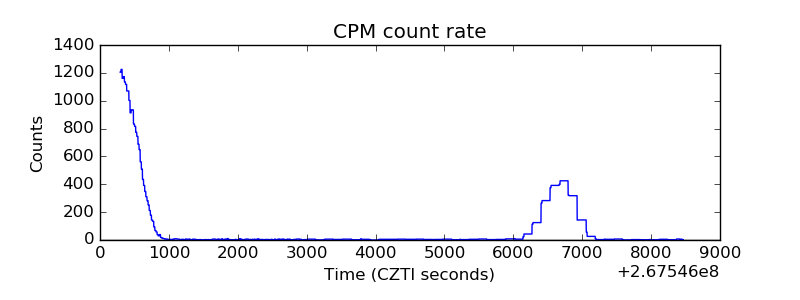 |
| CZT Counter | 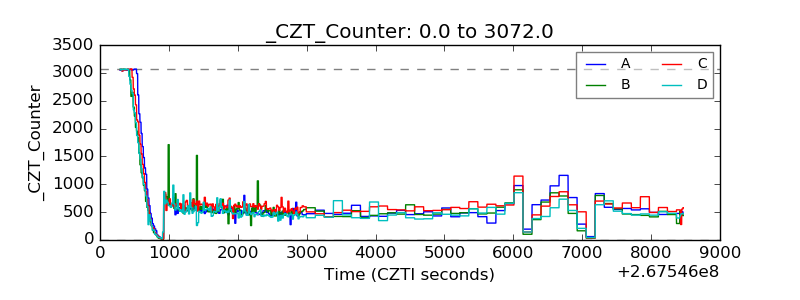 |
| +2.5 Volts monitor |  |
| +5 Volts monitor |  |
| _ROLL_ROT | 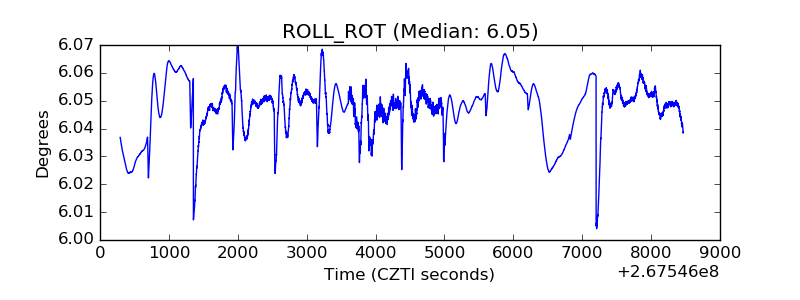 |
| _Roll_DEC | 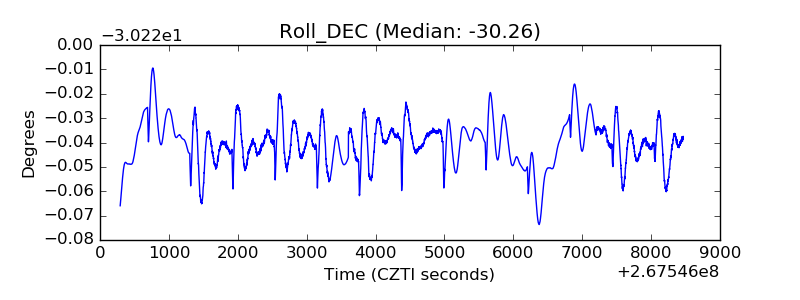 |
| _Roll_RA | 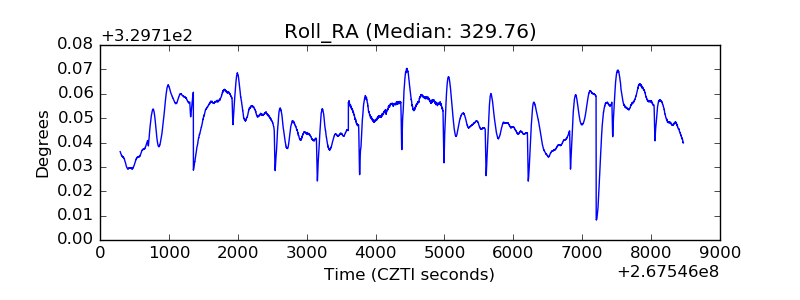 |
| Veto Counter | 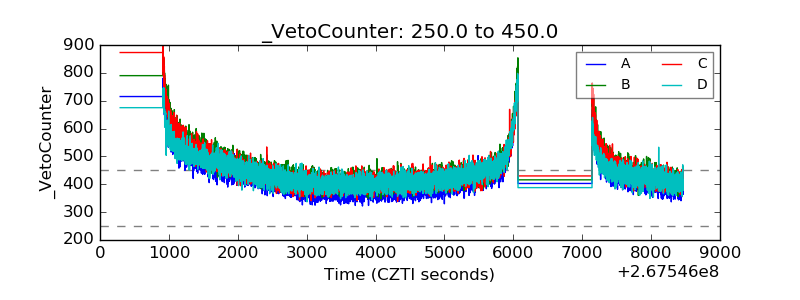 |