| Param | Original file | Final file |
|---|---|---|
| Filename | modeM0/AS1A04_130T03_9000002186_14810cztM0_level2.evt | modeM0/AS1A04_130T03_9000002186_14810cztM0_level2_quad_clean.evt |
| Size (bytes) | 141,220,800 | 17,493,120 |
| Size | 134.7 MB | 16.7 MB |
| Events in quadrant A | 992,681 | 98,760 |
| Events in quadrant B | 1,087,671 | 97,718 |
| Events in quadrant C | 1,121,444 | 92,492 |
| Events in quadrant D | 936,505 | 94,553 |
| Mode M0 | |||
|---|---|---|---|
| Quadrant | BADHDUFLAG | Total packets | Discarded packets |
| A | 0 | 4126 | 0 |
| B | 0 | 4384 | 0 |
| C | 0 | 4542 | 0 |
| D | 0 | 4091 | 0 |
| Mode SS | |||
|---|---|---|---|
| Quadrant | BADHDUFLAG | Total packets | Discarded packets |
| A | 0 | 40 | 0 |
| B | 0 | 40 | 0 |
| C | 0 | 40 | 0 |
| D | 0 | 40 | 0 |
| Quadrant | Total seconds | Saturated seconds | Saturation percentage |
|---|---|---|---|
| A | 2001 | 4 | 0.199900% |
| B | 2001 | 29 | 1.449275% |
| C | 2001 | 1 | 0.049975% |
| D | 2001 | 3 | 0.149925% |
Noise dominated data is calculated using 1-second bins in cleaned event files. If a bin has >2000 counts, and if more than 50% of those come from <1% of pixels, then it is considered to be noise-dominated and hence unusable.
| Quadrant | # 1 sec bins | Bins with >0 counts | Bins with >2000 counts | High rate bins dominated by noise | Noise dominated (total time) | Noise dominated (detector-on time) | Marked lightcurve |
|---|---|---|---|---|---|---|---|
| A | 2002 | 2002 | 0 | 0 | 0.00% | 0.00% | 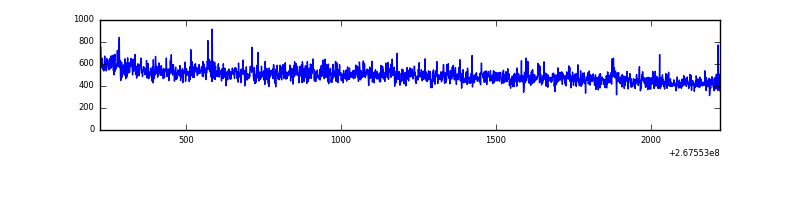 |
| B | 2002 | 2002 | 13 | 13 | 0.65% | 0.65% | 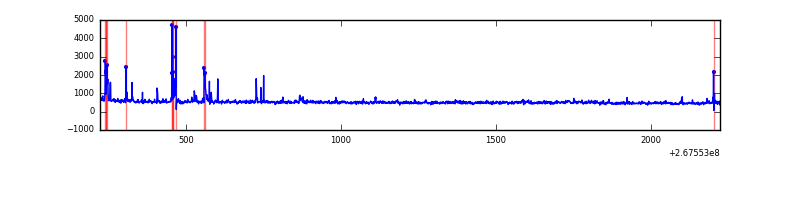 |
| C | 2002 | 2002 | 1 | 1 | 0.05% | 0.05% | 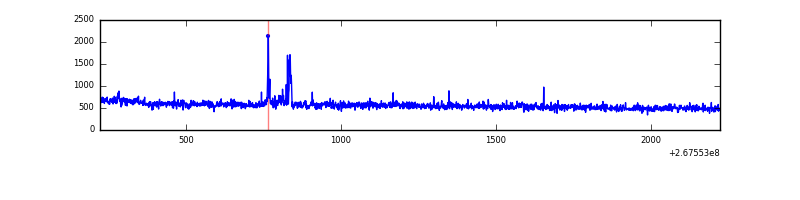 |
| D | 2002 | 2002 | 2 | 2 | 0.10% | 0.10% | 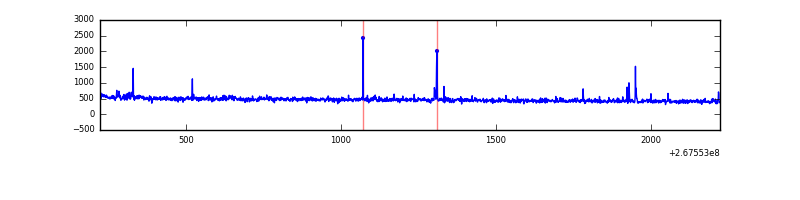 |
Top three noisy pixels from each quadrant. If the there are fewer than three noisy pixels in the level2.evt file, extra rows are filled as -1
| Pixel properties | Quadrant properties | ||||||
|---|---|---|---|---|---|---|---|
| Quadrant | DetID | PixID | Counts | Sigma | Mean | Median | Sigma |
| A | 12 | 189 | 24289 | 454.2 | 250 | 245 | 52.9 |
| A | 0 | 226 | 2356 | 39.88 | 250 | 245 | 52.9 |
| A | 14 | 237 | 2291 | 38.65 | 250 | 245 | 52.9 |
| B | 3 | 64 | 81458 | 1672.46 | 247 | 241 | 48.6 |
| B | 0 | 219 | 16409 | 332.94 | 247 | 241 | 48.6 |
| B | 15 | 35 | 6368 | 126.17 | 247 | 241 | 48.6 |
| C | 3 | 233 | 182262 | 3239.66 | 235 | 236 | 56.2 |
| C | 0 | 207 | 18469 | 324.51 | 235 | 236 | 56.2 |
| C | 13 | 61 | 1775 | 27.39 | 235 | 236 | 56.2 |
| D | 10 | 199 | 19951 | 328.56 | 238 | 231 | 60.0 |
| D | 2 | 234 | 7017 | 113.06 | 238 | 231 | 60.0 |
| D | 2 | 120 | 6099 | 97.77 | 238 | 231 | 60.0 |
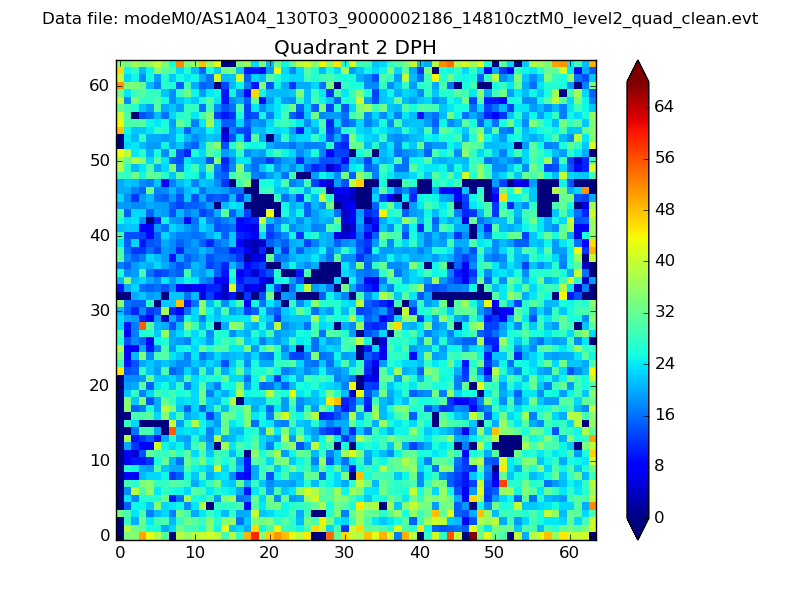
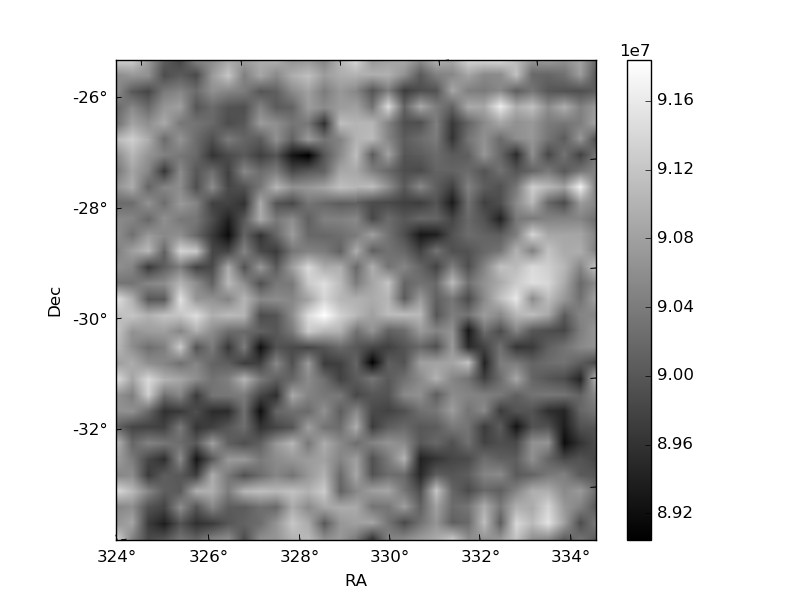
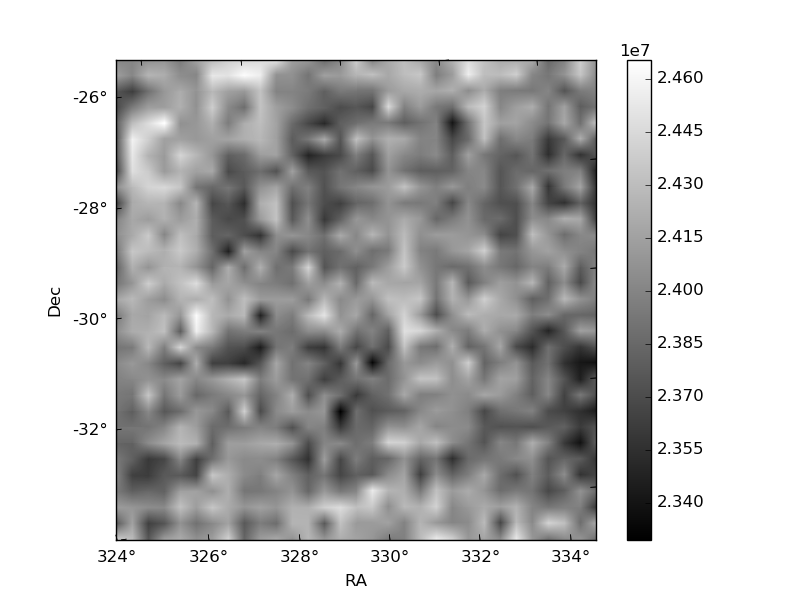
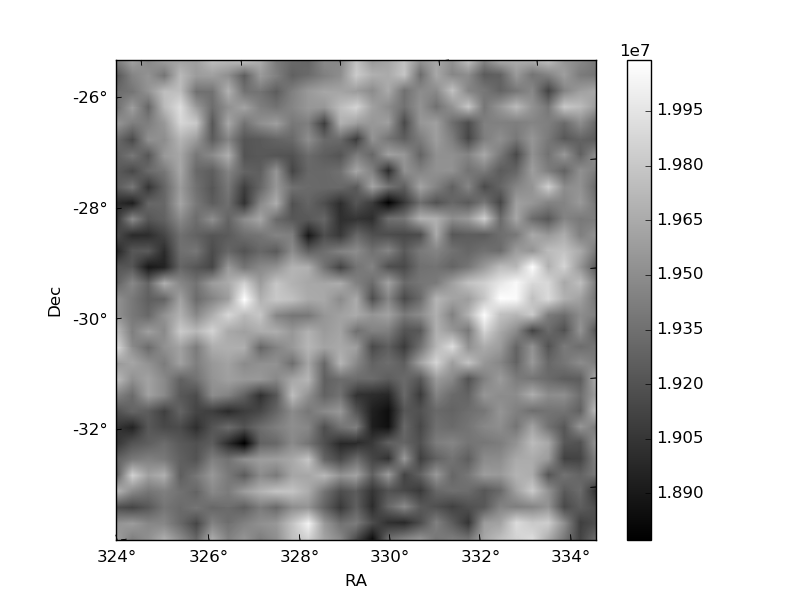
Histogram calculated using DETX and DETY for each event in the final _common_clean file
| Quadrant A | 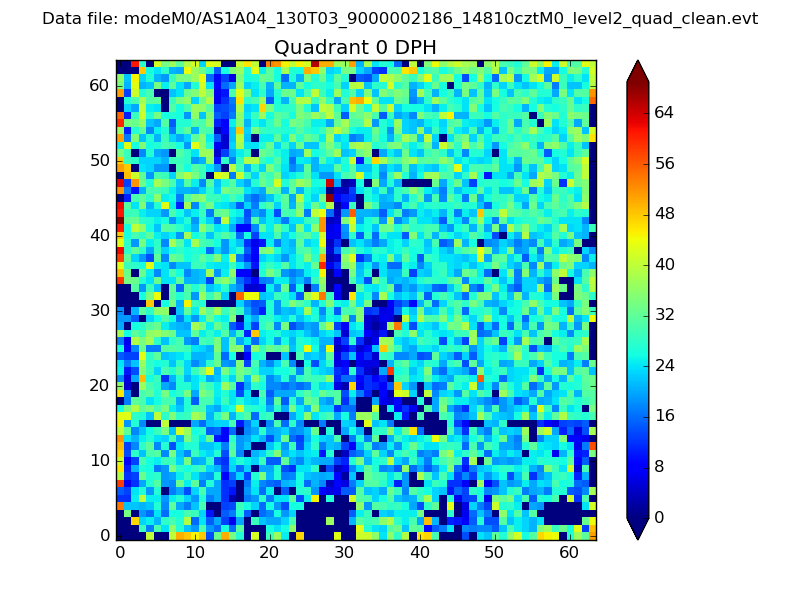 |
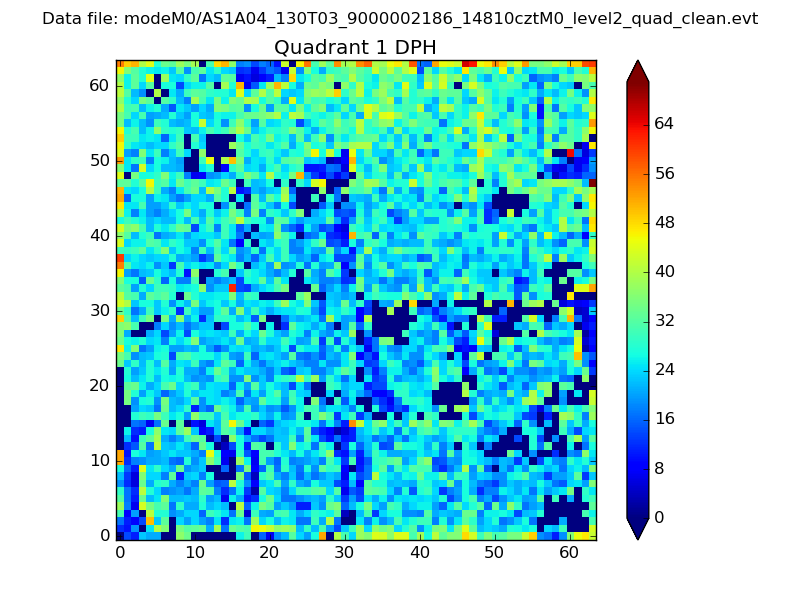 |
Quadrant B |
|---|---|---|---|
| Quadrant D | 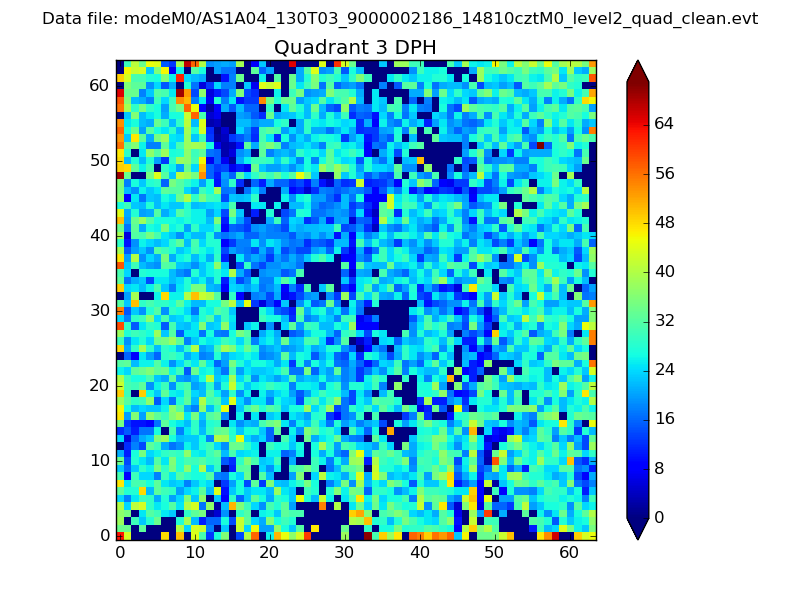 |
 |
Quadrant C |
| Plot type | Count rate plots | Images |
|---|---|---|
| Comparison with Poisson distribution Blue bars denote a histogram of data divided into 1 sec bins. Red curve is a Poisson curve with rate = median count rate of data. |
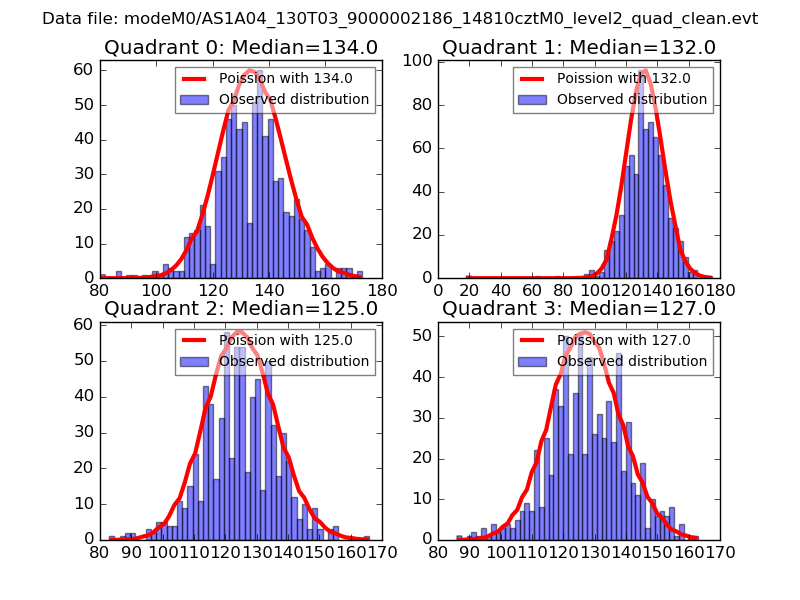 |
 |
| Quadrant-wise count rates Data is divided into 100 sec bins |
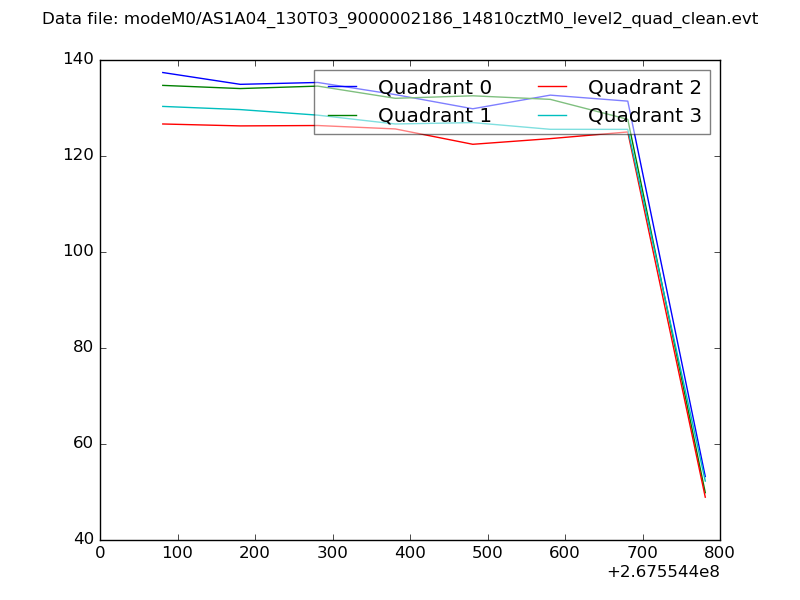 |
|
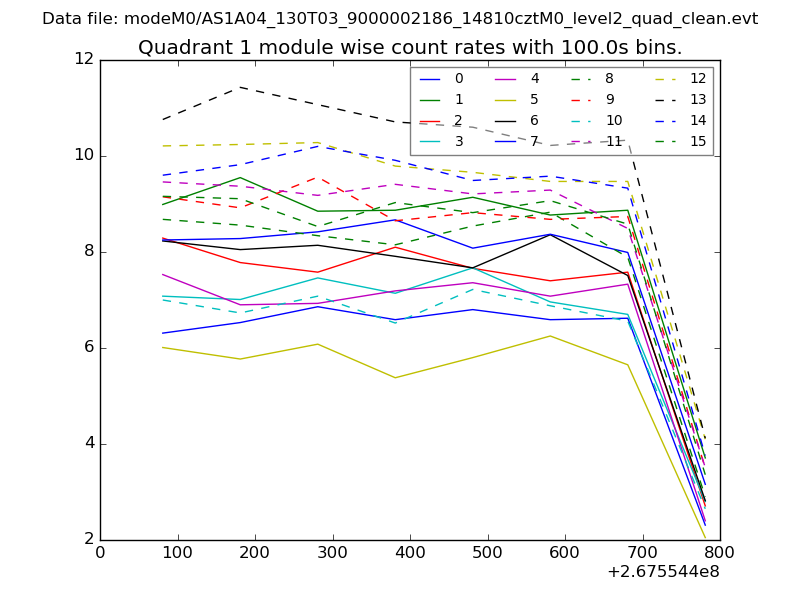
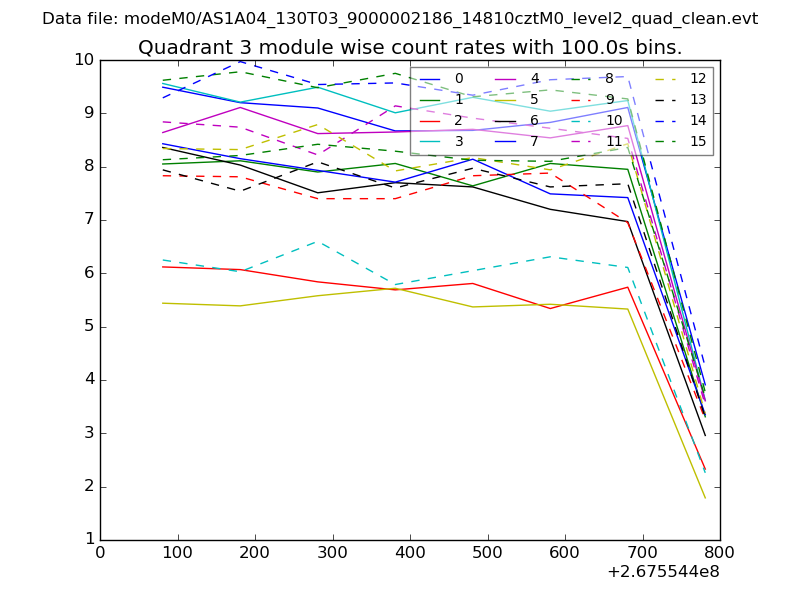
| Module-wise count rates for Quadrant A Data is divided into 100 sec bins |
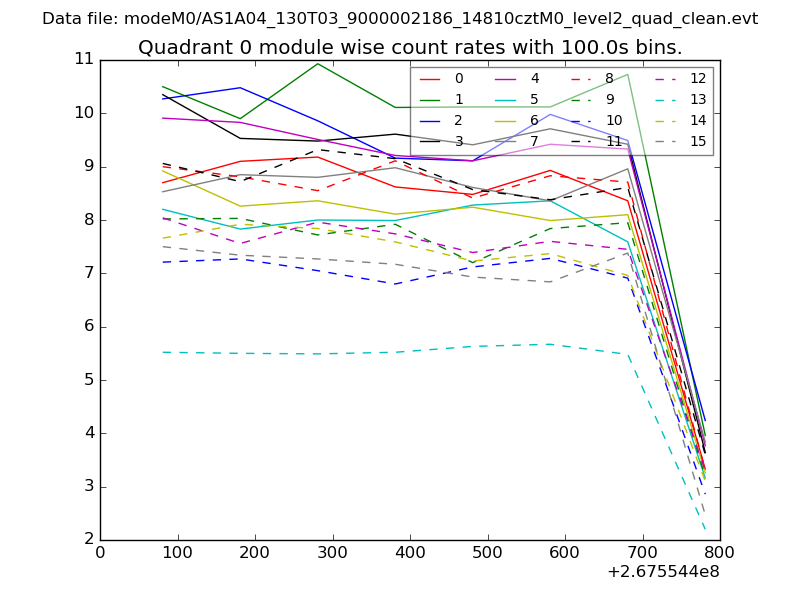 |
 |
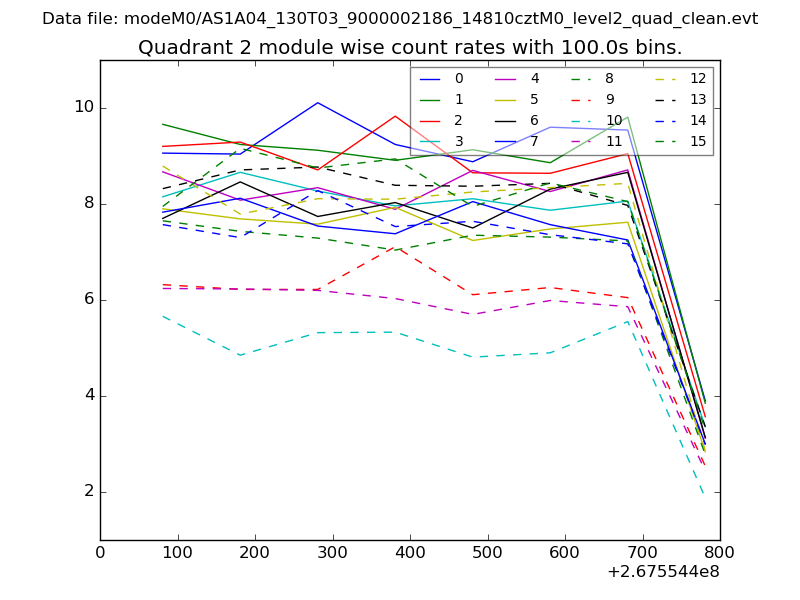
| Module-wise count rates for Quadrant B Data is divided into 100 sec bins |
 |
 |
| Module-wise count rates for Quadrant C Data is divided into 100 sec bins |
 |
 |
| Module-wise count rates for Quadrant D Data is divided into 100 sec bins |
 |
 |
| Parameter | Plot |
|---|---|
| CZT HV Monitor | 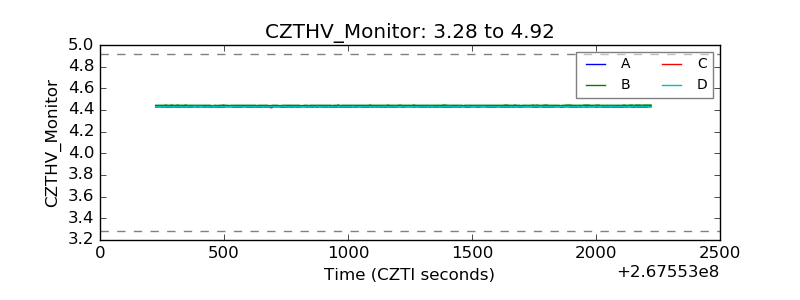 |
| D_VDD | 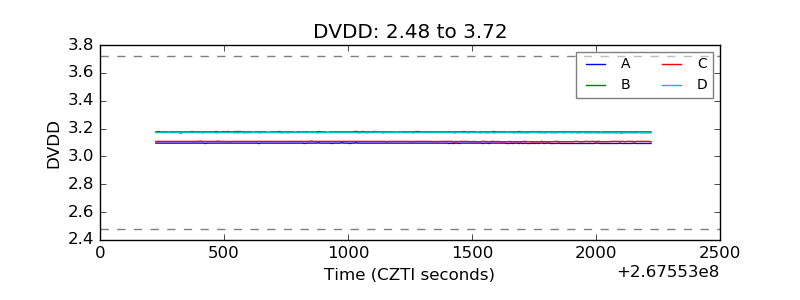 |
| Temperature 1 | 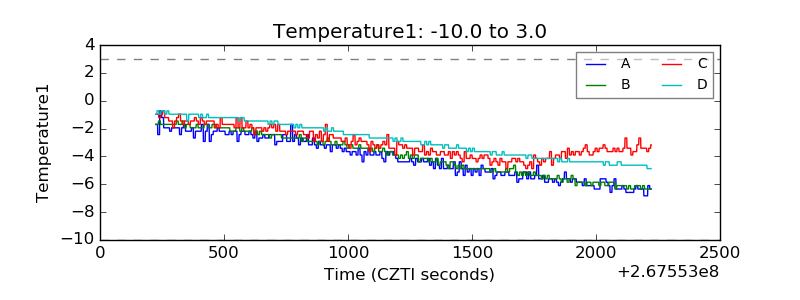 |
| Veto HV Monitor | 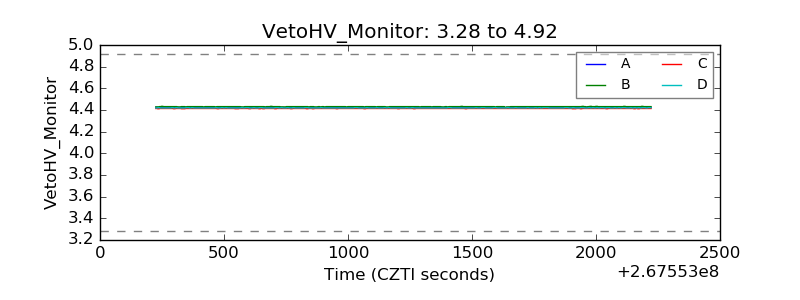 |
| Veto LLD | 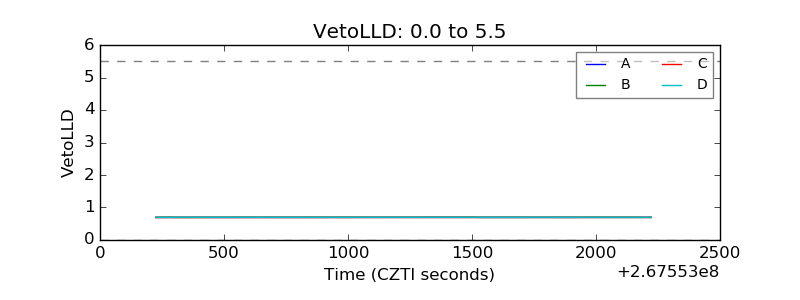 |
| Alpha Counter | 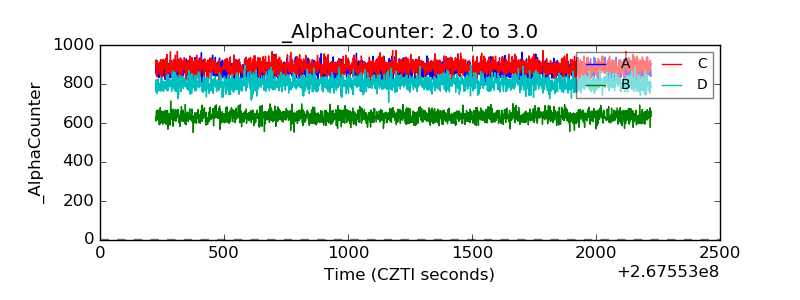 |
| _CPM_Rate | 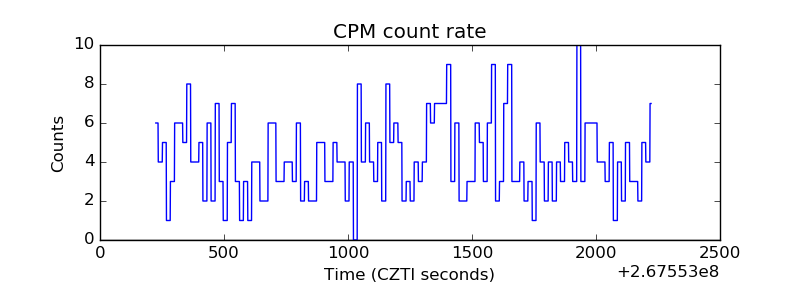 |
| CZT Counter | 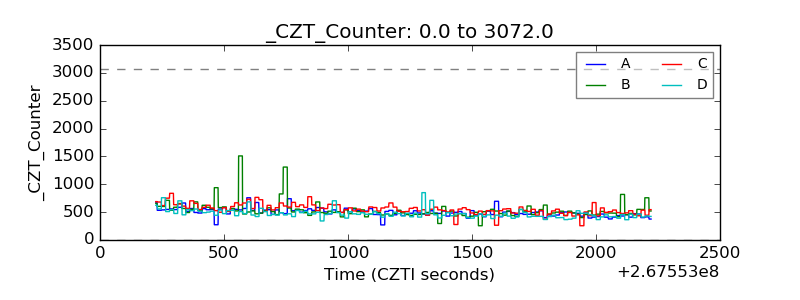 |
| +2.5 Volts monitor |  |
| +5 Volts monitor |  |
| _ROLL_ROT | 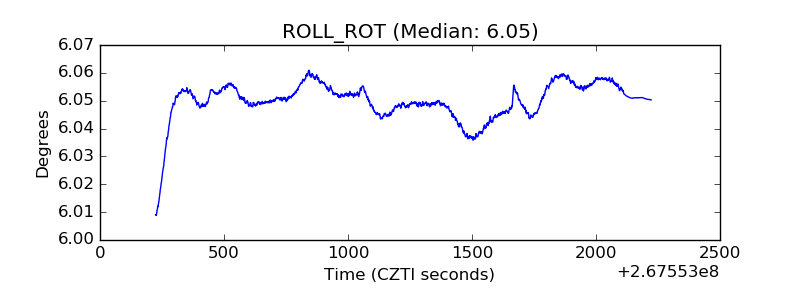 |
| _Roll_DEC |  |
| _Roll_RA | 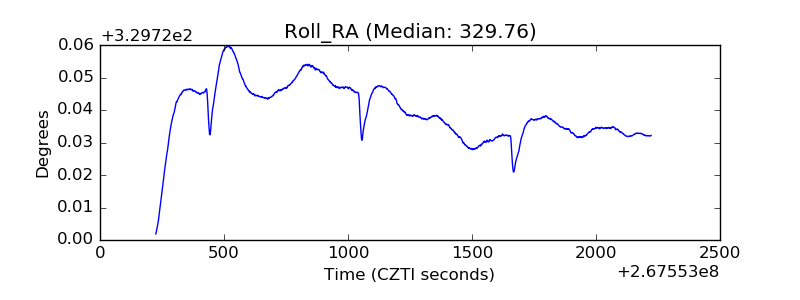 |
| Veto Counter | 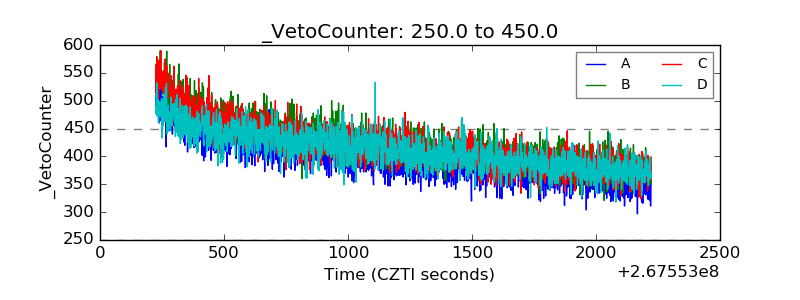 |