| Param | Original file | Final file |
|---|---|---|
| Filename | modeM0/AS1G08_010T02_9000002188cztM0_level2.fits | modeM0/AS1G08_010T02_9000002188cztM0_level2_quad_clean.evt |
| Size (bytes) | 793,693,440 | 726,935,040 |
| Size | 756.9 MB | 693.3 MB |
| Events in quadrant A | 4,926,158 | 4,366,015 |
| Events in quadrant B | 4,611,432 | 4,238,439 |
| Events in quadrant C | 4,706,298 | 3,991,594 |
| Events in quadrant D | 4,185,354 | 3,812,624 |
| Mode M9 | |||
|---|---|---|---|
| Quadrant | BADHDUFLAG | Total packets | Discarded packets |
| A | 0 | 113 | 0 |
| B | 0 | 113 | 0 |
| C | 0 | 113 | 0 |
| D | 0 | 113 | 0 |
| Mode M0 | |||
|---|---|---|---|
| Quadrant | BADHDUFLAG | Total packets | Discarded packets |
| A | 0 | 175534 | 0 |
| B | 0 | 193008 | 0 |
| C | 0 | 191504 | 0 |
| D | 0 | 186701 | 0 |
| Mode SS | |||
|---|---|---|---|
| Quadrant | BADHDUFLAG | Total packets | Discarded packets |
| A | 0 | 1664 | 0 |
| B | 0 | 1664 | 0 |
| C | 0 | 1664 | 0 |
| D | 0 | 1664 | 0 |
| Quadrant | Total seconds | Saturated seconds | Saturation percentage |
|---|---|---|---|
| A | 81778 | 886 | 1.083421% |
| B | 81778 | 2903 | 3.549854% |
| C | 81778 | 2312 | 2.827166% |
| D | 81778 | 1931 | 2.361271% |
Noise dominated data is calculated using 1-second bins in cleaned event files. If a bin has >2000 counts, and if more than 50% of those come from <1% of pixels, then it is considered to be noise-dominated and hence unusable.
| Quadrant | # 1 sec bins | Bins with >0 counts | Bins with >2000 counts | High rate bins dominated by noise | Noise dominated (total time) | Noise dominated (detector-on time) | Marked lightcurve |
|---|---|---|---|---|---|---|---|
| A | 98252 | 81780 | 0 | 0 | 0.00% | 0.00% | 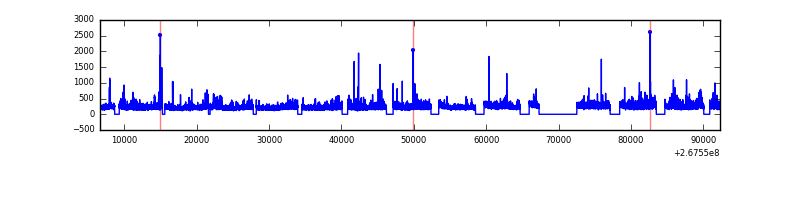 |
| B | 98252 | 81725 | 0 | 0 | 0.00% | 0.00% | 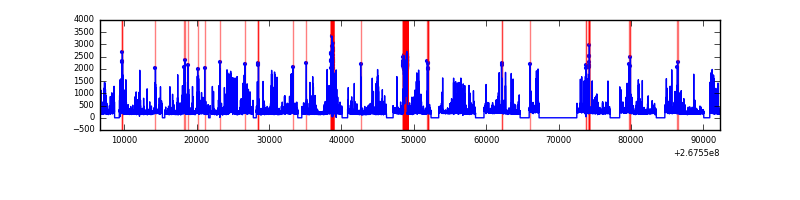 |
| C | 98252 | 81720 | 0 | 0 | 0.00% | 0.00% | 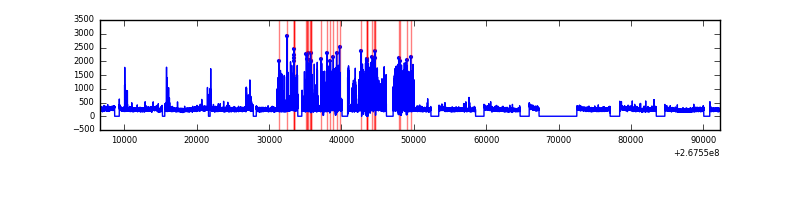 |
| D | 98252 | 81775 | 0 | 0 | 0.00% | 0.00% | 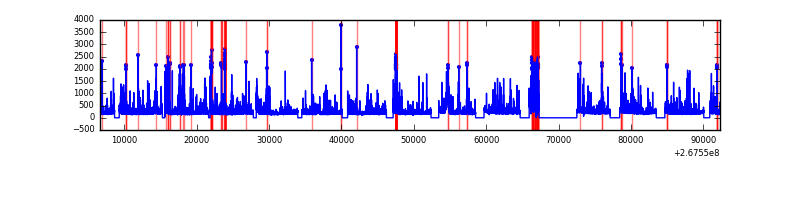 |
Top three noisy pixels from each quadrant. If the there are fewer than three noisy pixels in the level2.evt file, extra rows are filled as -1
| Pixel properties | Quadrant properties | ||||||
|---|---|---|---|---|---|---|---|
| Quadrant | DetID | PixID | Counts | Sigma | Mean | Median | Sigma |
| A | 0 | 29 | 4707 | 11.08 | 1283 | 1203 | 316.2 |
| A | 7 | 110 | 3812 | 8.25 | 1283 | 1203 | 316.2 |
| A | 15 | 236 | 3662 | 7.78 | 1283 | 1203 | 316.2 |
| B | 2 | 9 | 3915 | 11.41 | 1221 | 1163 | 241.2 |
| B | 5 | 128 | 3011 | 7.66 | 1221 | 1163 | 241.2 |
| B | 14 | 254 | 2989 | 7.57 | 1221 | 1163 | 241.2 |
| C | 12 | 241 | 3223 | 6.4 | 1245 | 1155 | 323.3 |
| C | 3 | 126 | 3223 | 6.4 | 1245 | 1155 | 323.3 |
| C | 3 | 158 | 3143 | 6.15 | 1245 | 1155 | 323.3 |
| D | 6 | 231 | 3026 | 6.05 | 1194 | 1085 | 320.7 |
| D | 10 | 189 | 2985 | 5.92 | 1194 | 1085 | 320.7 |
| D | 3 | 14 | 2922 | 5.73 | 1194 | 1085 | 320.7 |
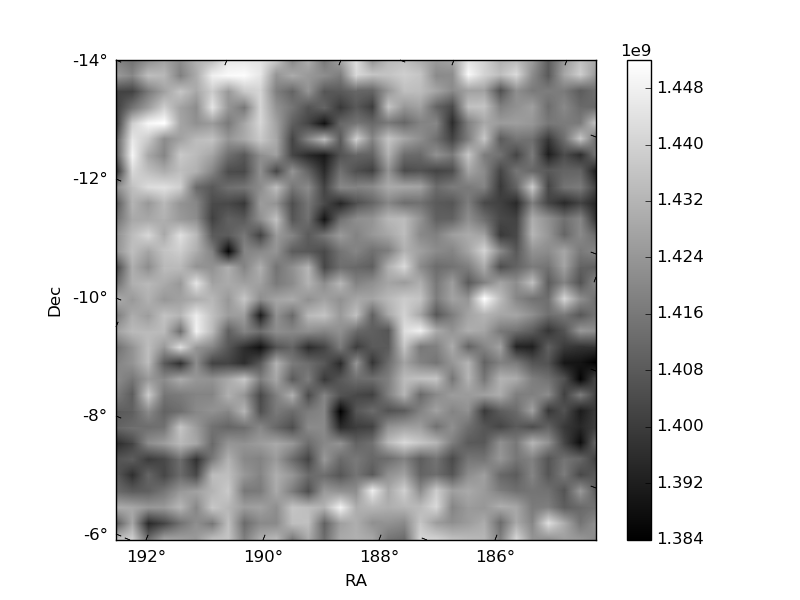
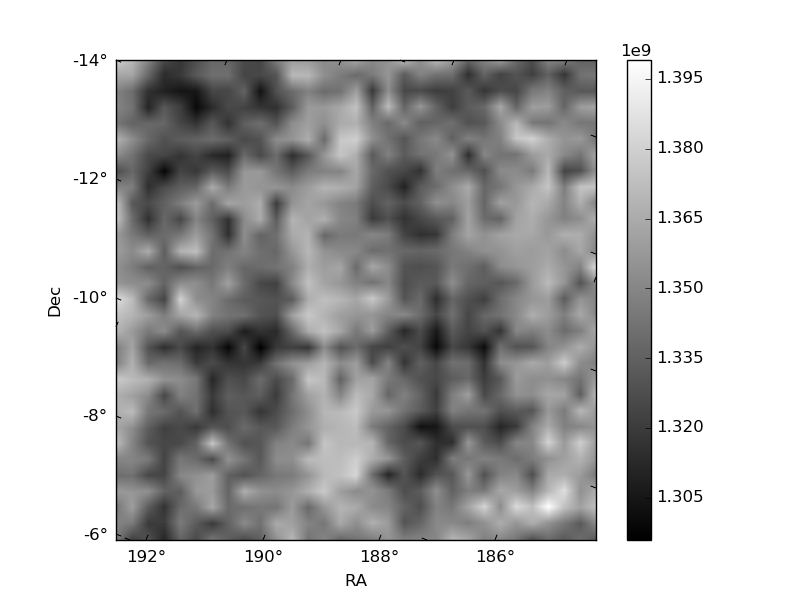
Histogram calculated using DETX and DETY for each event in the final _common_clean file
| Quadrant A | 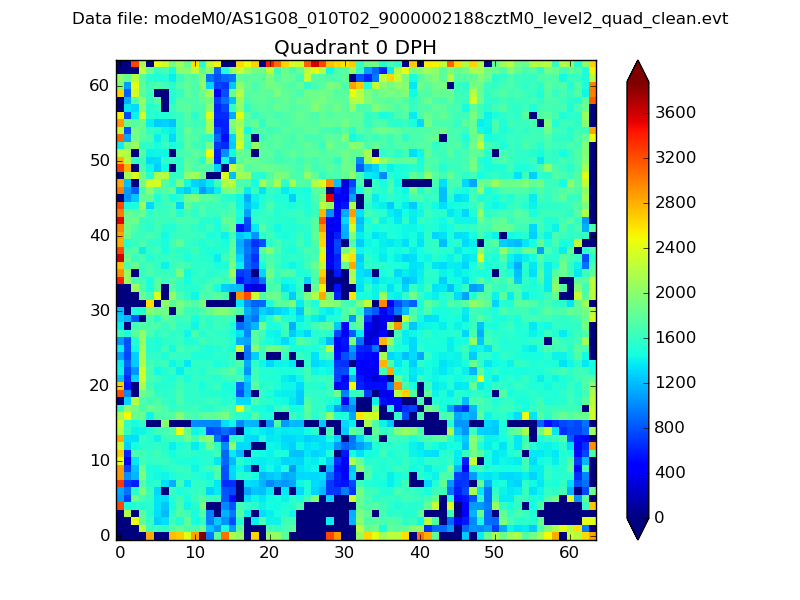 |
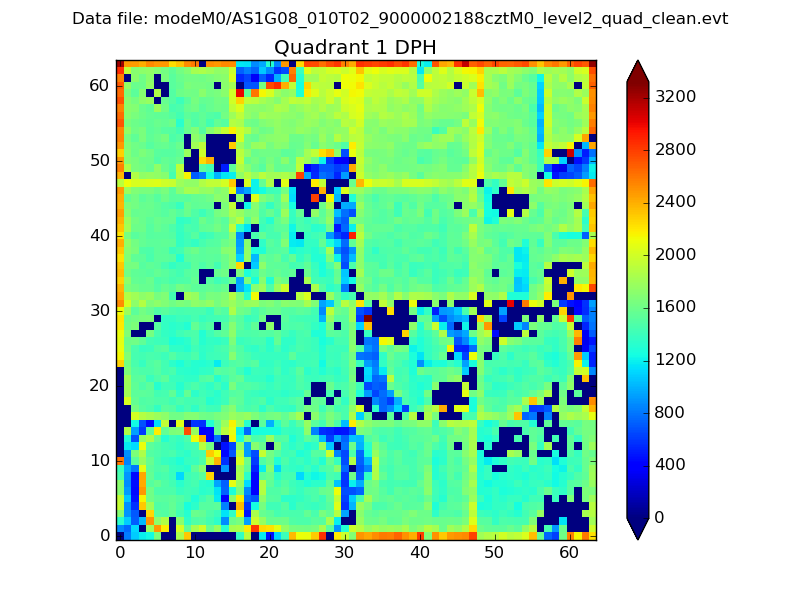 |
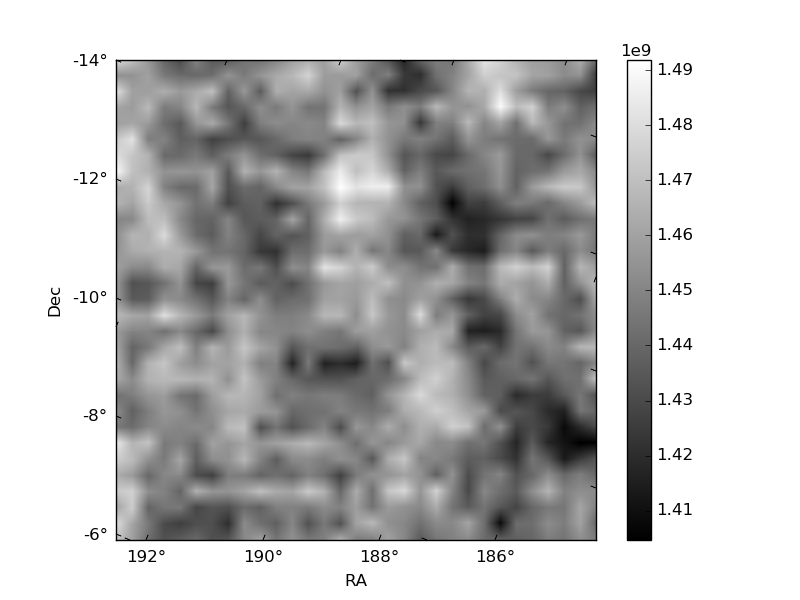
Quadrant B |
|---|---|---|---|
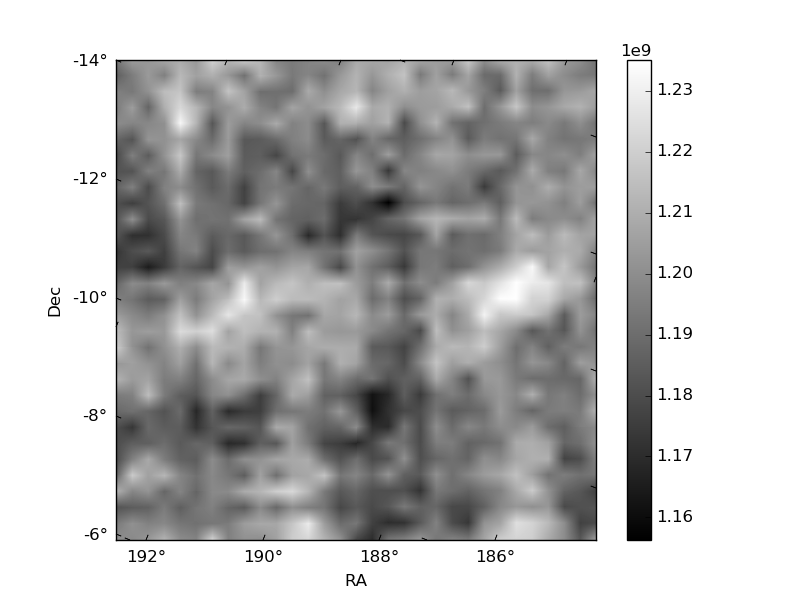
| Quadrant D | 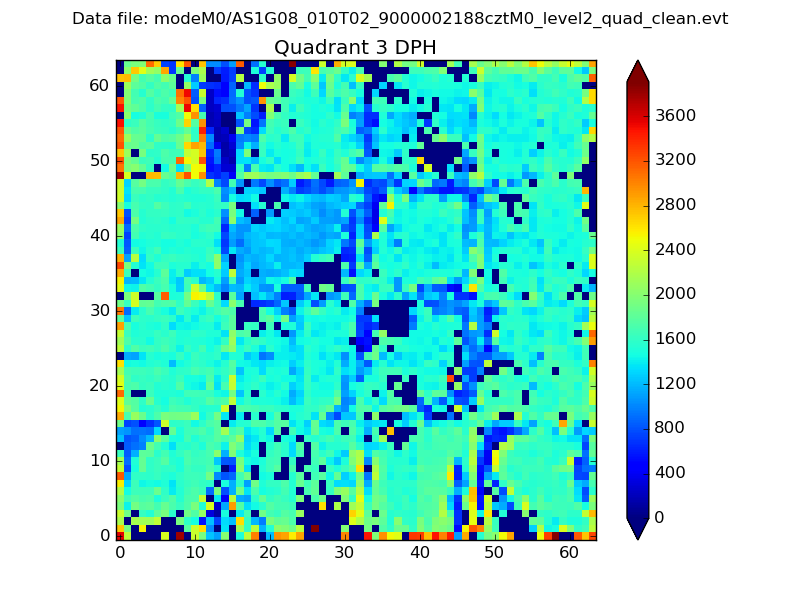 |
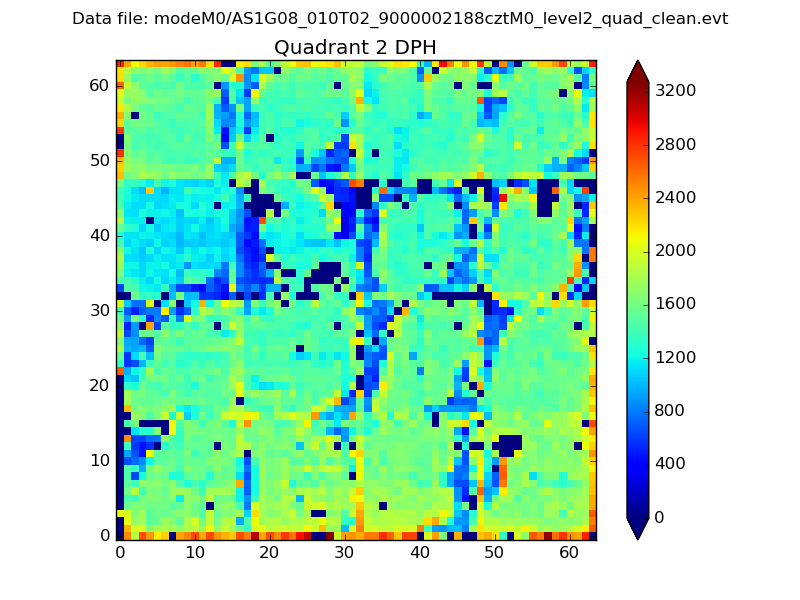 |
Quadrant C |
| Plot type | Count rate plots | Images |
|---|---|---|
| Comparison with Poisson distribution Blue bars denote a histogram of data divided into 1 sec bins. Red curve is a Poisson curve with rate = median count rate of data. |
 |
 |
| Quadrant-wise count rates Data is divided into 100 sec bins |
 |
|
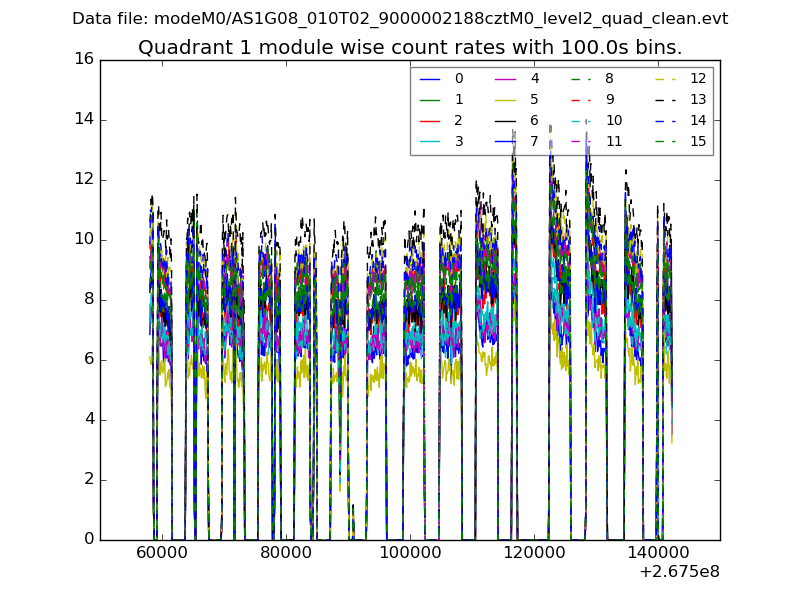
| Module-wise count rates for Quadrant A Data is divided into 100 sec bins |
 |
 |
| Module-wise count rates for Quadrant B Data is divided into 100 sec bins |
 |
 |
| Module-wise count rates for Quadrant C Data is divided into 100 sec bins |
 |
 |
| Module-wise count rates for Quadrant D Data is divided into 100 sec bins |
 |
 |
| Parameter | Plot |
|---|---|
| CZT HV Monitor | 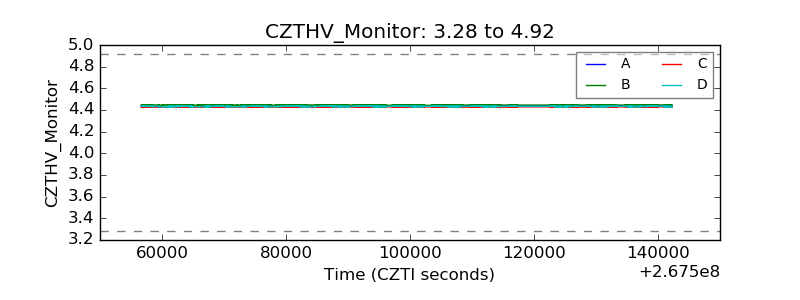 |
| D_VDD | 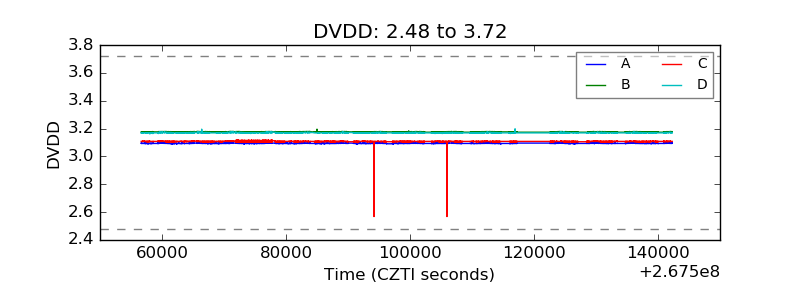 |
| Temperature 1 |  |
| Veto HV Monitor | 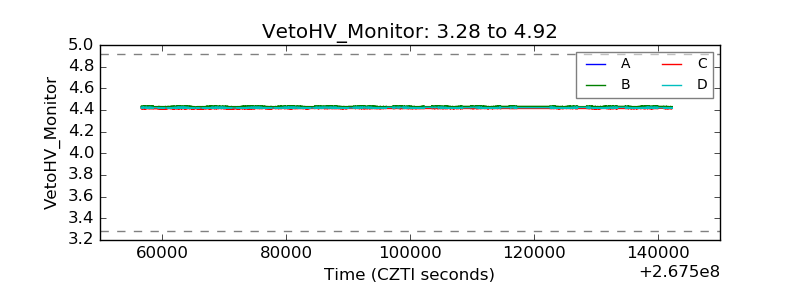 |
| Veto LLD | 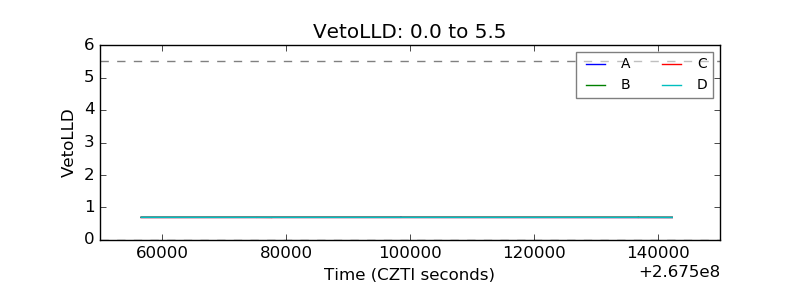 |
| Alpha Counter |  |
| _CPM_Rate | 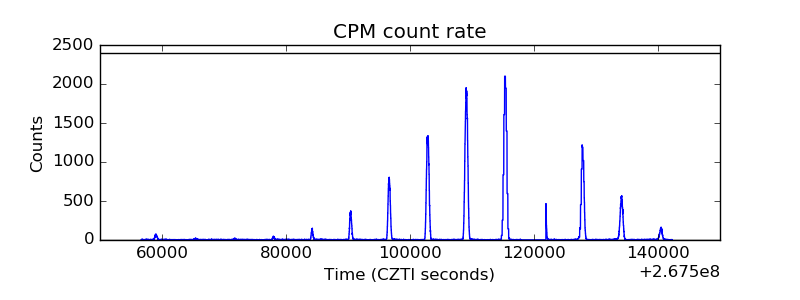 |
| CZT Counter | 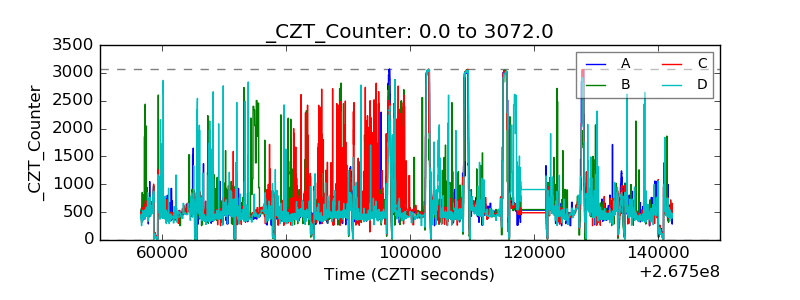 |
| +2.5 Volts monitor | 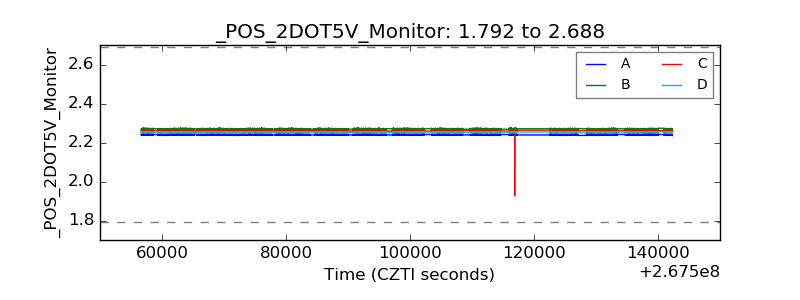 |
| +5 Volts monitor | 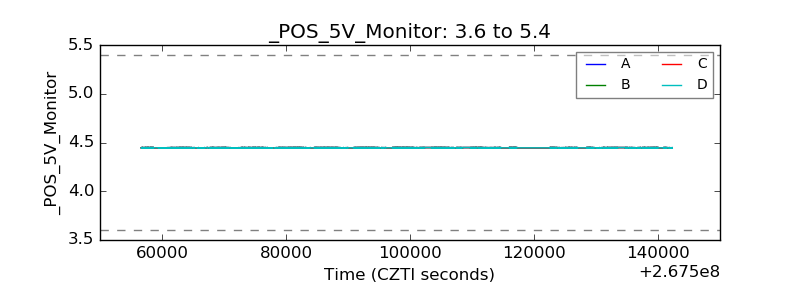 |
| _ROLL_ROT | 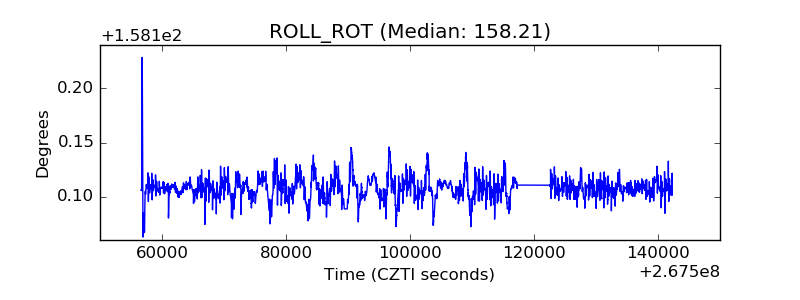 |
| _Roll_DEC |  |
| _Roll_RA | 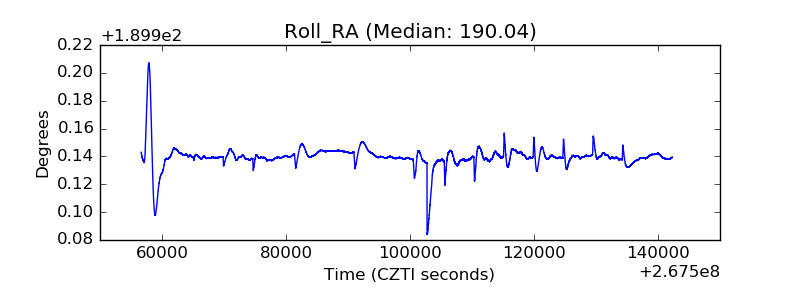 |
| Veto Counter | 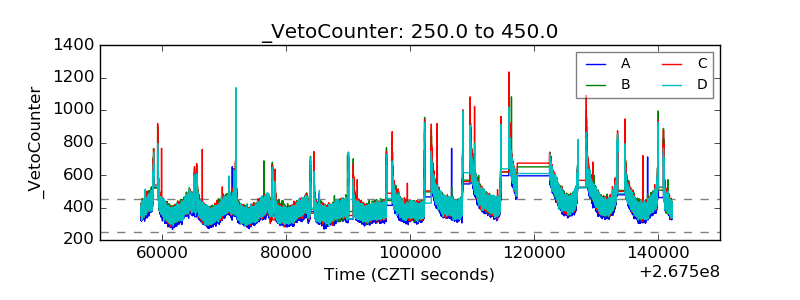 |