| Param | Original file | Final file |
|---|---|---|
| Filename | modeM0/AS1G08_010T02_9000002188_14810cztM0_level2.evt | modeM0/AS1G08_010T02_9000002188_14810cztM0_level2_quad_clean.evt |
| Size (bytes) | 270,947,520 | 45,875,520 |
| Size | 258.4 MB | 43.8 MB |
| Events in quadrant A | 1,867,746 | 292,917 |
| Events in quadrant B | 2,170,300 | 286,660 |
| Events in quadrant C | 2,066,774 | 282,507 |
| Events in quadrant D | 1,860,197 | 277,349 |
| Mode M9 | |||
|---|---|---|---|
| Quadrant | BADHDUFLAG | Total packets | Discarded packets |
| A | 0 | 7 | 0 |
| B | 0 | 7 | 0 |
| C | 0 | 7 | 0 |
| D | 0 | 7 | 0 |
| Mode M0 | |||
|---|---|---|---|
| Quadrant | BADHDUFLAG | Total packets | Discarded packets |
| A | 0 | 7658 | 2 |
| B | 0 | 8603 | 1 |
| C | 0 | 8332 | 1 |
| D | 0 | 7823 | 1 |
| Mode SS | |||
|---|---|---|---|
| Quadrant | BADHDUFLAG | Total packets | Discarded packets |
| A | 0 | 72 | 0 |
| B | 0 | 72 | 0 |
| C | 0 | 72 | 0 |
| D | 0 | 72 | 0 |
| Quadrant | Total seconds | Saturated seconds | Saturation percentage |
|---|---|---|---|
| A | 3522 | 62 | 1.760363% |
| B | 3522 | 204 | 5.792164% |
| C | 3522 | 49 | 1.391255% |
| D | 3522 | 54 | 1.533220% |
Noise dominated data is calculated using 1-second bins in cleaned event files. If a bin has >2000 counts, and if more than 50% of those come from <1% of pixels, then it is considered to be noise-dominated and hence unusable.
| Quadrant | # 1 sec bins | Bins with >0 counts | Bins with >2000 counts | High rate bins dominated by noise | Noise dominated (total time) | Noise dominated (detector-on time) | Marked lightcurve |
|---|---|---|---|---|---|---|---|
| A | 4168 | 3524 | 0 | 0 | 0.00% | 0.00% | 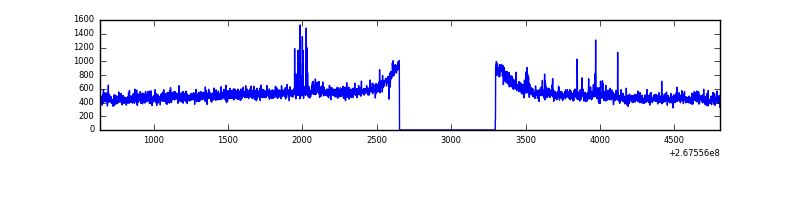 |
| B | 4168 | 3524 | 50 | 50 | 1.20% | 1.42% | 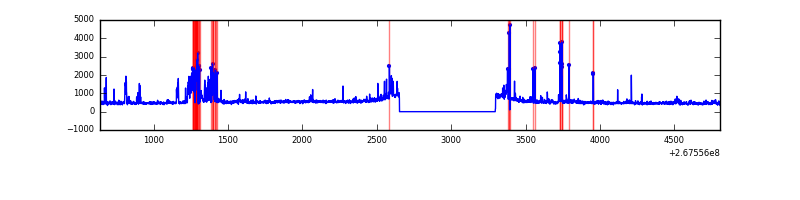 |
| C | 4168 | 3524 | 6 | 6 | 0.14% | 0.17% | 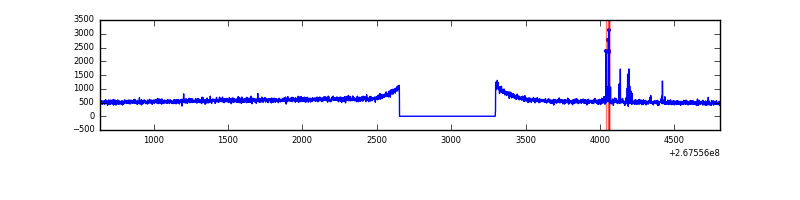 |
| D | 4168 | 3524 | 22 | 22 | 0.53% | 0.62% | 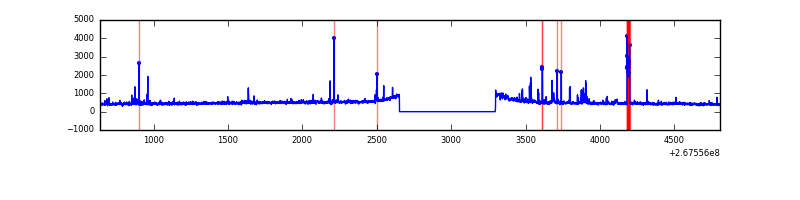 |
Top three noisy pixels from each quadrant. If the there are fewer than three noisy pixels in the level2.evt file, extra rows are filled as -1
| Pixel properties | Quadrant properties | ||||||
|---|---|---|---|---|---|---|---|
| Quadrant | DetID | PixID | Counts | Sigma | Mean | Median | Sigma |
| A | 12 | 189 | 54357 | 555.9 | 469 | 457 | 97.0 |
| A | 14 | 237 | 6998 | 67.46 | 469 | 457 | 97.0 |
| A | 0 | 226 | 4150 | 38.09 | 469 | 457 | 97.0 |
| B | 15 | 222 | 193750 | 2125.59 | 458 | 447 | 90.9 |
| B | 3 | 64 | 86883 | 950.46 | 458 | 447 | 90.9 |
| B | 4 | 173 | 50167 | 546.73 | 458 | 447 | 90.9 |
| C | 3 | 233 | 279489 | 2611.14 | 449 | 451 | 106.9 |
| C | 0 | 207 | 36800 | 340.14 | 449 | 451 | 106.9 |
| C | 13 | 61 | 3257 | 26.26 | 449 | 451 | 106.9 |
| D | 7 | 254 | 86799 | 701.45 | 448 | 437 | 123.1 |
| D | 13 | 249 | 27508 | 219.87 | 448 | 437 | 123.1 |
| D | 10 | 70 | 16522 | 130.64 | 448 | 437 | 123.1 |
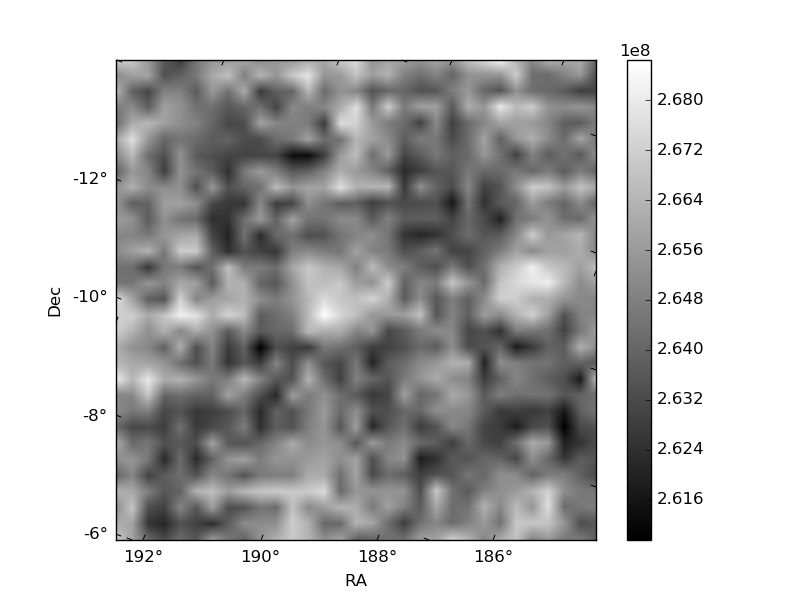
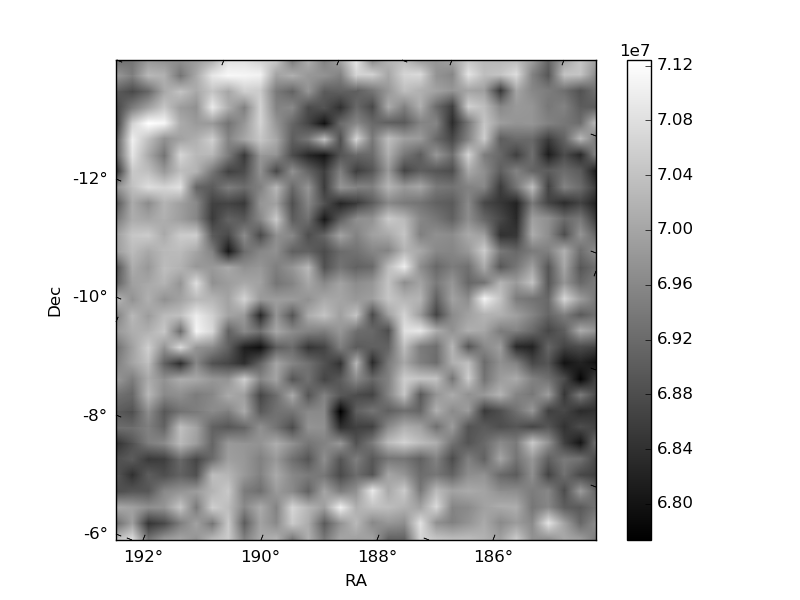
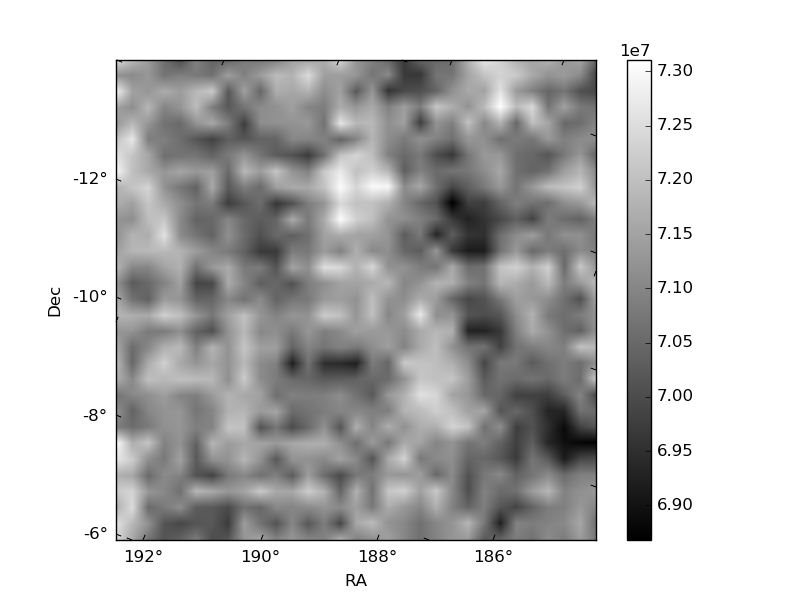
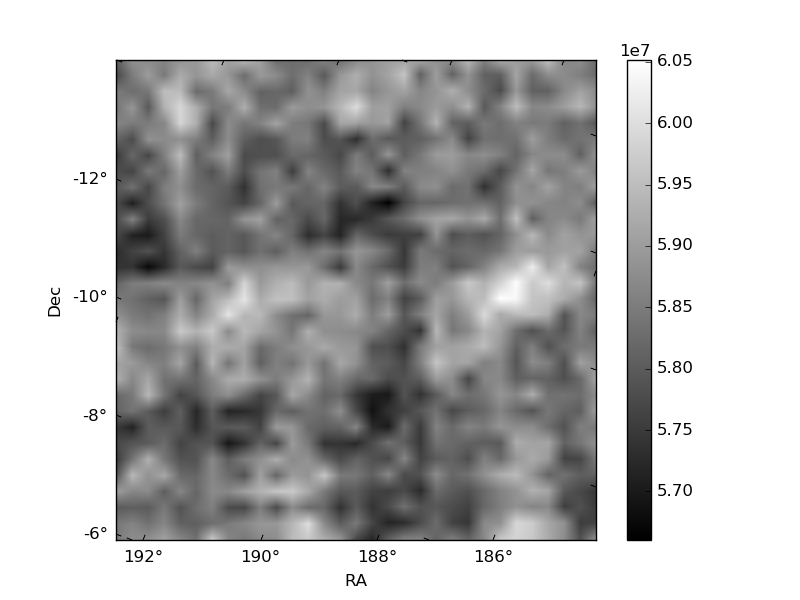
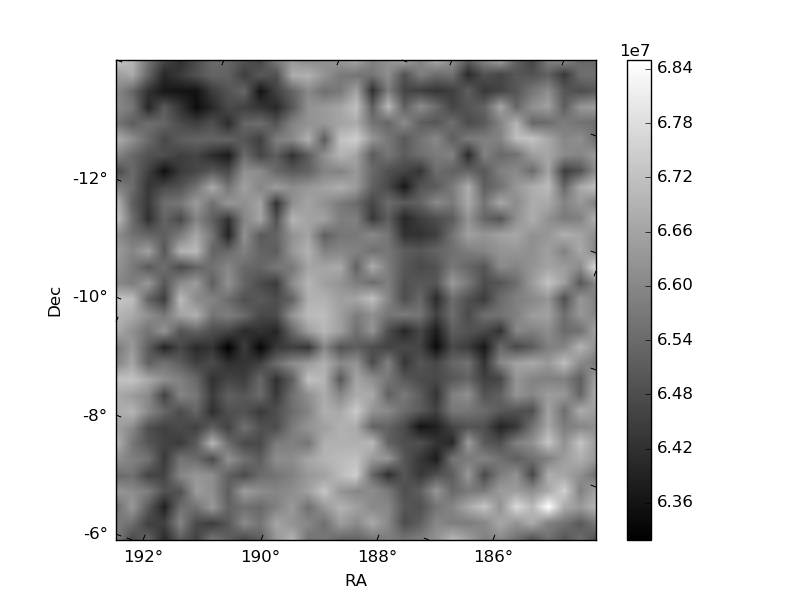
Histogram calculated using DETX and DETY for each event in the final _common_clean file
| Quadrant A | 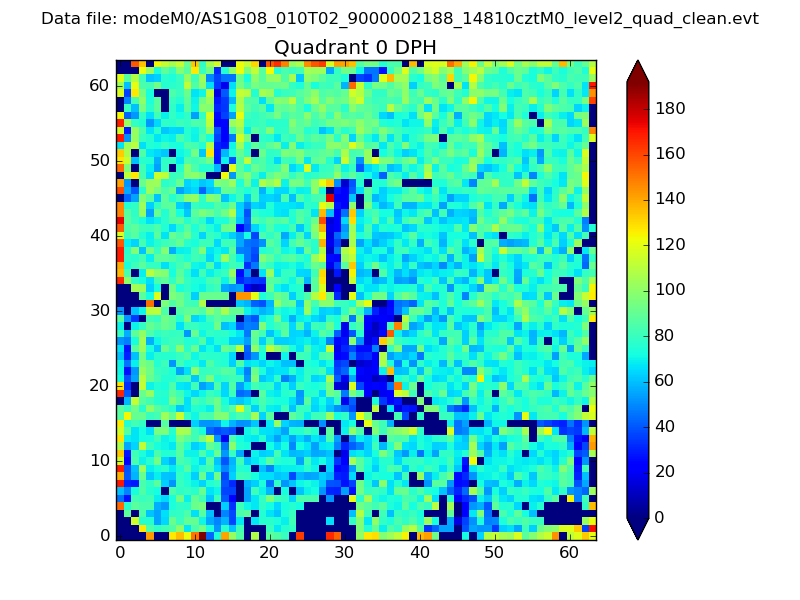 |
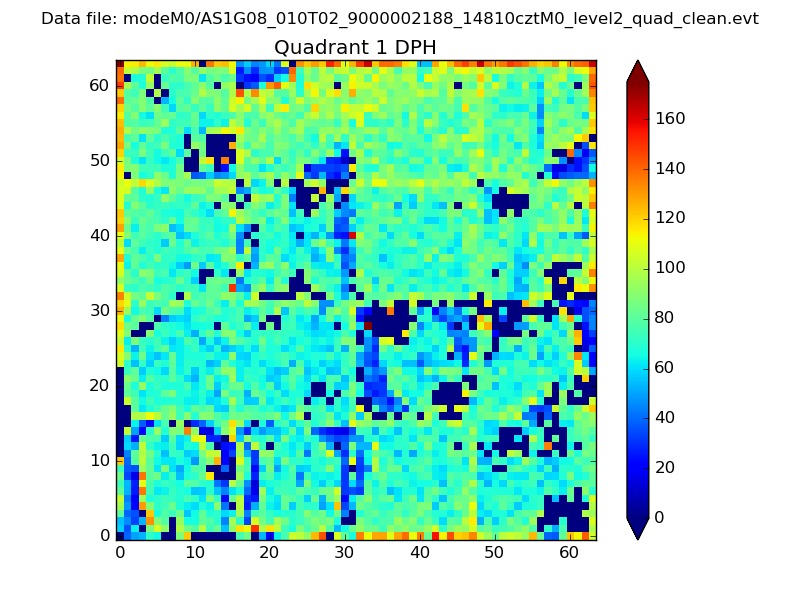 |
Quadrant B |
|---|---|---|---|
| Quadrant D | 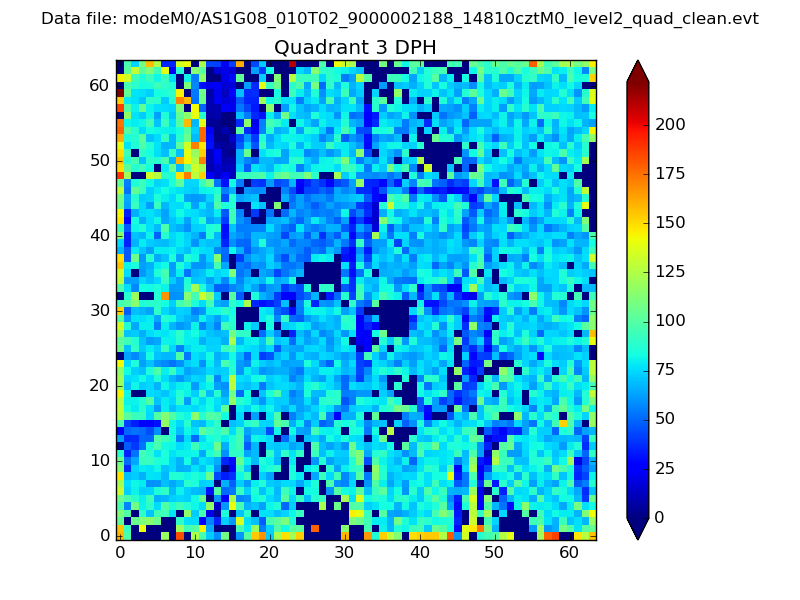 |
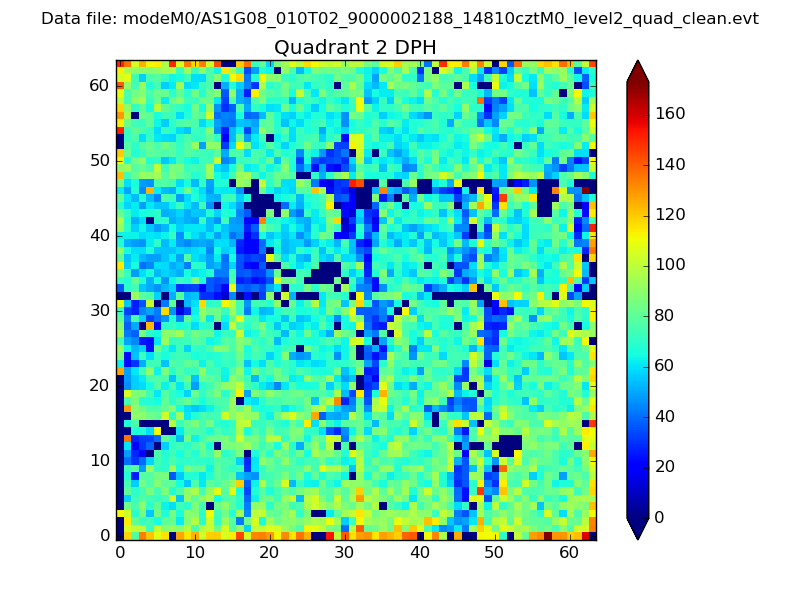 |
Quadrant C |
| Plot type | Count rate plots | Images |
|---|---|---|
| Comparison with Poisson distribution Blue bars denote a histogram of data divided into 1 sec bins. Red curve is a Poisson curve with rate = median count rate of data. |
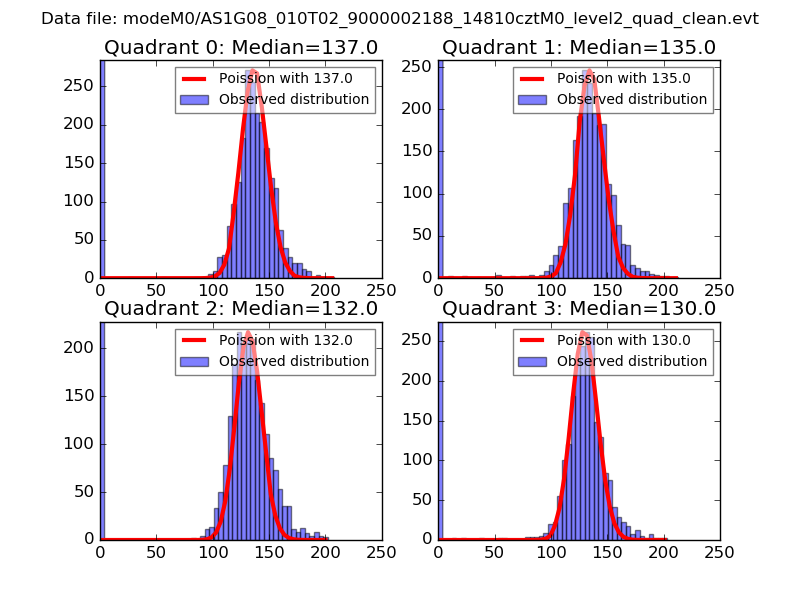 |
 |
| Quadrant-wise count rates Data is divided into 100 sec bins |
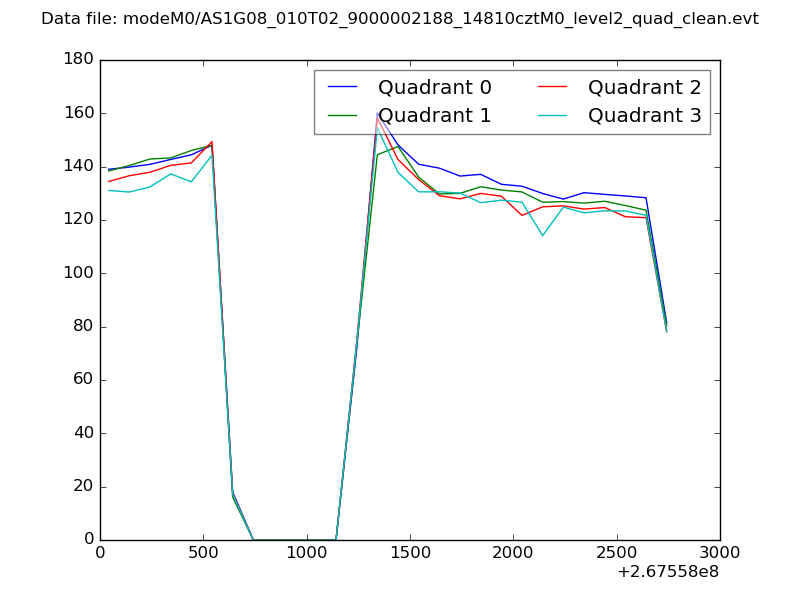 |
|
| Module-wise count rates for Quadrant A Data is divided into 100 sec bins |
 |
 |
| Module-wise count rates for Quadrant B Data is divided into 100 sec bins |
 |
 |
| Module-wise count rates for Quadrant C Data is divided into 100 sec bins |
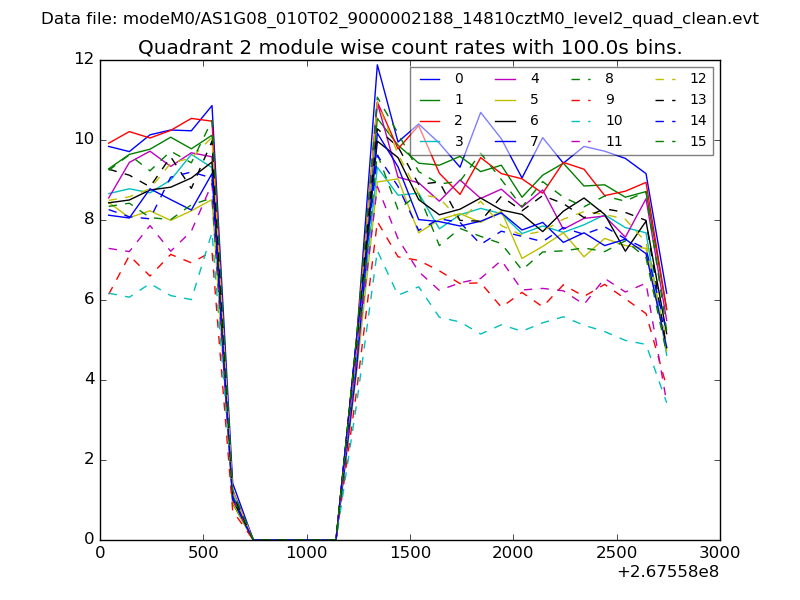 |
 |
| Module-wise count rates for Quadrant D Data is divided into 100 sec bins |
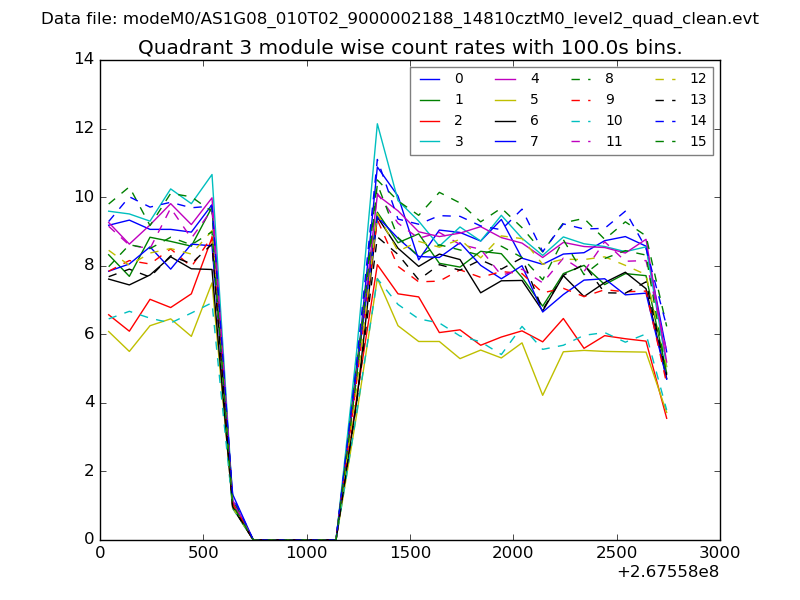 |
 |
| Parameter | Plot |
|---|---|
| CZT HV Monitor | 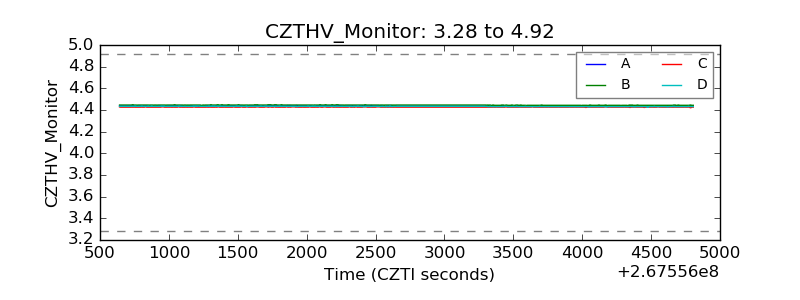 |
| D_VDD | 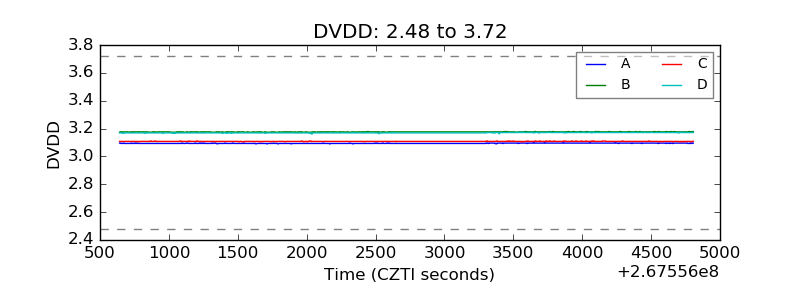 |
| Temperature 1 |  |
| Veto HV Monitor | 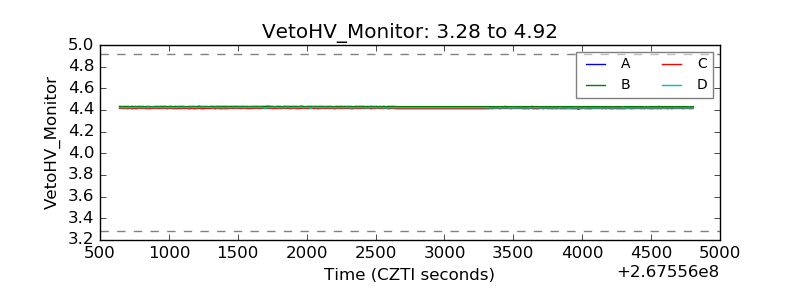 |
| Veto LLD | 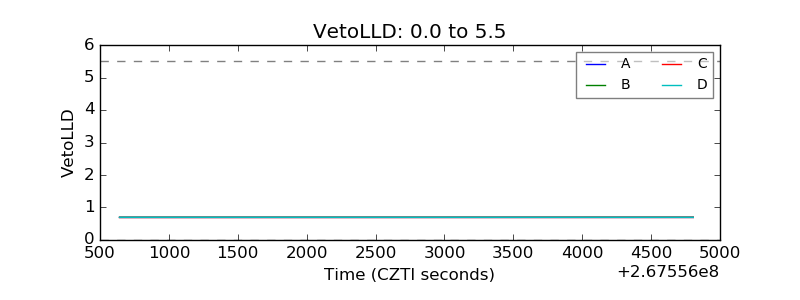 |
| Alpha Counter | 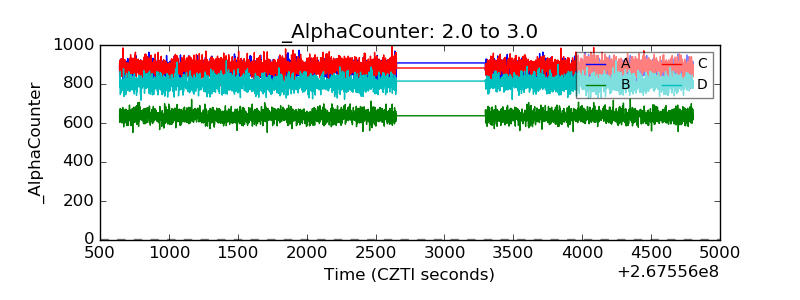 |
| _CPM_Rate | 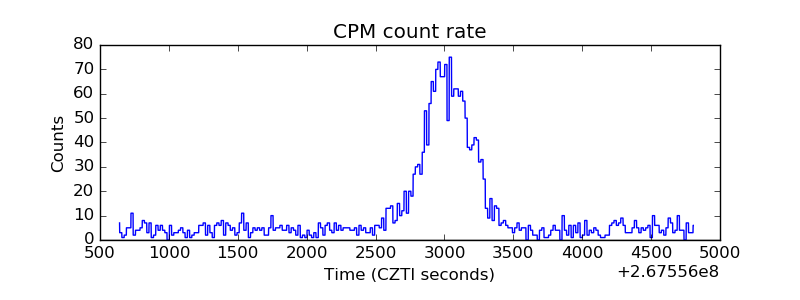 |
| CZT Counter | 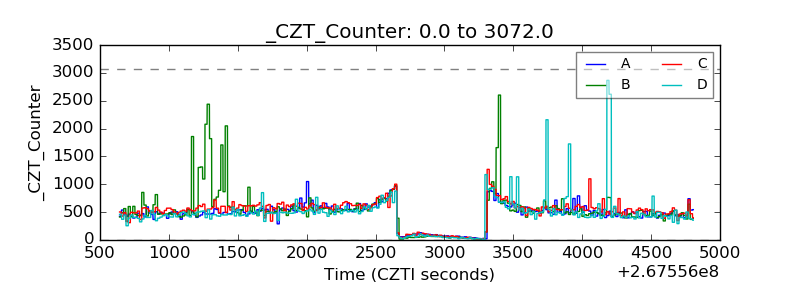 |
| +2.5 Volts monitor |  |
| +5 Volts monitor |  |
| _ROLL_ROT | 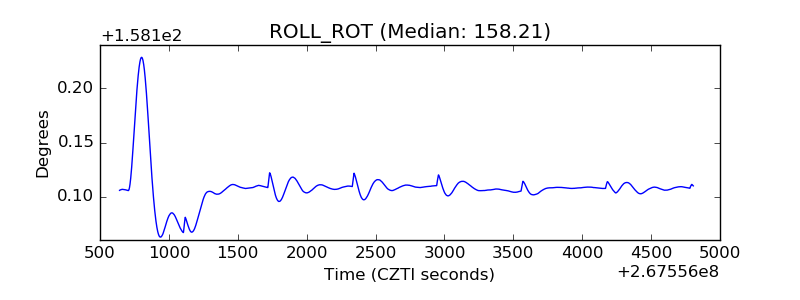 |
| _Roll_DEC | 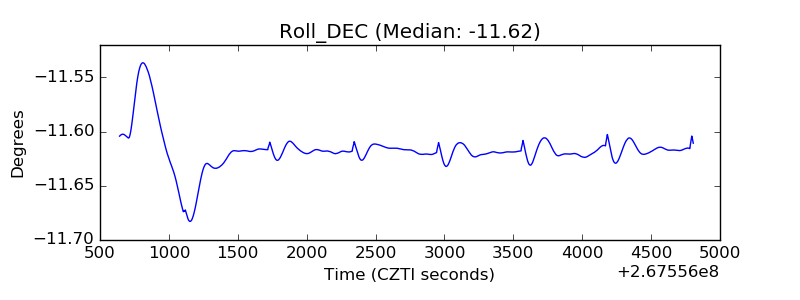 |
| _Roll_RA | 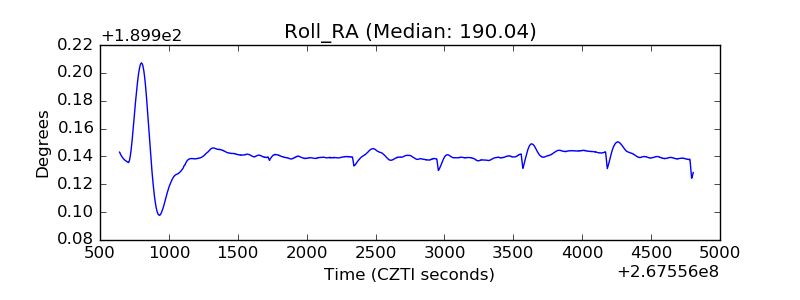 |
| Veto Counter |  |