| Param | Original file | Final file |
|---|---|---|
| Filename | modeM0/AS1G08_010T02_9000002188_14811cztM0_level2.evt | modeM0/AS1G08_010T02_9000002188_14811cztM0_level2_quad_clean.evt |
| Size (bytes) | 533,275,200 | 104,803,200 |
| Size | 508.6 MB | 99.9 MB |
| Events in quadrant A | 3,737,170 | 682,589 |
| Events in quadrant B | 3,887,622 | 673,356 |
| Events in quadrant C | 3,978,738 | 661,130 |
| Events in quadrant D | 4,042,388 | 639,540 |
| Mode M9 | |||
|---|---|---|---|
| Quadrant | BADHDUFLAG | Total packets | Discarded packets |
| A | 0 | 3 | 0 |
| B | 0 | 3 | 0 |
| C | 0 | 3 | 0 |
| D | 0 | 3 | 0 |
| Mode M0 | |||
|---|---|---|---|
| Quadrant | BADHDUFLAG | Total packets | Discarded packets |
| A | 0 | 15912 | 3 |
| B | 0 | 16296 | 2 |
| C | 0 | 16310 | 2 |
| D | 0 | 17353 | 2 |
| Mode SS | |||
|---|---|---|---|
| Quadrant | BADHDUFLAG | Total packets | Discarded packets |
| A | 0 | 150 | 0 |
| B | 0 | 150 | 0 |
| C | 0 | 150 | 0 |
| D | 0 | 150 | 0 |
| Quadrant | Total seconds | Saturated seconds | Saturation percentage |
|---|---|---|---|
| A | 7434 | 71 | 0.955071% |
| B | 7434 | 144 | 1.937046% |
| C | 7434 | 39 | 0.524617% |
| D | 7434 | 198 | 2.663438% |
Noise dominated data is calculated using 1-second bins in cleaned event files. If a bin has >2000 counts, and if more than 50% of those come from <1% of pixels, then it is considered to be noise-dominated and hence unusable.
| Quadrant | # 1 sec bins | Bins with >0 counts | Bins with >2000 counts | High rate bins dominated by noise | Noise dominated (total time) | Noise dominated (detector-on time) | Marked lightcurve |
|---|---|---|---|---|---|---|---|
| A | 7770 | 7436 | 5 | 5 | 0.06% | 0.07% | 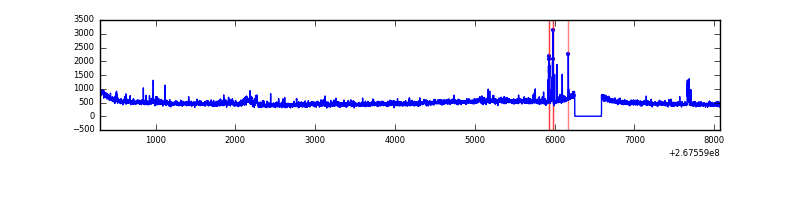 |
| B | 7770 | 7436 | 35 | 35 | 0.45% | 0.47% | 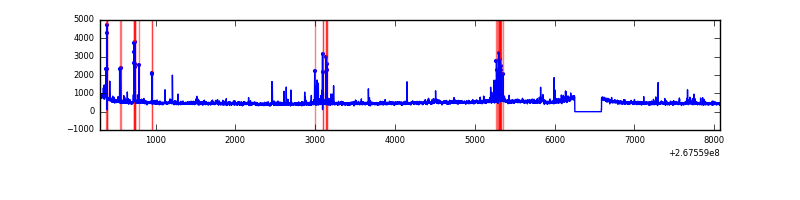 |
| C | 7770 | 7436 | 7 | 7 | 0.09% | 0.09% | 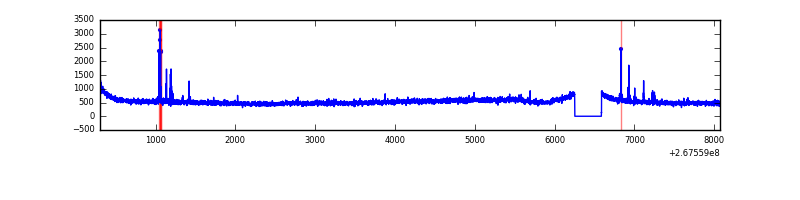 |
| D | 7770 | 7436 | 127 | 127 | 1.63% | 1.71% | 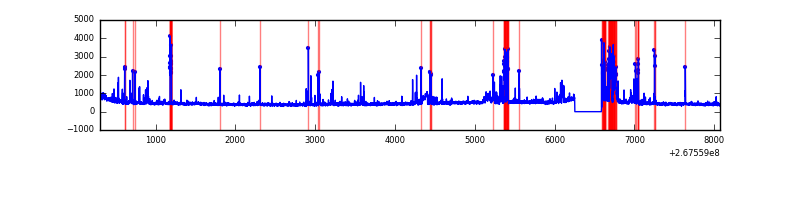 |
Top three noisy pixels from each quadrant. If the there are fewer than three noisy pixels in the level2.evt file, extra rows are filled as -1
| Pixel properties | Quadrant properties | ||||||
|---|---|---|---|---|---|---|---|
| Quadrant | DetID | PixID | Counts | Sigma | Mean | Median | Sigma |
| A | 12 | 189 | 136873 | 729.27 | 910 | 891 | 186.5 |
| A | 4 | 2 | 82677 | 438.62 | 910 | 891 | 186.5 |
| A | 14 | 237 | 11135 | 54.94 | 910 | 891 | 186.5 |
| B | 4 | 173 | 116172 | 667.79 | 900 | 880 | 172.6 |
| B | 3 | 64 | 105976 | 608.74 | 900 | 880 | 172.6 |
| B | 0 | 219 | 28505 | 160.01 | 900 | 880 | 172.6 |
| C | 3 | 233 | 521185 | 2550.76 | 872 | 877 | 204.0 |
| C | 0 | 207 | 53731 | 259.11 | 872 | 877 | 204.0 |
| C | 13 | 61 | 6221 | 26.2 | 872 | 877 | 204.0 |
| D | 7 | 254 | 345306 | 1512.31 | 861 | 840 | 227.8 |
| D | 10 | 70 | 229687 | 1004.7 | 861 | 840 | 227.8 |
| D | 13 | 249 | 90405 | 393.22 | 861 | 840 | 227.8 |
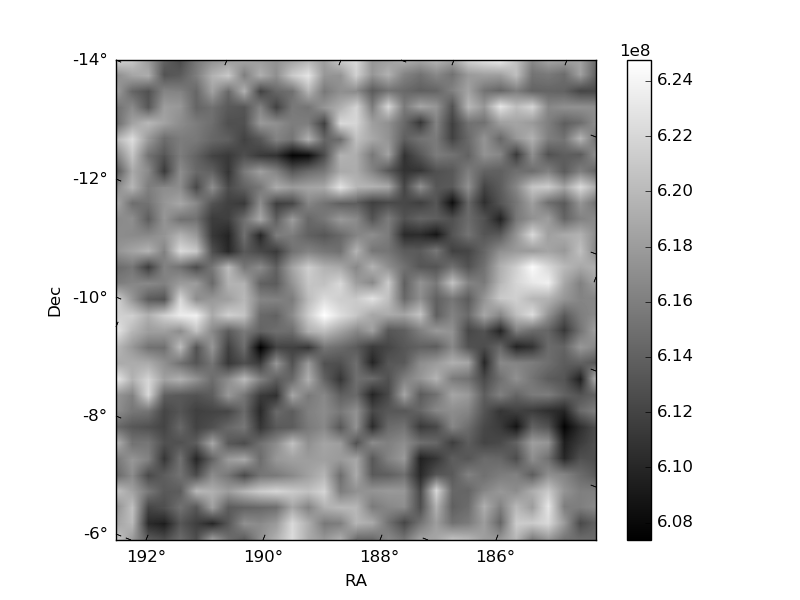
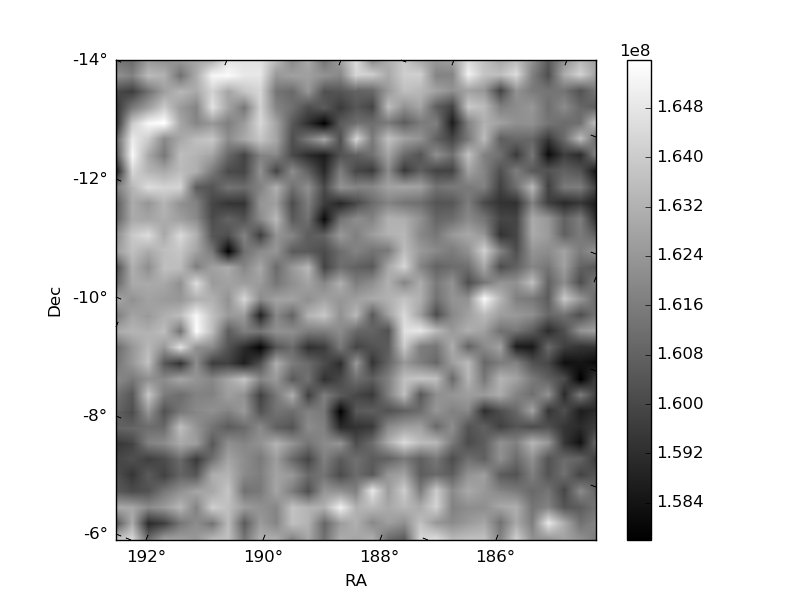
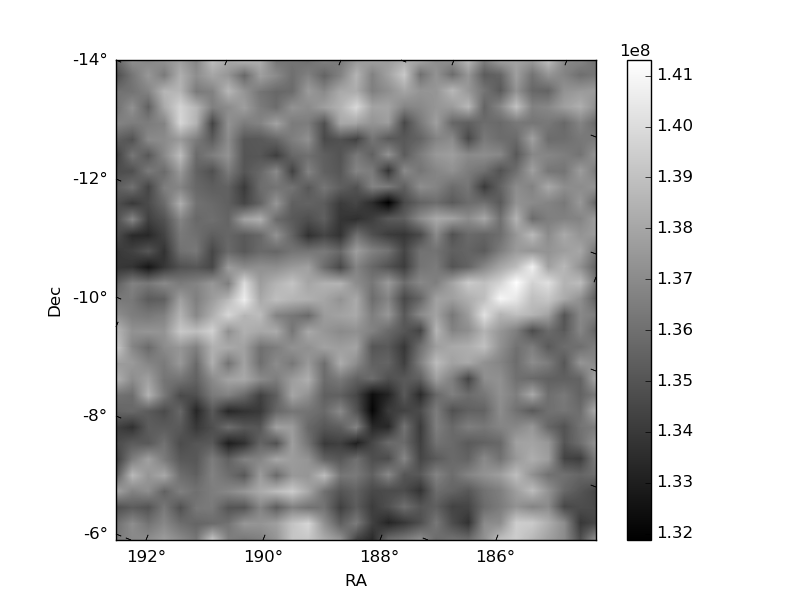
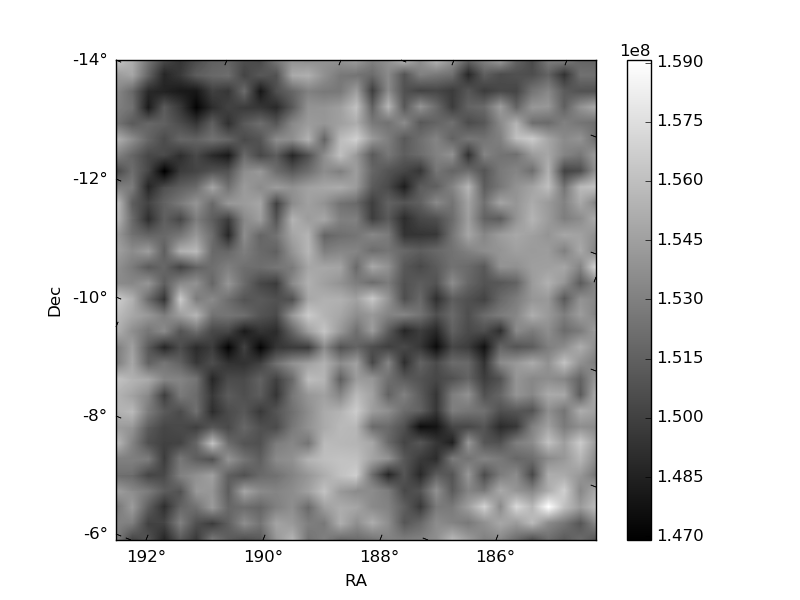
Histogram calculated using DETX and DETY for each event in the final _common_clean file
| Quadrant A | 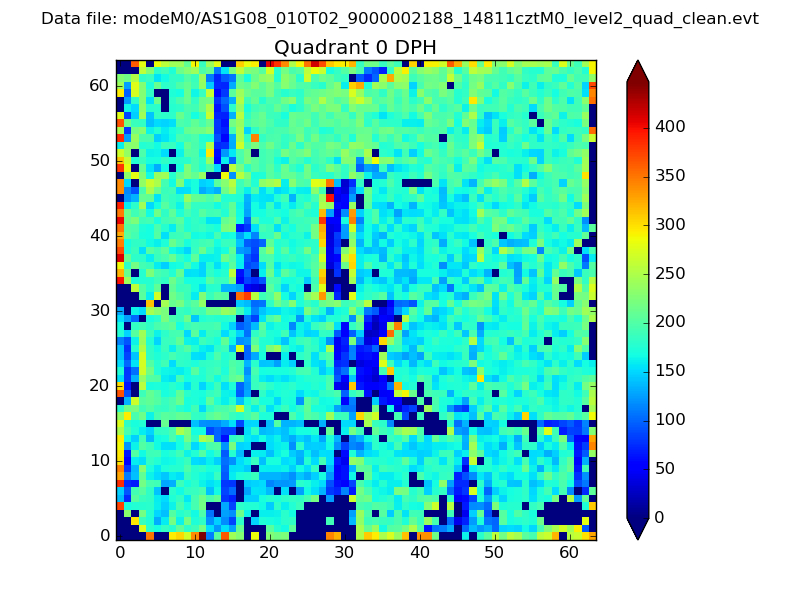 |
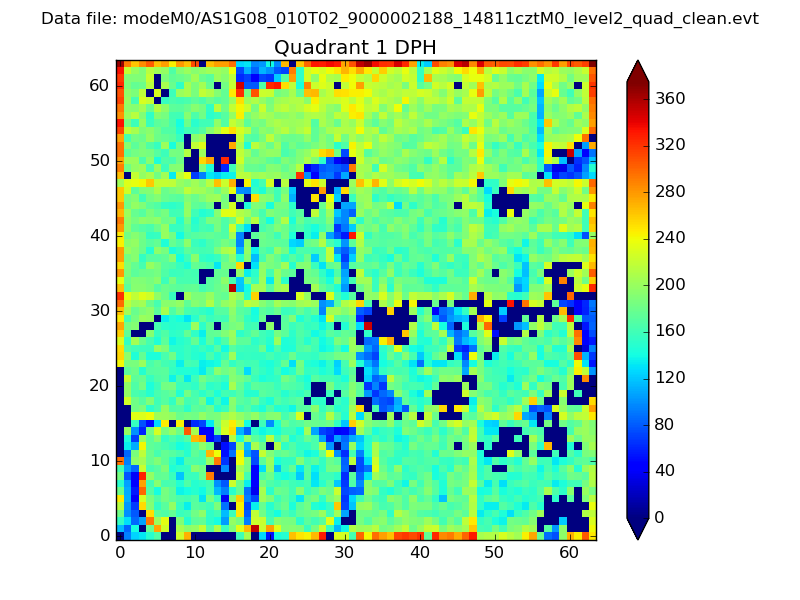 |
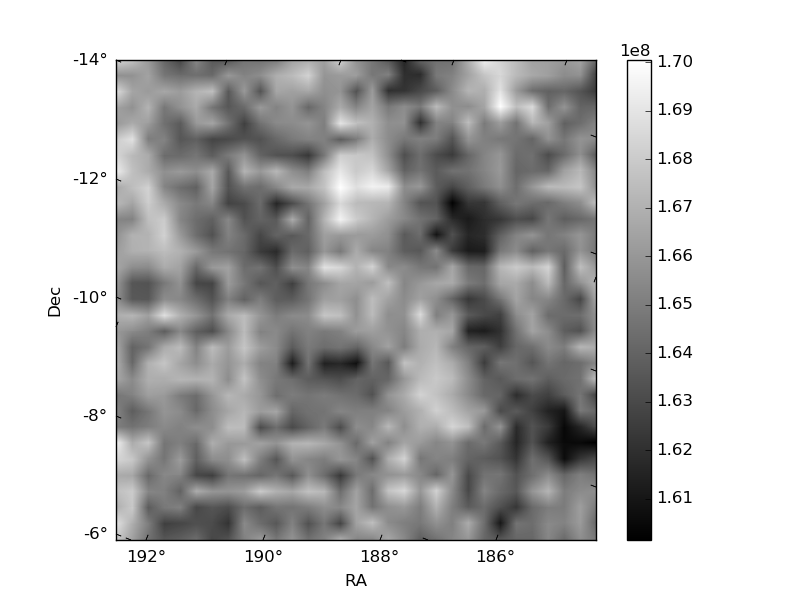
Quadrant B |
|---|---|---|---|
| Quadrant D | 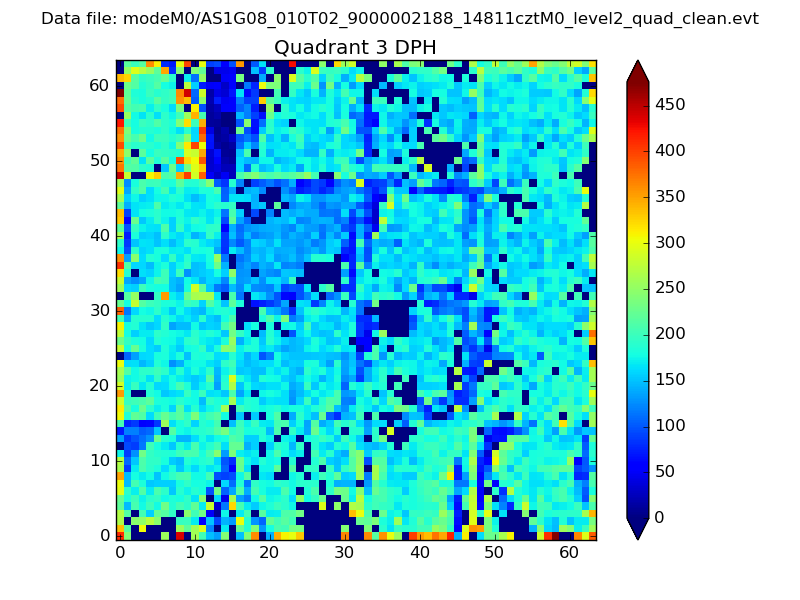 |
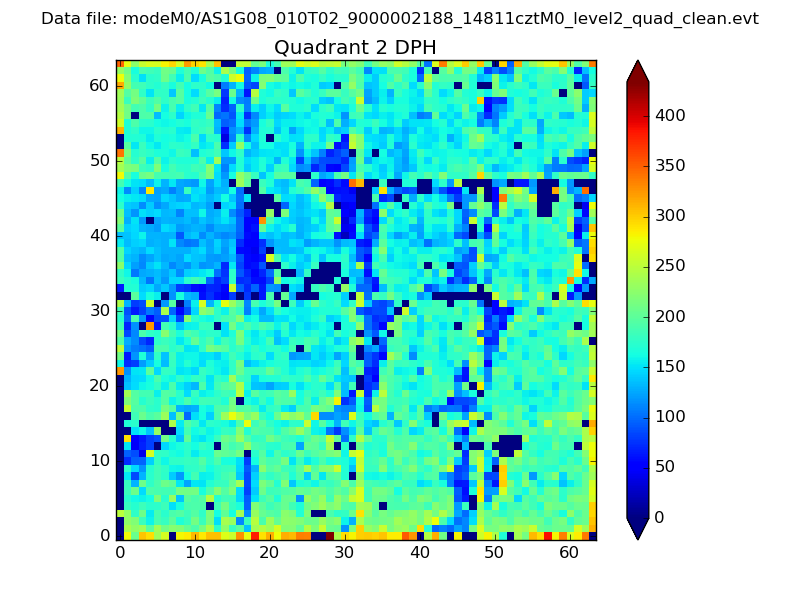 |
Quadrant C |
| Plot type | Count rate plots | Images |
|---|---|---|
| Comparison with Poisson distribution Blue bars denote a histogram of data divided into 1 sec bins. Red curve is a Poisson curve with rate = median count rate of data. |
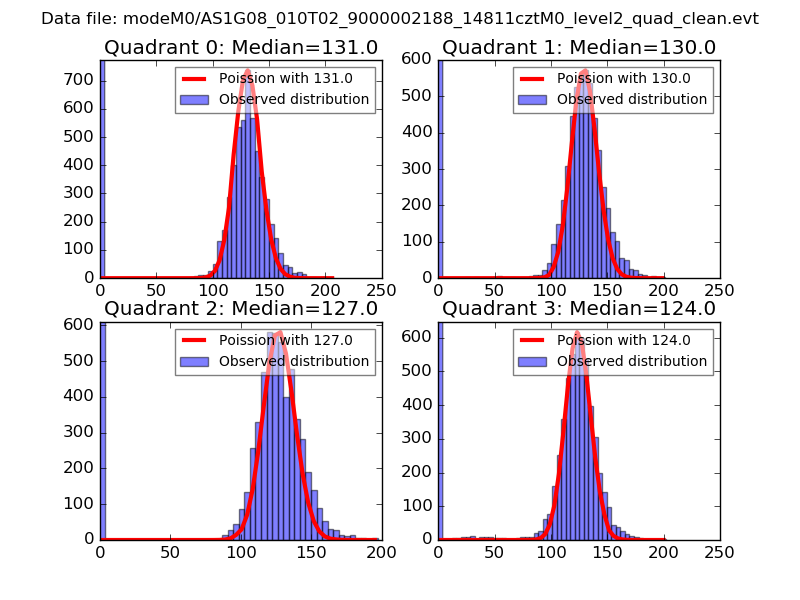 |
 |
| Quadrant-wise count rates Data is divided into 100 sec bins |
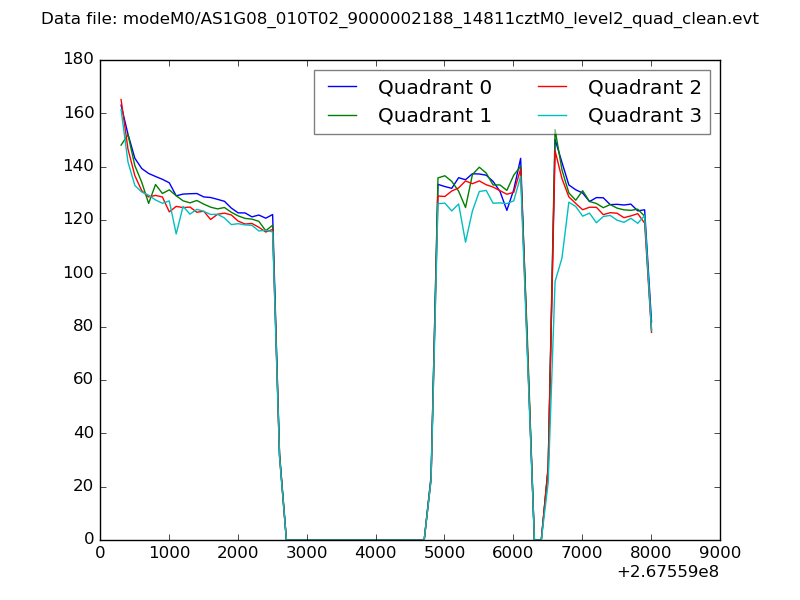 |
|
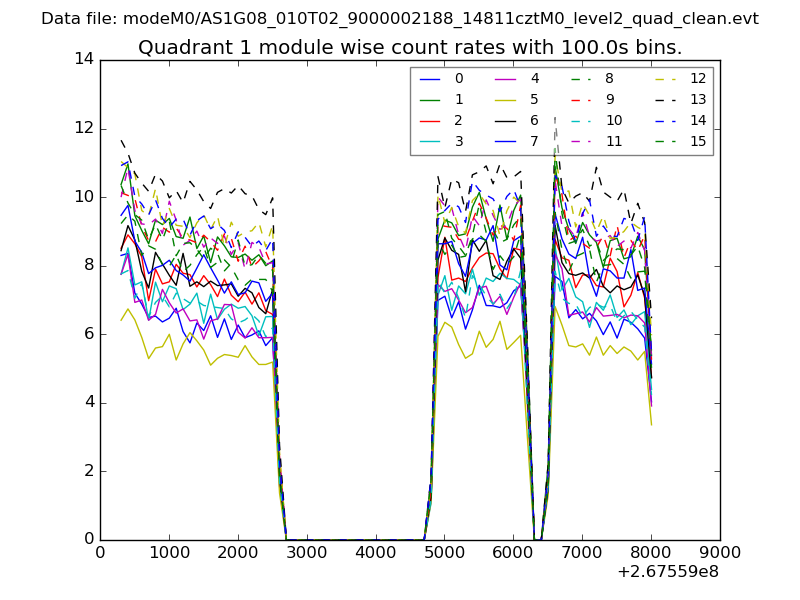
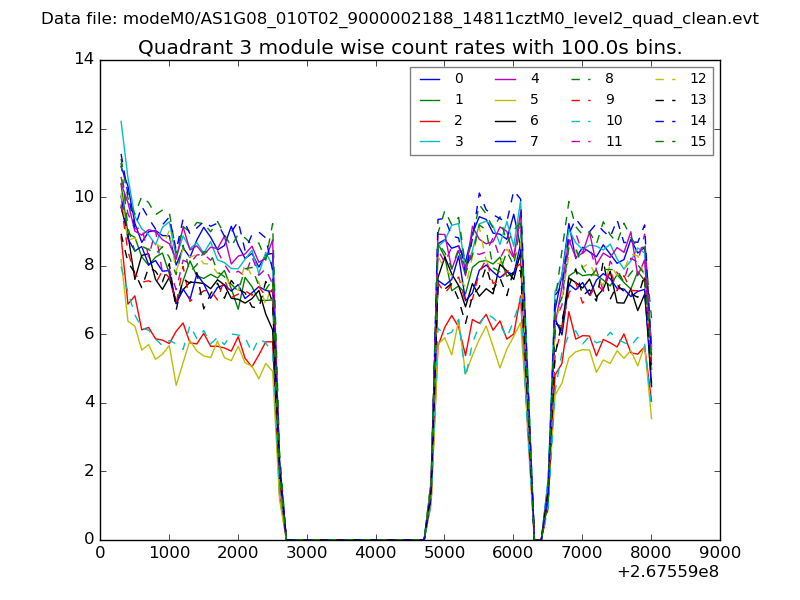
| Module-wise count rates for Quadrant A Data is divided into 100 sec bins |
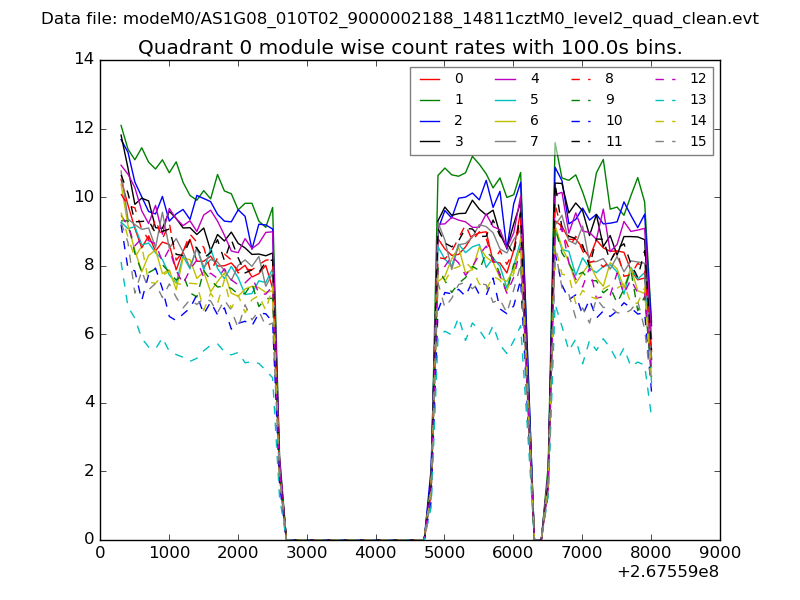 |
 |
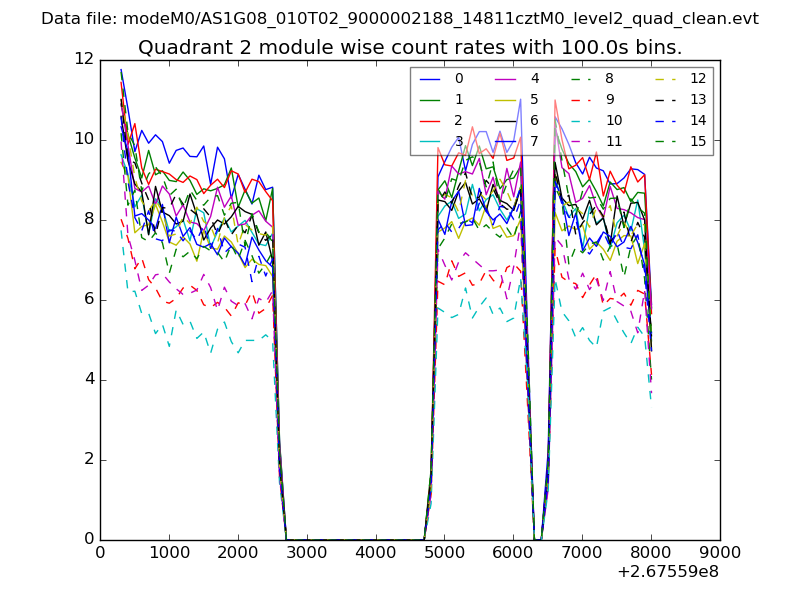
| Module-wise count rates for Quadrant B Data is divided into 100 sec bins |
 |
 |
| Module-wise count rates for Quadrant C Data is divided into 100 sec bins |
 |
 |
| Module-wise count rates for Quadrant D Data is divided into 100 sec bins |
 |
 |
| Parameter | Plot |
|---|---|
| CZT HV Monitor | 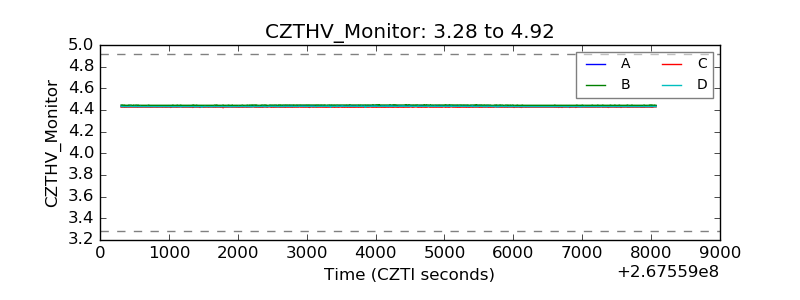 |
| D_VDD | 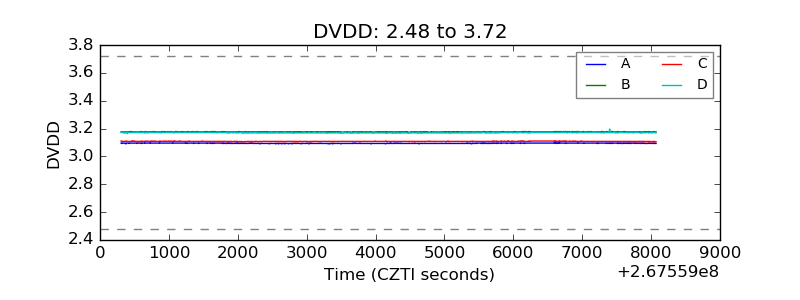 |
| Temperature 1 | 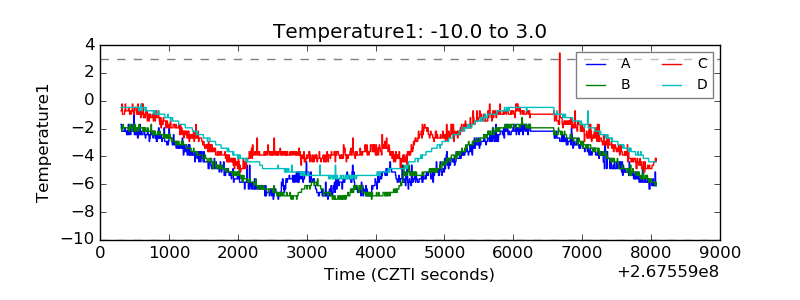 |
| Veto HV Monitor | 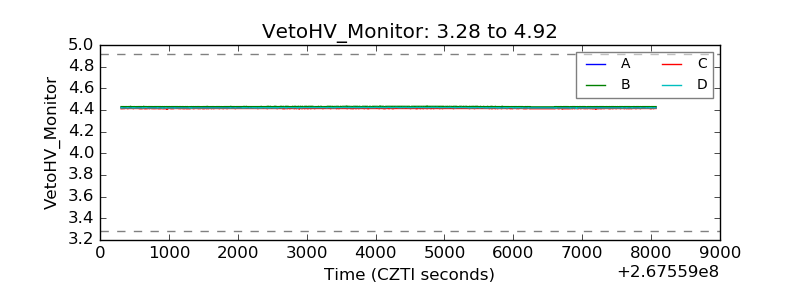 |
| Veto LLD | 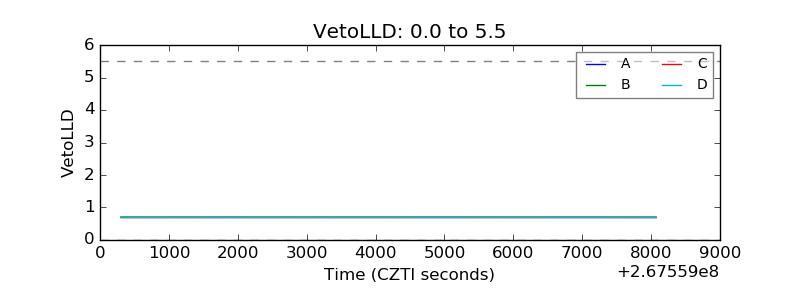 |
| Alpha Counter | 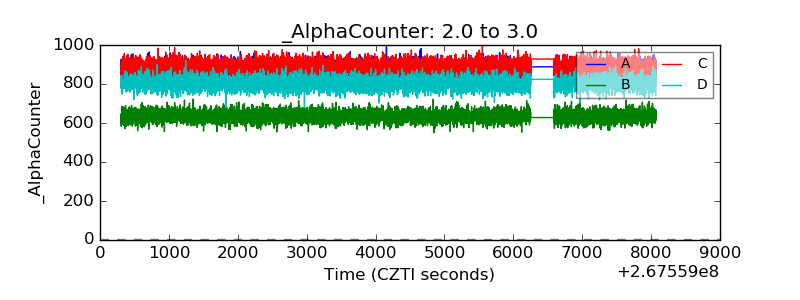 |
| _CPM_Rate | 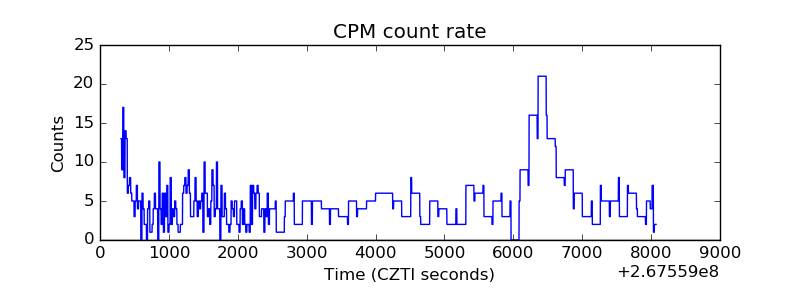 |
| CZT Counter | 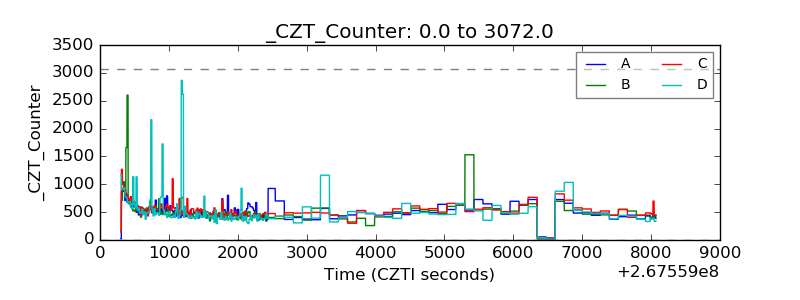 |
| +2.5 Volts monitor |  |
| +5 Volts monitor |  |
| _ROLL_ROT | 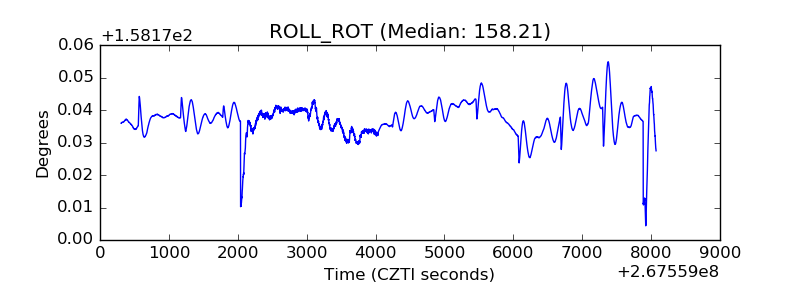 |
| _Roll_DEC | 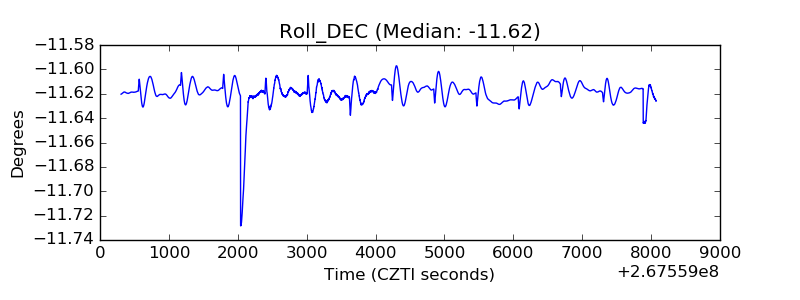 |
| _Roll_RA | 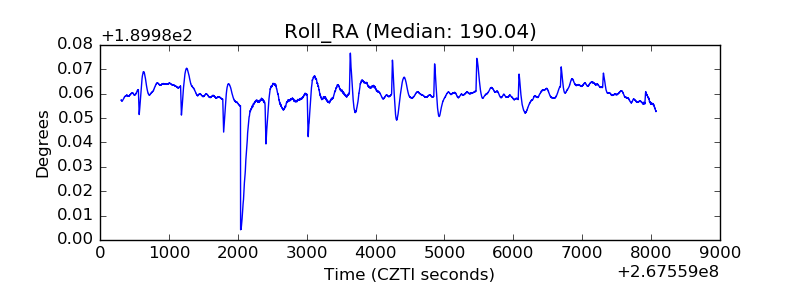 |
| Veto Counter | 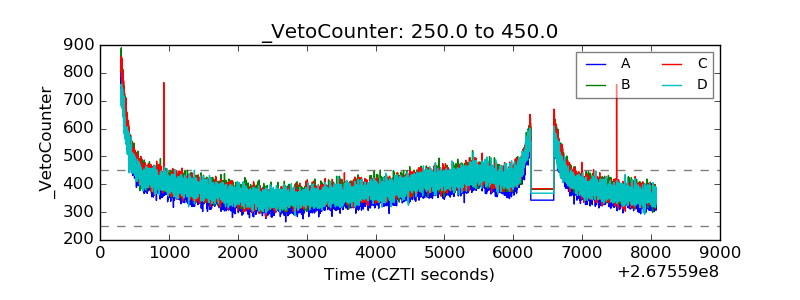 |