| Param | Original file | Final file |
|---|---|---|
| Filename | modeM0/AS1G08_010T02_9000002188_14812cztM0_level2.evt | modeM0/AS1G08_010T02_9000002188_14812cztM0_level2_quad_clean.evt |
| Size (bytes) | 560,741,760 | 107,743,680 |
| Size | 534.8 MB | 102.8 MB |
| Events in quadrant A | 3,876,813 | 696,140 |
| Events in quadrant B | 4,201,299 | 688,399 |
| Events in quadrant C | 4,092,092 | 678,507 |
| Events in quadrant D | 4,284,577 | 659,369 |
| Mode M9 | |||
|---|---|---|---|
| Quadrant | BADHDUFLAG | Total packets | Discarded packets |
| A | 0 | 5 | 0 |
| B | 0 | 5 | 0 |
| C | 0 | 5 | 0 |
| D | 0 | 5 | 0 |
| Mode M0 | |||
|---|---|---|---|
| Quadrant | BADHDUFLAG | Total packets | Discarded packets |
| A | 0 | 16611 | 3 |
| B | 0 | 17455 | 2 |
| C | 0 | 16968 | 2 |
| D | 0 | 18223 | 2 |
| Mode SS | |||
|---|---|---|---|
| Quadrant | BADHDUFLAG | Total packets | Discarded packets |
| A | 0 | 160 | 0 |
| B | 0 | 160 | 0 |
| C | 0 | 160 | 0 |
| D | 0 | 160 | 0 |
| Quadrant | Total seconds | Saturated seconds | Saturation percentage |
|---|---|---|---|
| A | 7773 | 46 | 0.591792% |
| B | 7773 | 150 | 1.929757% |
| C | 7773 | 22 | 0.283031% |
| D | 7773 | 206 | 2.650199% |
Noise dominated data is calculated using 1-second bins in cleaned event files. If a bin has >2000 counts, and if more than 50% of those come from <1% of pixels, then it is considered to be noise-dominated and hence unusable.
| Quadrant | # 1 sec bins | Bins with >0 counts | Bins with >2000 counts | High rate bins dominated by noise | Noise dominated (total time) | Noise dominated (detector-on time) | Marked lightcurve |
|---|---|---|---|---|---|---|---|
| A | 8329 | 7776 | 1 | 1 | 0.01% | 0.01% | 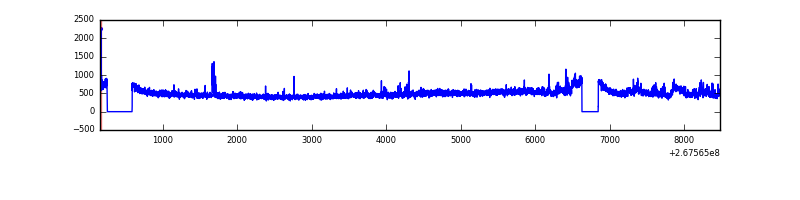 |
| B | 8329 | 7776 | 53 | 53 | 0.64% | 0.68% | 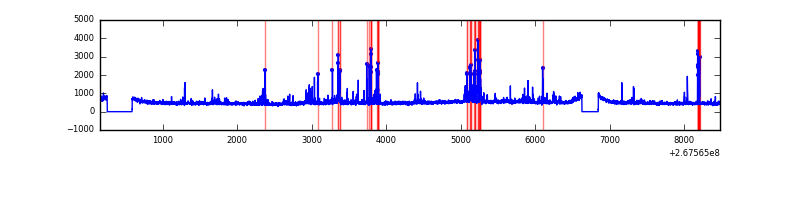 |
| C | 8329 | 7776 | 2 | 2 | 0.02% | 0.03% | 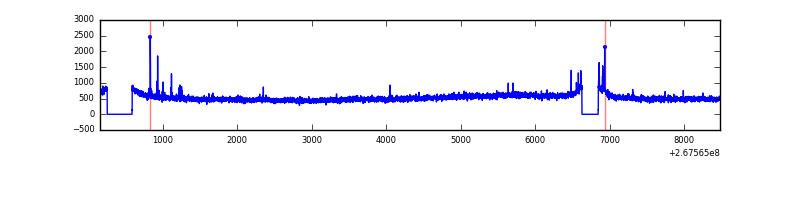 |
| D | 8329 | 7776 | 147 | 147 | 1.76% | 1.89% | 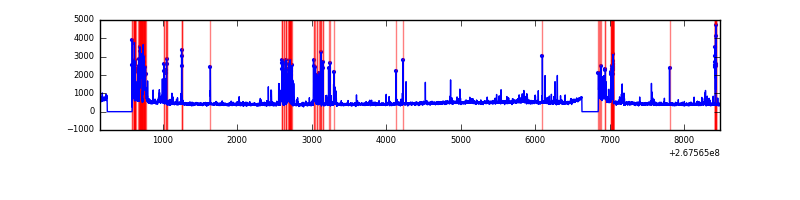 |
Top three noisy pixels from each quadrant. If the there are fewer than three noisy pixels in the level2.evt file, extra rows are filled as -1
| Pixel properties | Quadrant properties | ||||||
|---|---|---|---|---|---|---|---|
| Quadrant | DetID | PixID | Counts | Sigma | Mean | Median | Sigma |
| A | 12 | 189 | 235691 | 1219.36 | 941 | 920 | 192.5 |
| A | 4 | 2 | 17319 | 85.17 | 941 | 920 | 192.5 |
| A | 0 | 226 | 8568 | 39.72 | 941 | 920 | 192.5 |
| B | 4 | 173 | 173841 | 959.89 | 931 | 910 | 180.2 |
| B | 3 | 64 | 138300 | 762.61 | 931 | 910 | 180.2 |
| B | 0 | 229 | 77778 | 426.67 | 931 | 910 | 180.2 |
| C | 3 | 233 | 534346 | 2523.45 | 902 | 903 | 211.4 |
| C | 0 | 207 | 34846 | 160.57 | 902 | 903 | 211.4 |
| C | 13 | 61 | 6455 | 26.26 | 902 | 903 | 211.4 |
| D | 7 | 254 | 486791 | 2136.42 | 893 | 871 | 227.4 |
| D | 10 | 70 | 263570 | 1154.99 | 893 | 871 | 227.4 |
| D | 13 | 249 | 47651 | 205.67 | 893 | 871 | 227.4 |
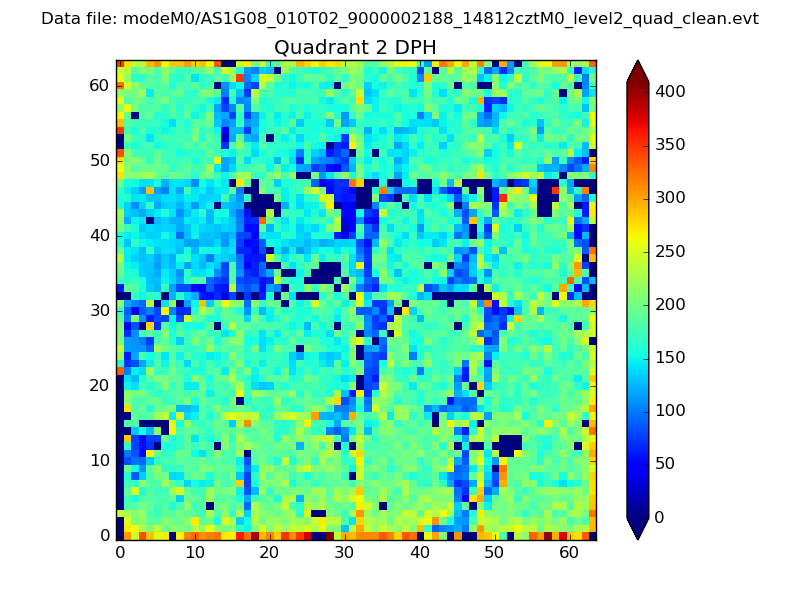
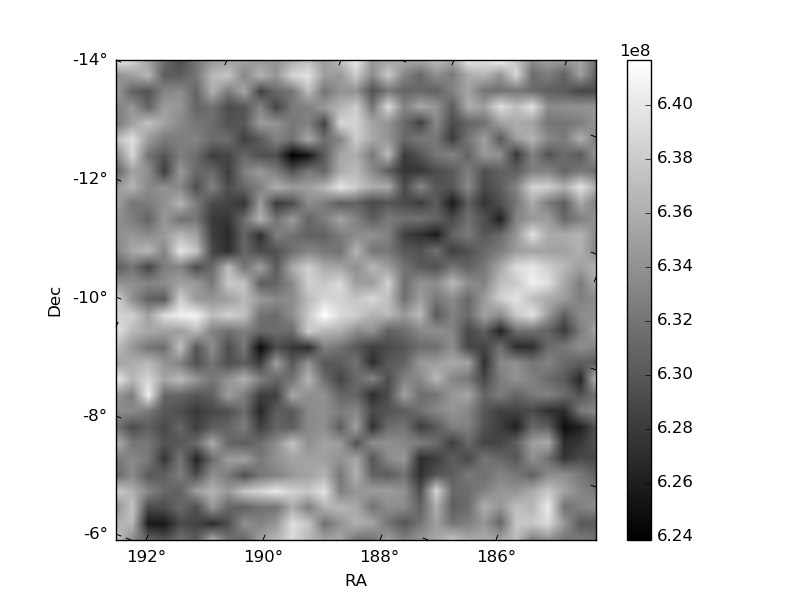
Histogram calculated using DETX and DETY for each event in the final _common_clean file
| Quadrant A | 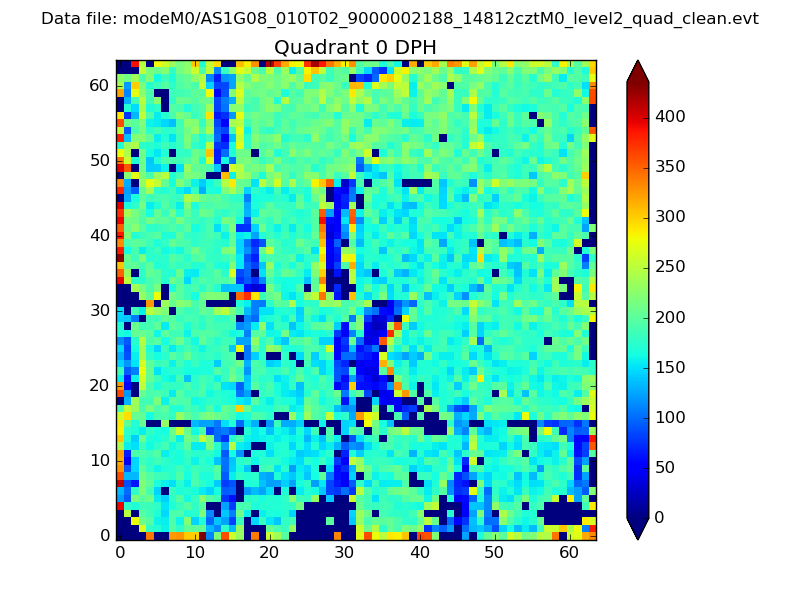 |
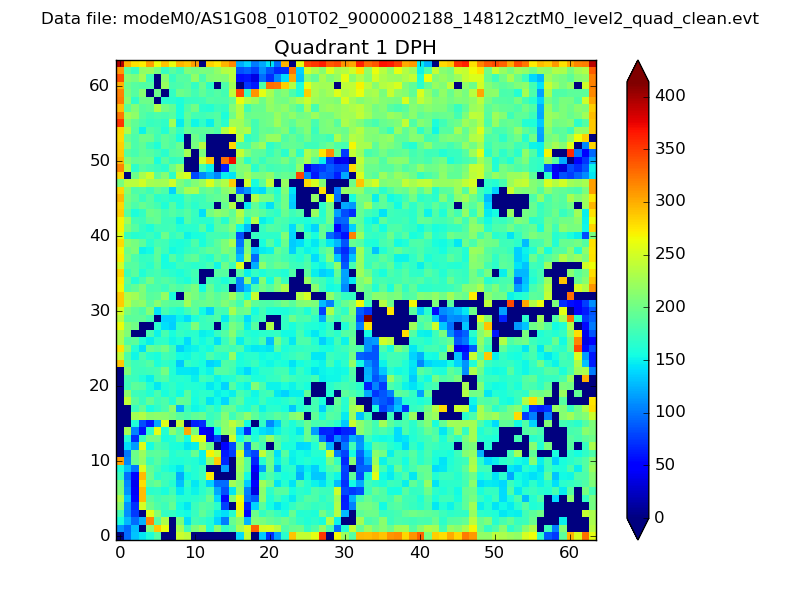 |
Quadrant B |
|---|---|---|---|
| Quadrant D | 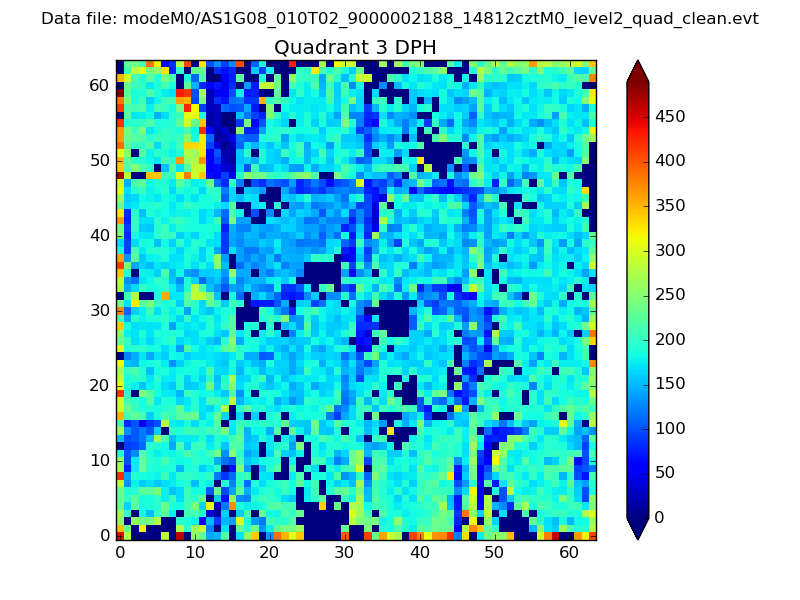 |
 |
Quadrant C |
| Plot type | Count rate plots | Images |
|---|---|---|
| Comparison with Poisson distribution Blue bars denote a histogram of data divided into 1 sec bins. Red curve is a Poisson curve with rate = median count rate of data. |
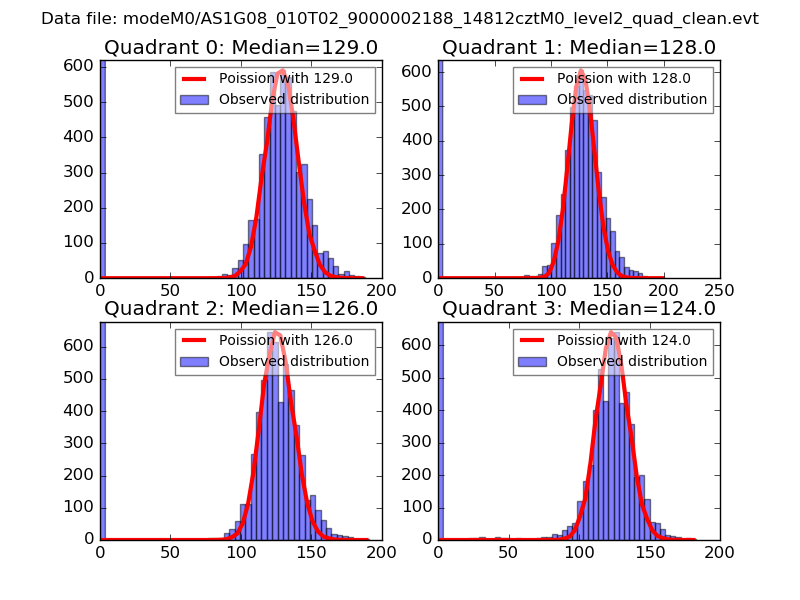 |
 |
| Quadrant-wise count rates Data is divided into 100 sec bins |
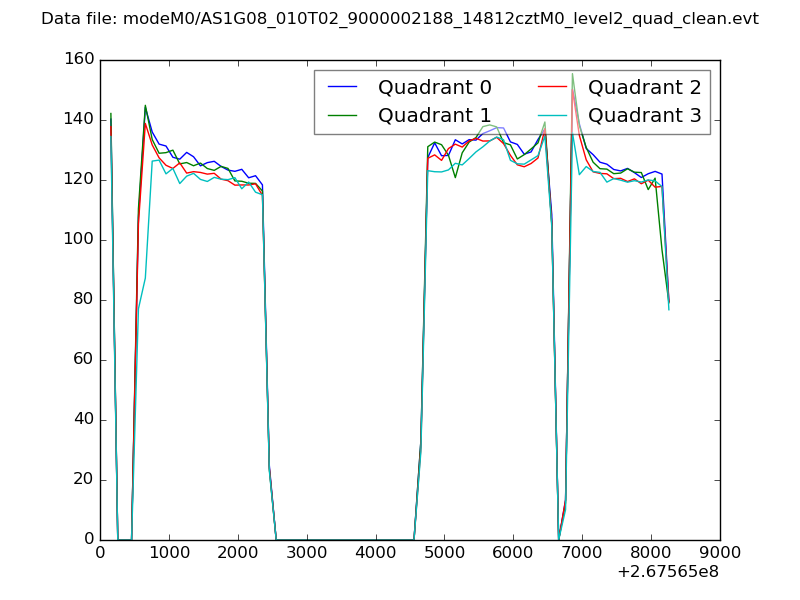 |
|
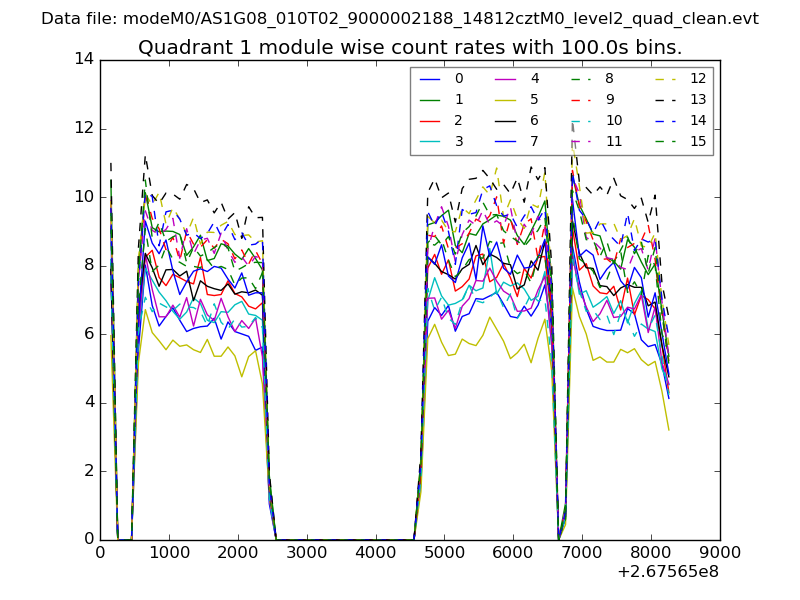
| Module-wise count rates for Quadrant A Data is divided into 100 sec bins |
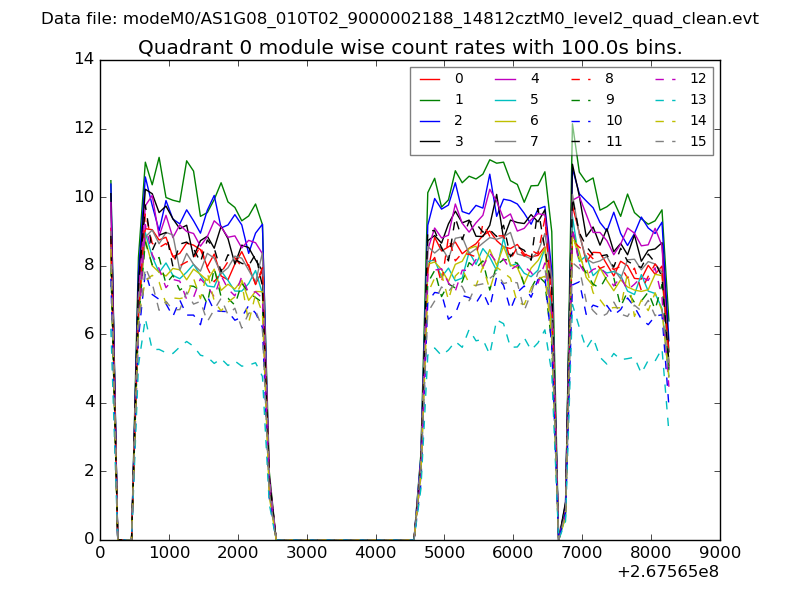 |
 |
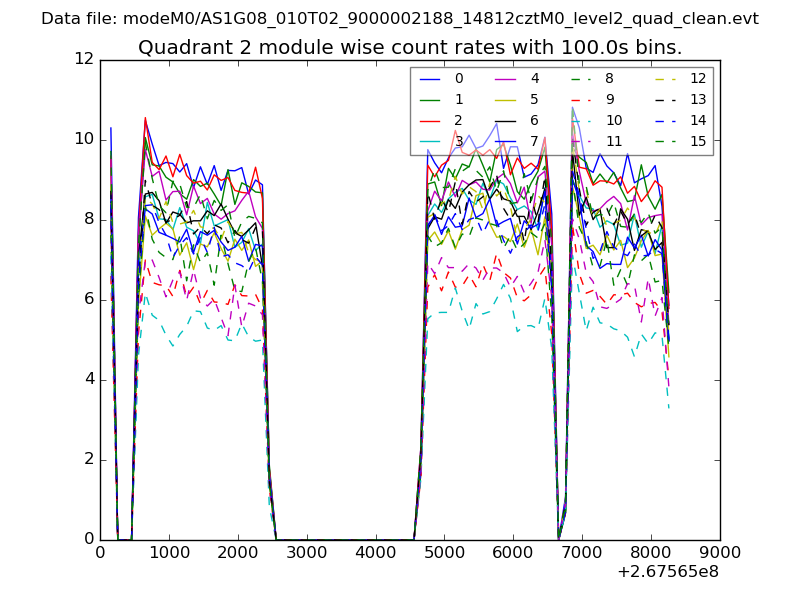
| Module-wise count rates for Quadrant B Data is divided into 100 sec bins |
 |
 |
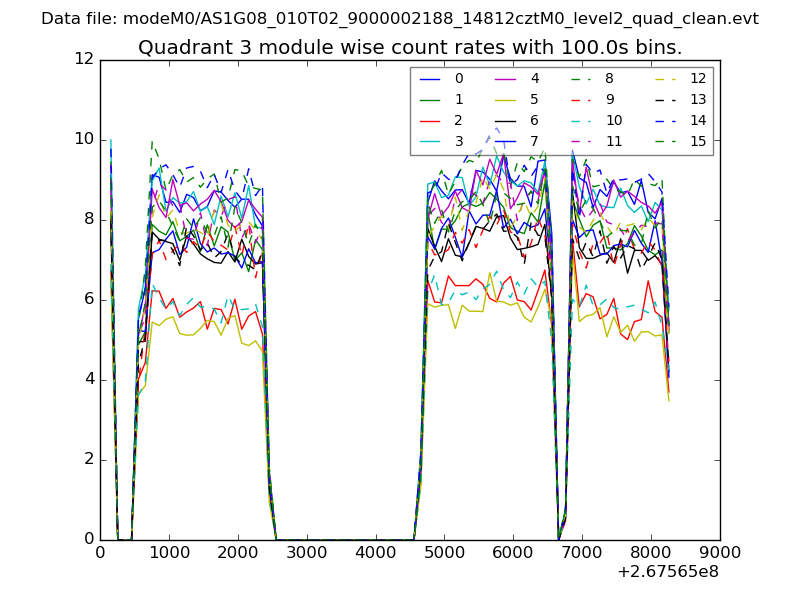
| Module-wise count rates for Quadrant C Data is divided into 100 sec bins |
 |
 |
| Module-wise count rates for Quadrant D Data is divided into 100 sec bins |
 |
 |
| Parameter | Plot |
|---|---|
| CZT HV Monitor | 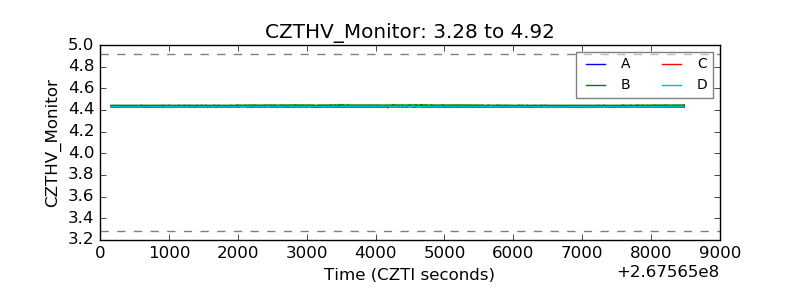 |
| D_VDD | 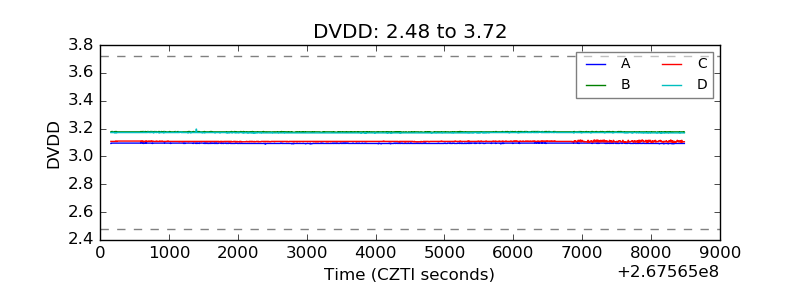 |
| Temperature 1 | 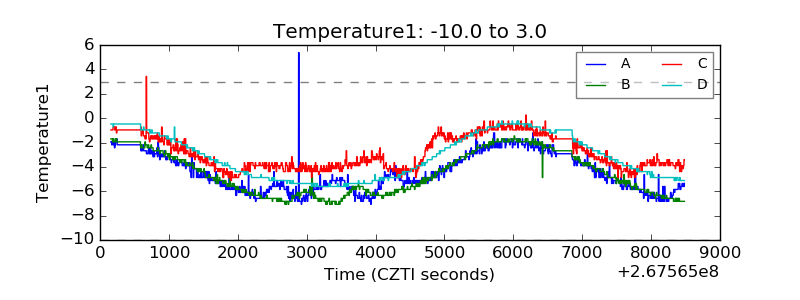 |
| Veto HV Monitor | 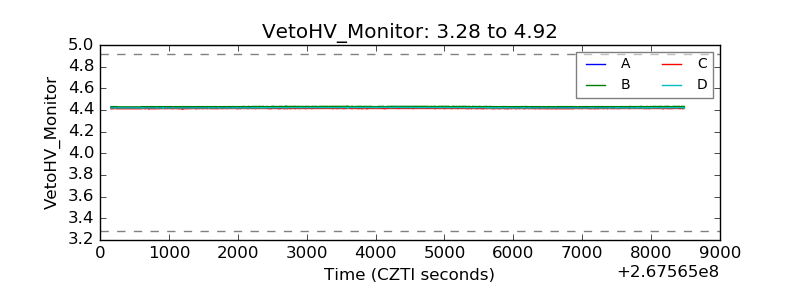 |
| Veto LLD | 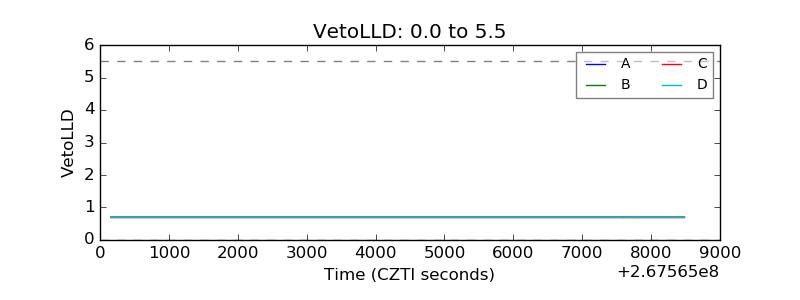 |
| Alpha Counter | 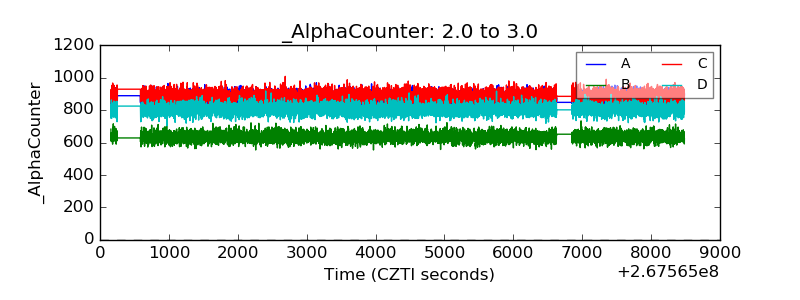 |
| _CPM_Rate | 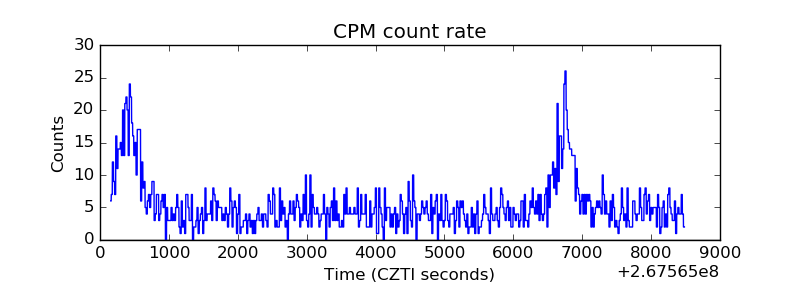 |
| CZT Counter | 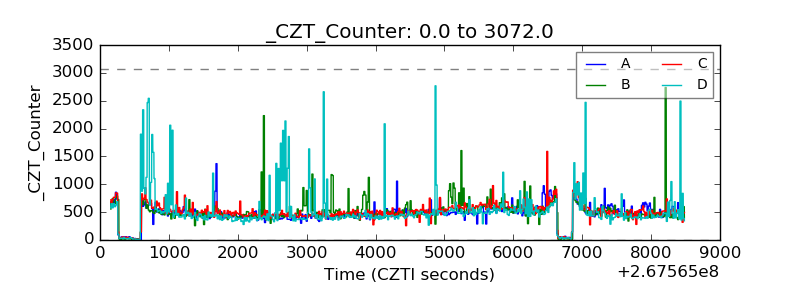 |
| +2.5 Volts monitor |  |
| +5 Volts monitor | 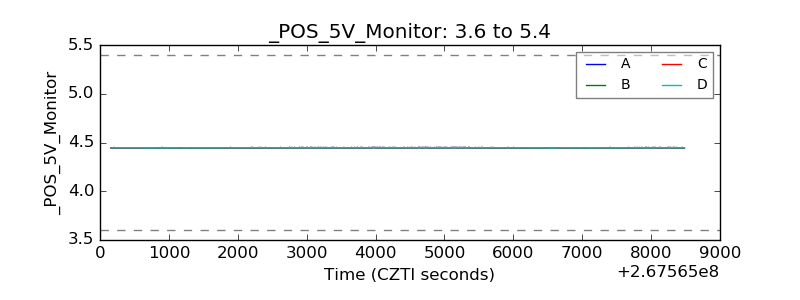 |
| _ROLL_ROT | 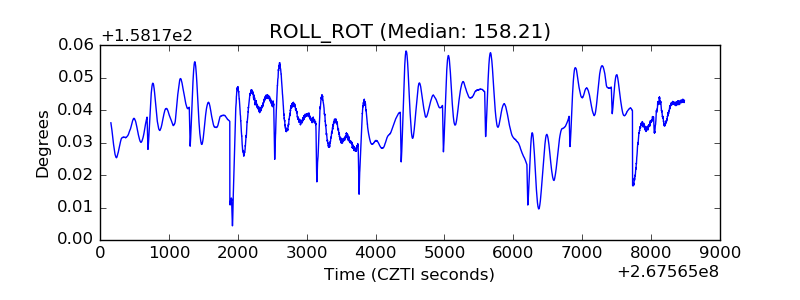 |
| _Roll_DEC |  |
| _Roll_RA | 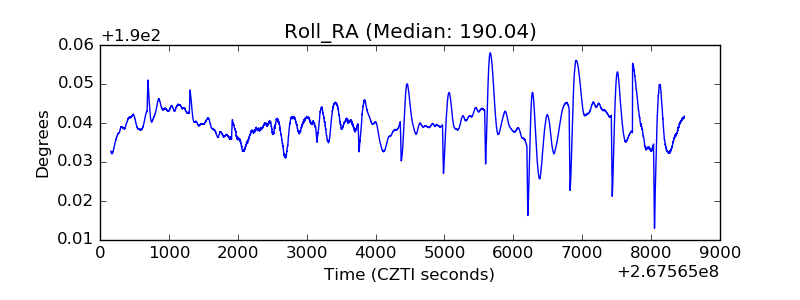 |
| Veto Counter | 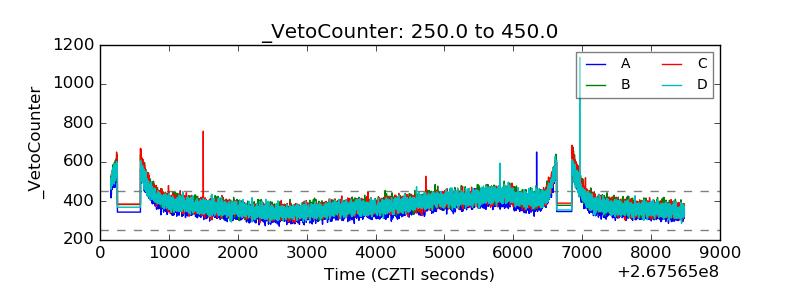 |