| Param | Original file | Final file |
|---|---|---|
| Filename | modeM0/AS1G08_010T02_9000002188_14815cztM0_level2.evt | modeM0/AS1G08_010T02_9000002188_14815cztM0_level2_quad_clean.evt |
| Size (bytes) | 1,004,290,560 | 154,296,000 |
| Size | 957.8 MB | 147.1 MB |
| Events in quadrant A | 6,467,471 | 963,967 |
| Events in quadrant B | 7,800,835 | 934,885 |
| Events in quadrant C | 8,854,159 | 913,776 |
| Events in quadrant D | 6,378,256 | 926,210 |
| Mode M9 | |||
|---|---|---|---|
| Quadrant | BADHDUFLAG | Total packets | Discarded packets |
| A | 0 | 18 | 0 |
| B | 0 | 18 | 0 |
| C | 0 | 18 | 0 |
| D | 0 | 18 | 0 |
| Mode M0 | |||
|---|---|---|---|
| Quadrant | BADHDUFLAG | Total packets | Discarded packets |
| A | 0 | 27932 | 4 |
| B | 0 | 31700 | 3 |
| C | 0 | 34502 | 3 |
| D | 0 | 28435 | 3 |
| Mode SS | |||
|---|---|---|---|
| Quadrant | BADHDUFLAG | Total packets | Discarded packets |
| A | 0 | 276 | 0 |
| B | 0 | 276 | 0 |
| C | 0 | 276 | 0 |
| D | 0 | 276 | 0 |
| Quadrant | Total seconds | Saturated seconds | Saturation percentage |
|---|---|---|---|
| A | 13519 | 88 | 0.650936% |
| B | 13519 | 444 | 3.284267% |
| C | 13519 | 638 | 4.719284% |
| D | 13519 | 61 | 0.451217% |
Noise dominated data is calculated using 1-second bins in cleaned event files. If a bin has >2000 counts, and if more than 50% of those come from <1% of pixels, then it is considered to be noise-dominated and hence unusable.
| Quadrant | # 1 sec bins | Bins with >0 counts | Bins with >2000 counts | High rate bins dominated by noise | Noise dominated (total time) | Noise dominated (detector-on time) | Marked lightcurve |
|---|---|---|---|---|---|---|---|
| A | 15270 | 13523 | 1 | 1 | 0.01% | 0.01% | 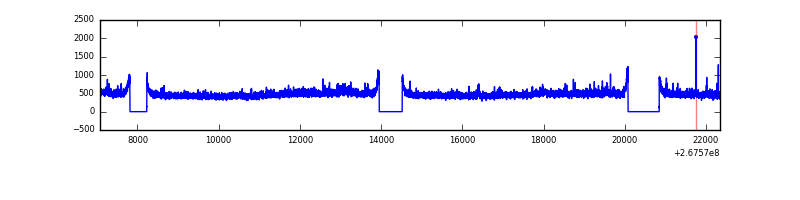 |
| B | 15270 | 13523 | 243 | 243 | 1.59% | 1.80% | 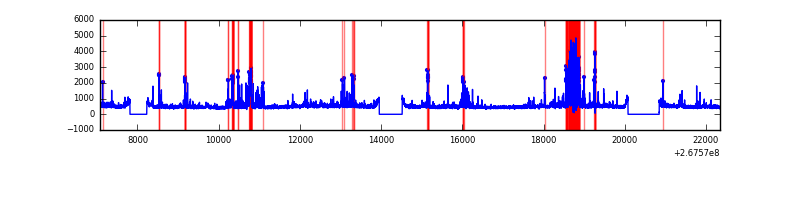 |
| C | 15270 | 13523 | 382 | 382 | 2.50% | 2.82% | 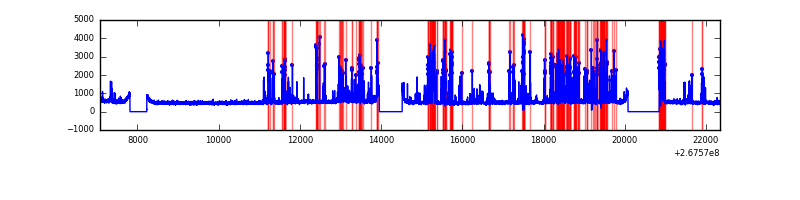 |
| D | 15270 | 13523 | 14 | 14 | 0.09% | 0.10% | 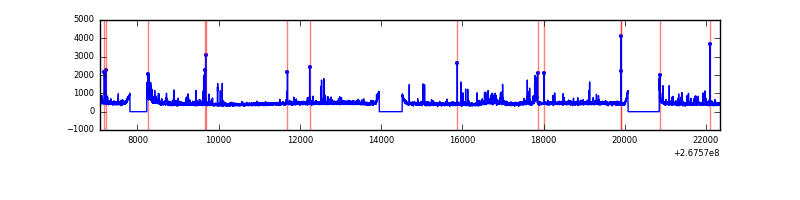 |
Top three noisy pixels from each quadrant. If the there are fewer than three noisy pixels in the level2.evt file, extra rows are filled as -1
| Pixel properties | Quadrant properties | ||||||
|---|---|---|---|---|---|---|---|
| Quadrant | DetID | PixID | Counts | Sigma | Mean | Median | Sigma |
| A | 12 | 189 | 205666 | 621.06 | 1622 | 1589 | 328.6 |
| A | 0 | 226 | 14285 | 38.64 | 1622 | 1589 | 328.6 |
| A | 4 | 2 | 14138 | 38.19 | 1622 | 1589 | 328.6 |
| B | 3 | 64 | 709715 | 2314.85 | 1596 | 1558 | 305.9 |
| B | 15 | 222 | 358125 | 1165.56 | 1596 | 1558 | 305.9 |
| B | 0 | 229 | 159435 | 516.07 | 1596 | 1558 | 305.9 |
| C | 4 | 254 | 2040732 | 5737.74 | 1524 | 1530 | 355.4 |
| C | 3 | 233 | 825563 | 2318.6 | 1524 | 1530 | 355.4 |
| C | 0 | 207 | 33701 | 90.52 | 1524 | 1530 | 355.4 |
| D | 13 | 104 | 159017 | 400.93 | 1556 | 1519 | 392.8 |
| D | 1 | 255 | 81464 | 203.51 | 1556 | 1519 | 392.8 |
| D | 13 | 249 | 75784 | 189.05 | 1556 | 1519 | 392.8 |
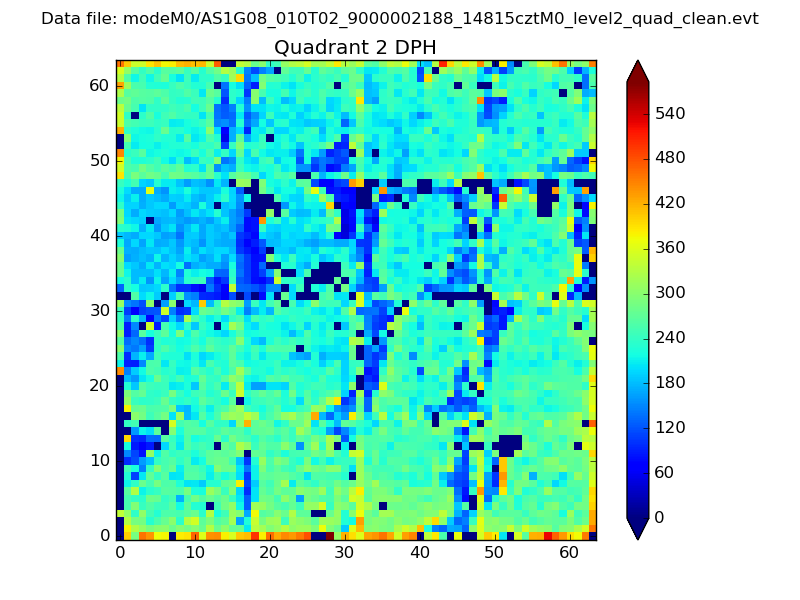
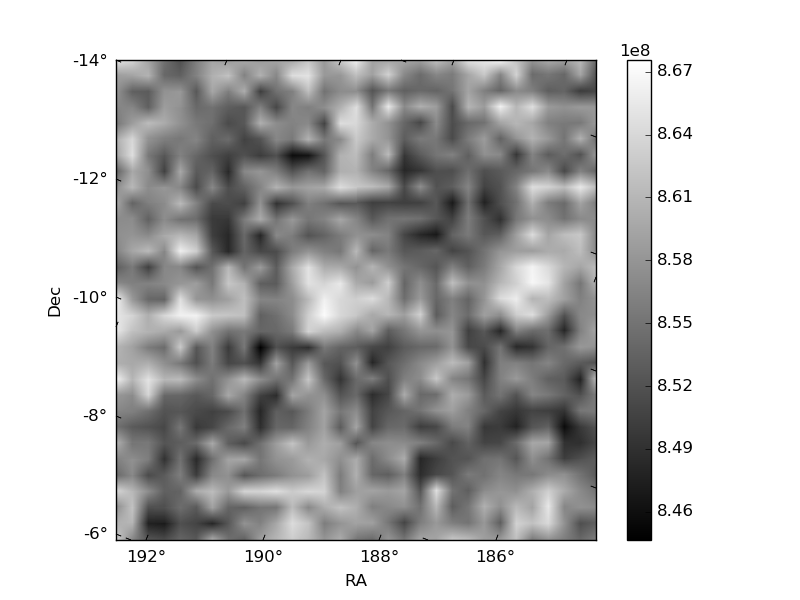
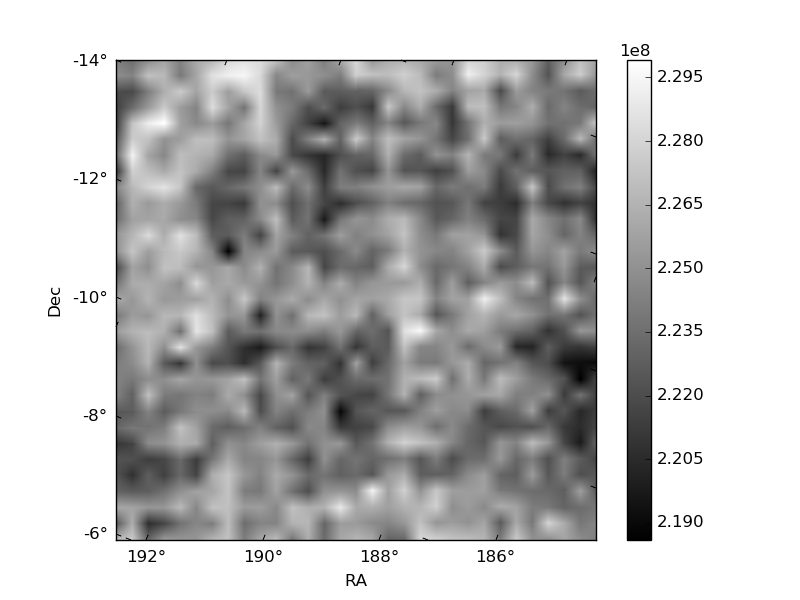
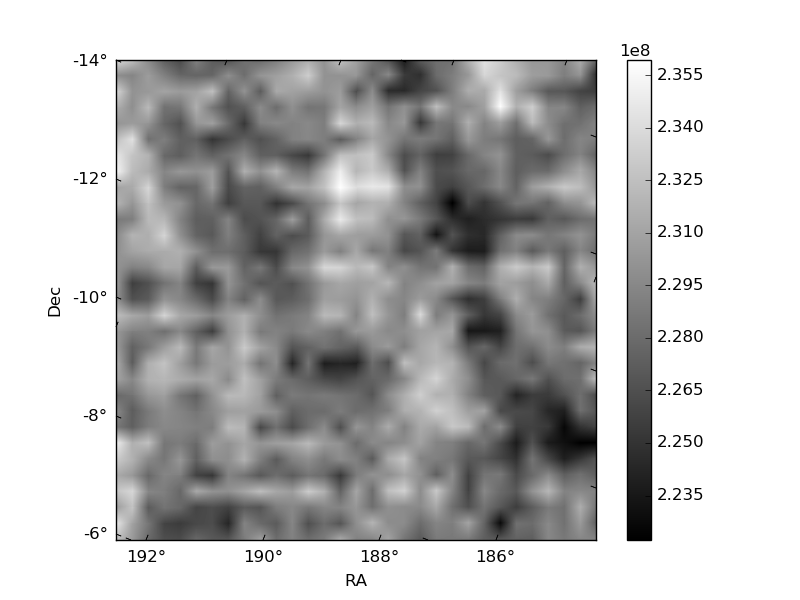
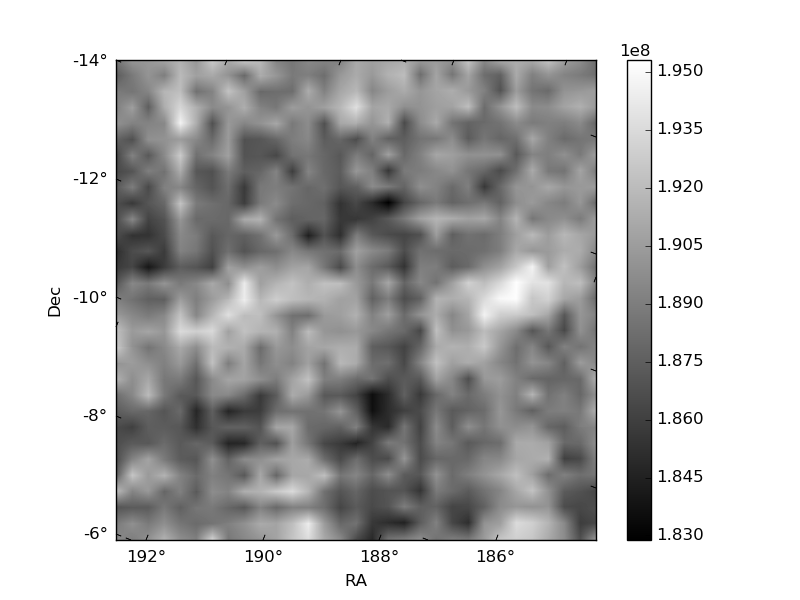
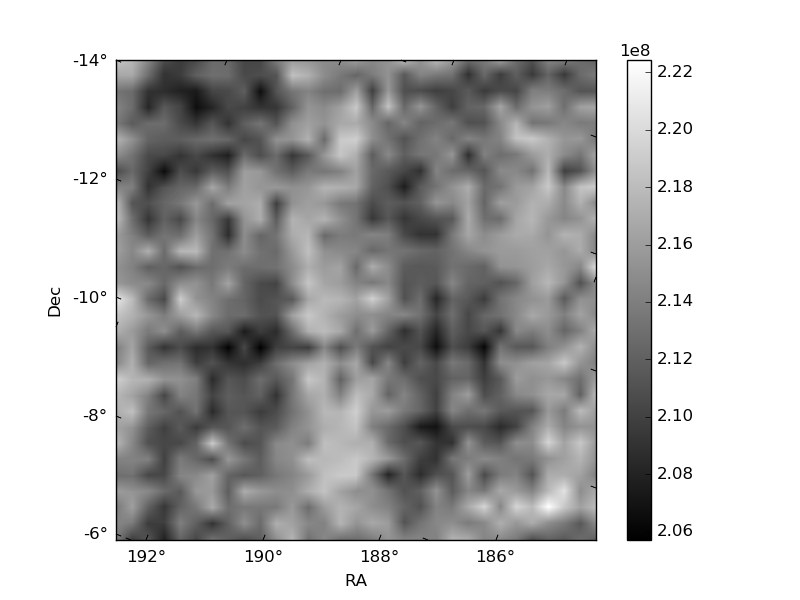
Histogram calculated using DETX and DETY for each event in the final _common_clean file
| Quadrant A | 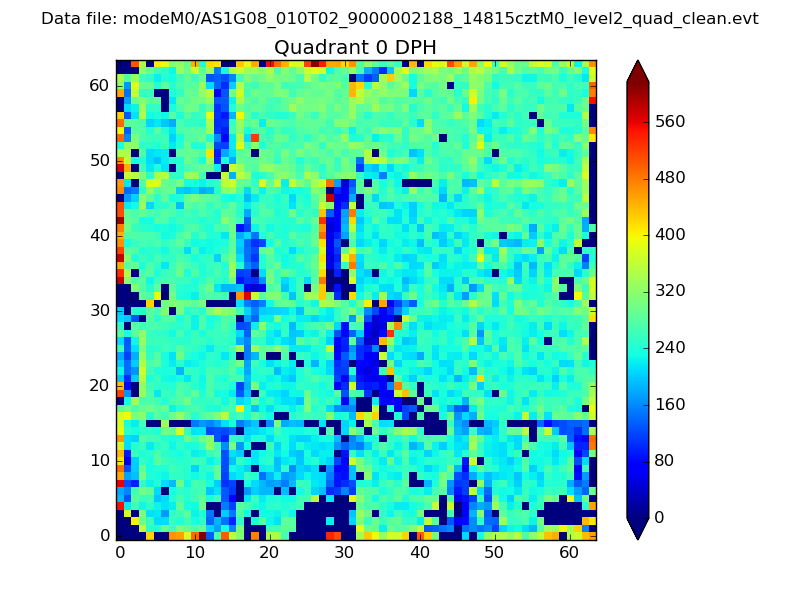 |
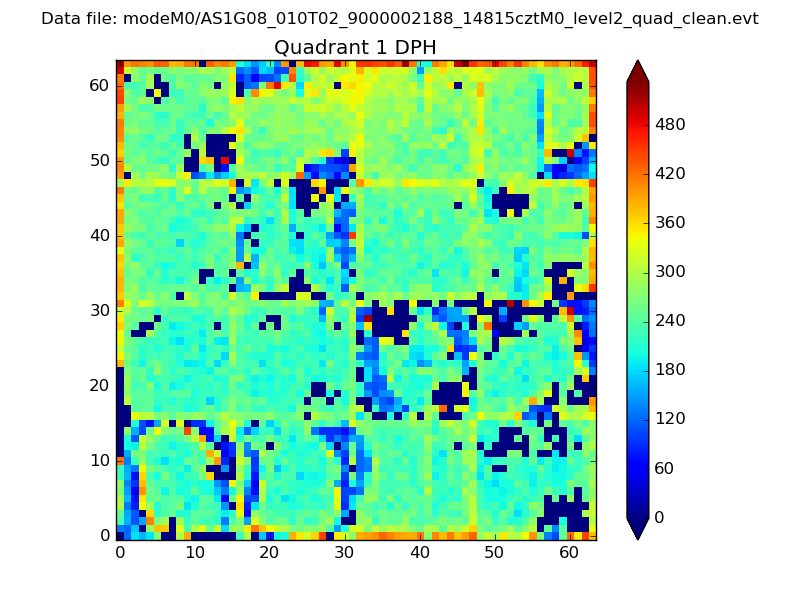 |
Quadrant B |
|---|---|---|---|
| Quadrant D | 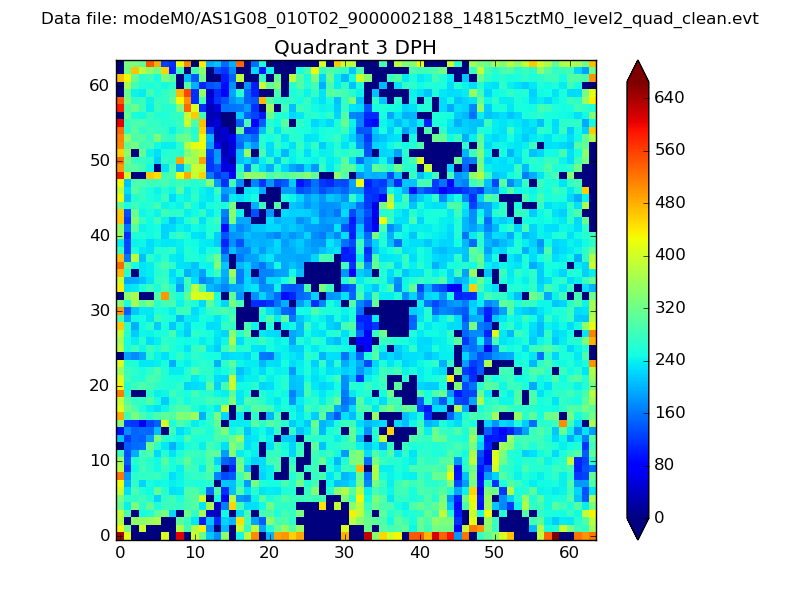 |
 |
Quadrant C |
| Plot type | Count rate plots | Images |
|---|---|---|
| Comparison with Poisson distribution Blue bars denote a histogram of data divided into 1 sec bins. Red curve is a Poisson curve with rate = median count rate of data. |
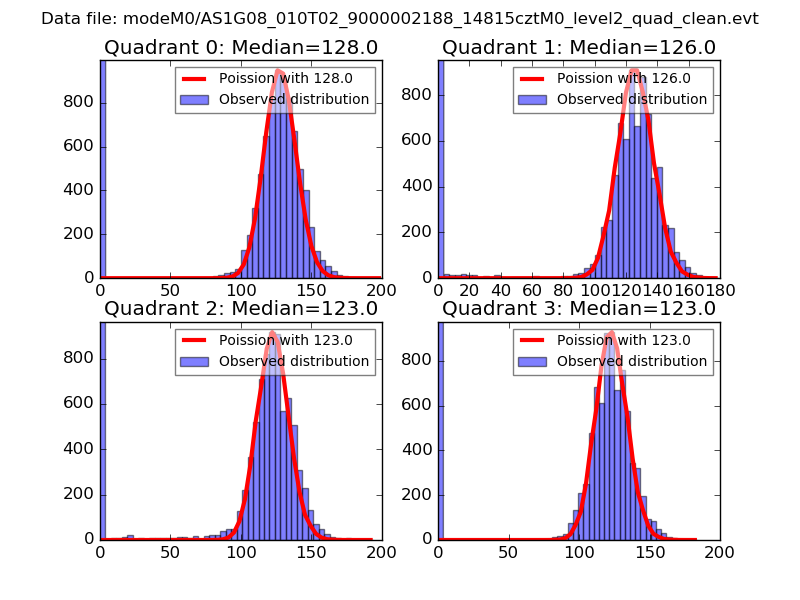 |
 |
| Quadrant-wise count rates Data is divided into 100 sec bins |
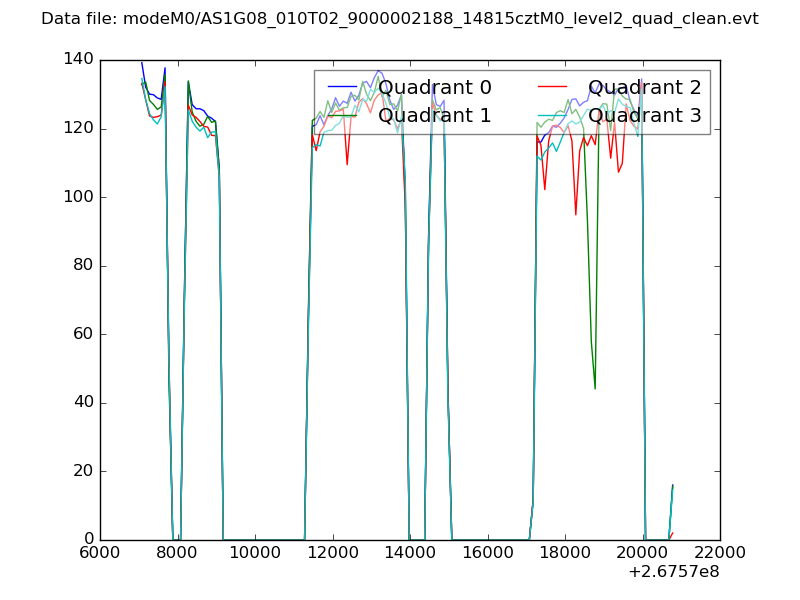 |
|
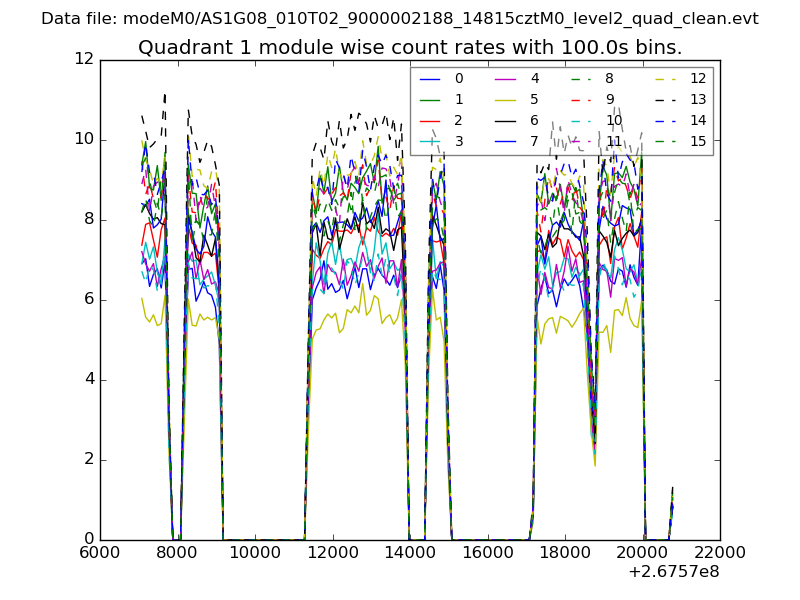
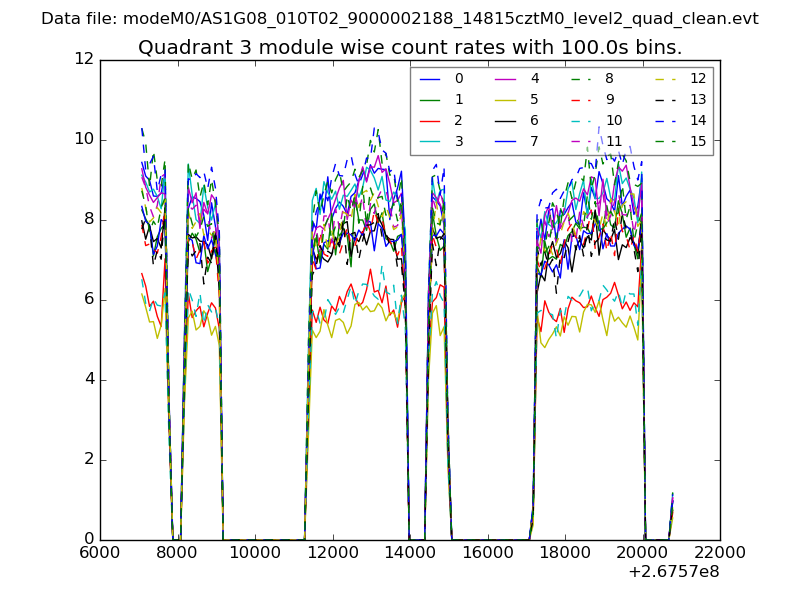
| Module-wise count rates for Quadrant A Data is divided into 100 sec bins |
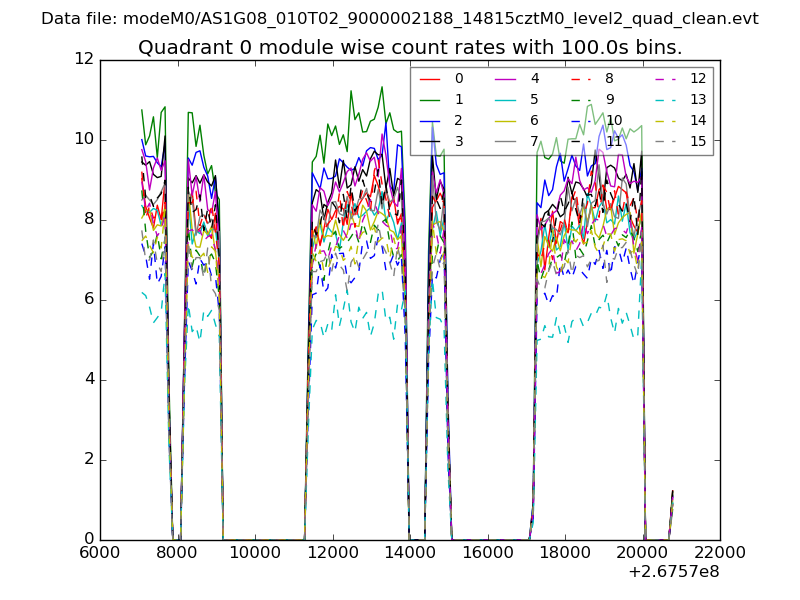 |
 |
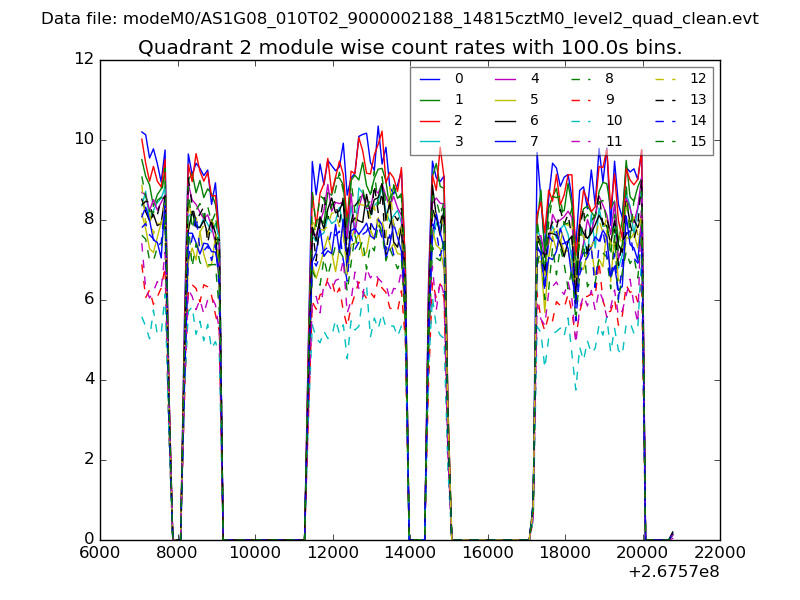
| Module-wise count rates for Quadrant B Data is divided into 100 sec bins |
 |
 |
| Module-wise count rates for Quadrant C Data is divided into 100 sec bins |
 |
 |
| Module-wise count rates for Quadrant D Data is divided into 100 sec bins |
 |
 |
| Parameter | Plot |
|---|---|
| CZT HV Monitor | 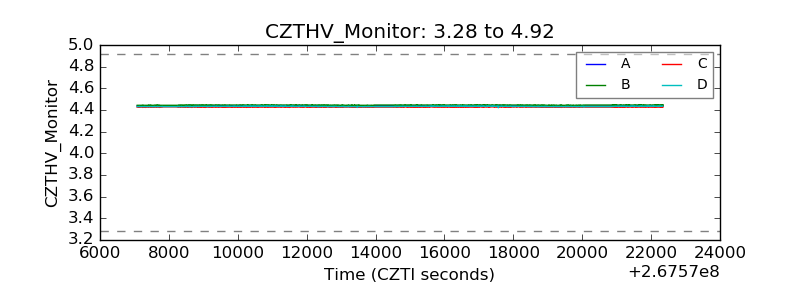 |
| D_VDD | 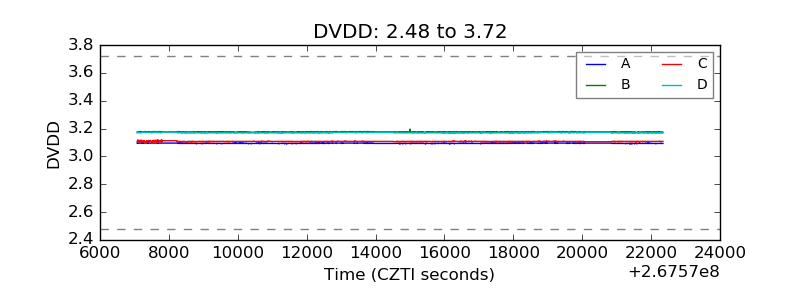 |
| Temperature 1 |  |
| Veto HV Monitor | 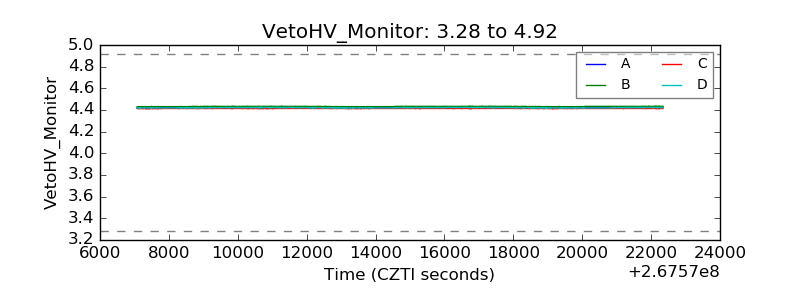 |
| Veto LLD | 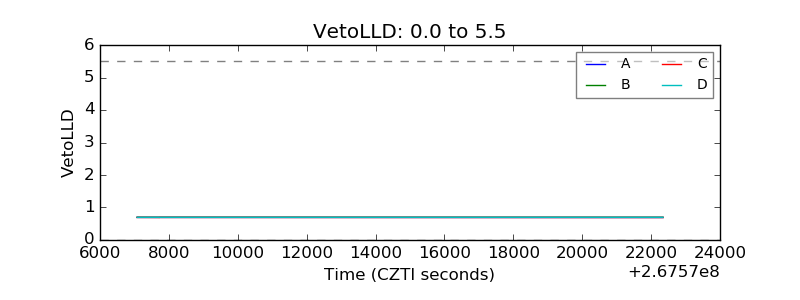 |
| Alpha Counter | 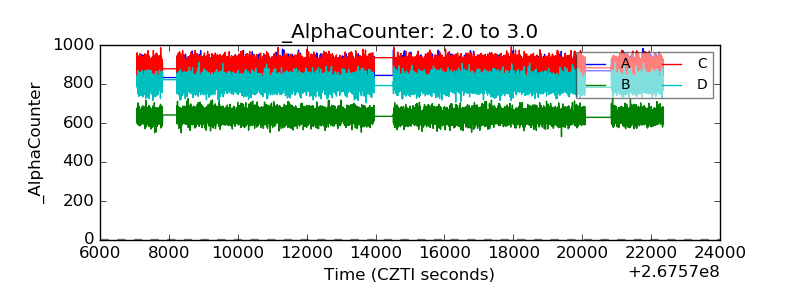 |
| _CPM_Rate | 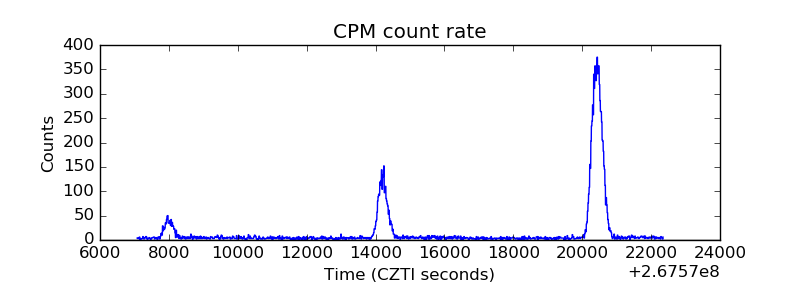 |
| CZT Counter | 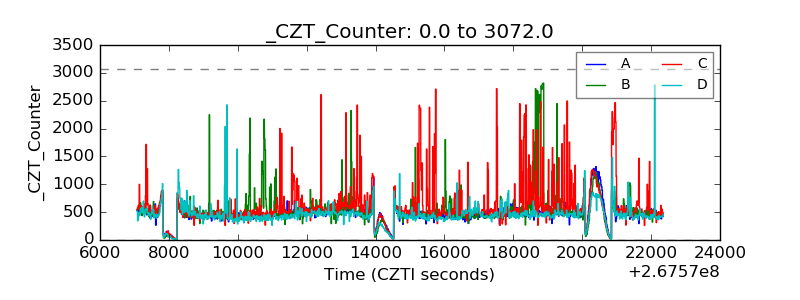 |
| +2.5 Volts monitor |  |
| +5 Volts monitor | 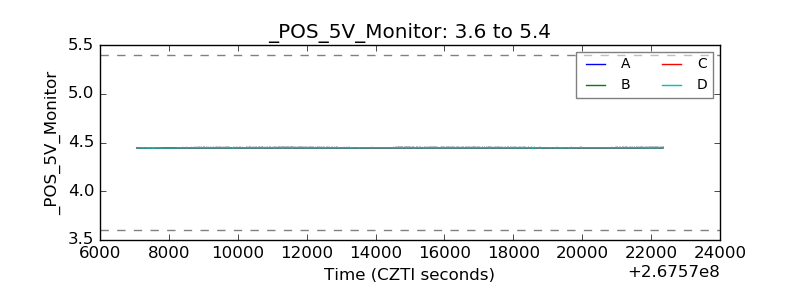 |
| _ROLL_ROT | 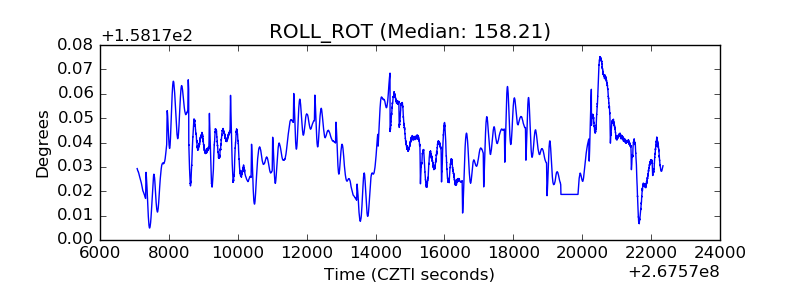 |
| _Roll_DEC |  |
| _Roll_RA | 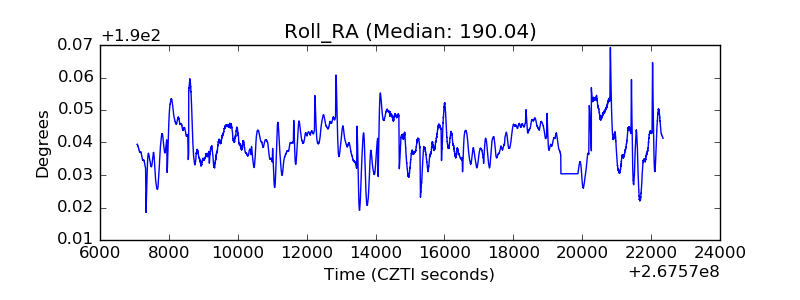 |
| Veto Counter | 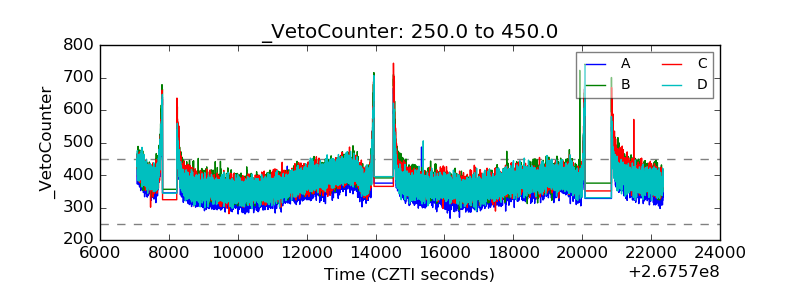 |