| Param | Original file | Final file |
|---|---|---|
| Filename | modeM0/AS1G08_010T02_9000002188_14816cztM0_level2.evt | modeM0/AS1G08_010T02_9000002188_14816cztM0_level2_quad_clean.evt |
| Size (bytes) | 538,839,360 | 64,428,480 |
| Size | 513.9 MB | 61.4 MB |
| Events in quadrant A | 3,134,330 | 390,286 |
| Events in quadrant B | 3,409,616 | 388,939 |
| Events in quadrant C | 5,954,402 | 345,109 |
| Events in quadrant D | 3,382,400 | 375,725 |
| Mode M9 | |||
|---|---|---|---|
| Quadrant | BADHDUFLAG | Total packets | Discarded packets |
| A | 0 | 9 | 0 |
| B | 0 | 9 | 0 |
| C | 0 | 9 | 0 |
| D | 0 | 9 | 0 |
| Mode M0 | |||
|---|---|---|---|
| Quadrant | BADHDUFLAG | Total packets | Discarded packets |
| A | 0 | 13339 | 2 |
| B | 0 | 14132 | 1 |
| C | 0 | 21759 | 1 |
| D | 0 | 14576 | 1 |
| Mode SS | |||
|---|---|---|---|
| Quadrant | BADHDUFLAG | Total packets | Discarded packets |
| A | 0 | 132 | 0 |
| B | 0 | 132 | 0 |
| C | 0 | 132 | 0 |
| D | 0 | 132 | 0 |
| Quadrant | Total seconds | Saturated seconds | Saturation percentage |
|---|---|---|---|
| A | 6452 | 41 | 0.635462% |
| B | 6452 | 94 | 1.456913% |
| C | 6452 | 1019 | 15.793552% |
| D | 6452 | 152 | 2.355859% |
Noise dominated data is calculated using 1-second bins in cleaned event files. If a bin has >2000 counts, and if more than 50% of those come from <1% of pixels, then it is considered to be noise-dominated and hence unusable.
| Quadrant | # 1 sec bins | Bins with >0 counts | Bins with >2000 counts | High rate bins dominated by noise | Noise dominated (total time) | Noise dominated (detector-on time) | Marked lightcurve |
|---|---|---|---|---|---|---|---|
| A | 7378 | 6454 | 6 | 6 | 0.08% | 0.09% | 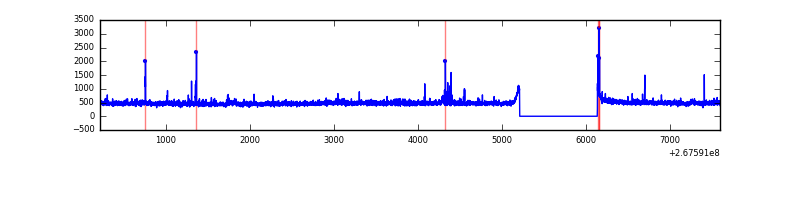 |
| B | 7378 | 6454 | 41 | 41 | 0.56% | 0.64% | 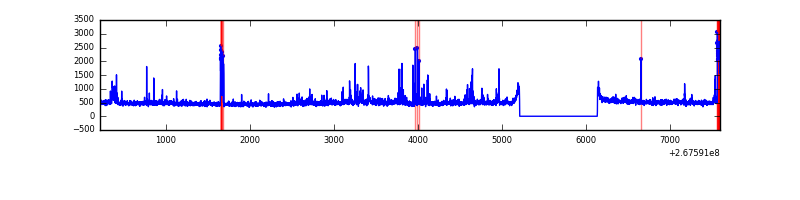 |
| C | 7378 | 6454 | 589 | 589 | 7.98% | 9.13% | 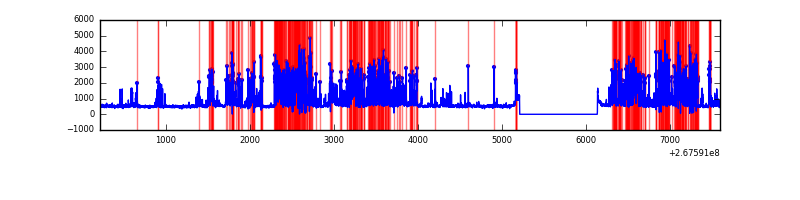 |
| D | 7378 | 6454 | 125 | 125 | 1.69% | 1.94% | 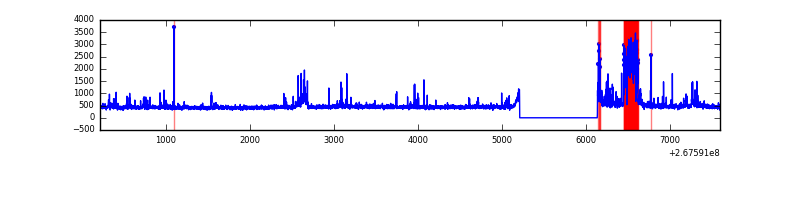 |
Top three noisy pixels from each quadrant. If the there are fewer than three noisy pixels in the level2.evt file, extra rows are filled as -1
| Pixel properties | Quadrant properties | ||||||
|---|---|---|---|---|---|---|---|
| Quadrant | DetID | PixID | Counts | Sigma | Mean | Median | Sigma |
| A | 12 | 189 | 68692 | 431.35 | 779 | 763 | 157.5 |
| A | 9 | 143 | 34376 | 213.45 | 779 | 763 | 157.5 |
| A | 4 | 2 | 34124 | 211.85 | 779 | 763 | 157.5 |
| B | 3 | 64 | 183005 | 1228.25 | 775 | 755 | 148.4 |
| B | 0 | 229 | 36958 | 243.99 | 775 | 755 | 148.4 |
| B | 0 | 189 | 33202 | 218.67 | 775 | 755 | 148.4 |
| C | 4 | 254 | 2863703 | 17690.62 | 692 | 693 | 161.8 |
| C | 3 | 233 | 368773 | 2274.37 | 692 | 693 | 161.8 |
| C | 4 | 238 | 19713 | 117.52 | 692 | 693 | 161.8 |
| D | 7 | 254 | 399582 | 2144.66 | 741 | 721 | 186.0 |
| D | 13 | 104 | 97186 | 518.69 | 741 | 721 | 186.0 |
| D | 13 | 249 | 42078 | 222.38 | 741 | 721 | 186.0 |
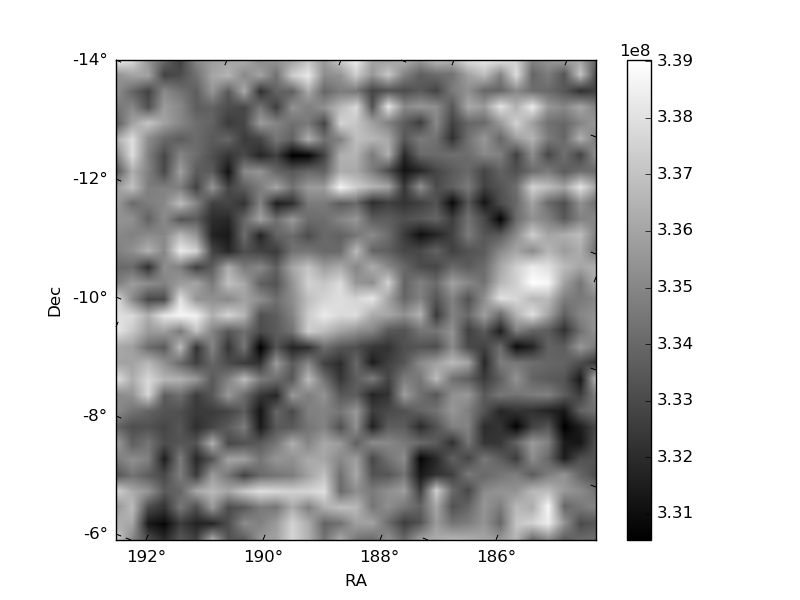
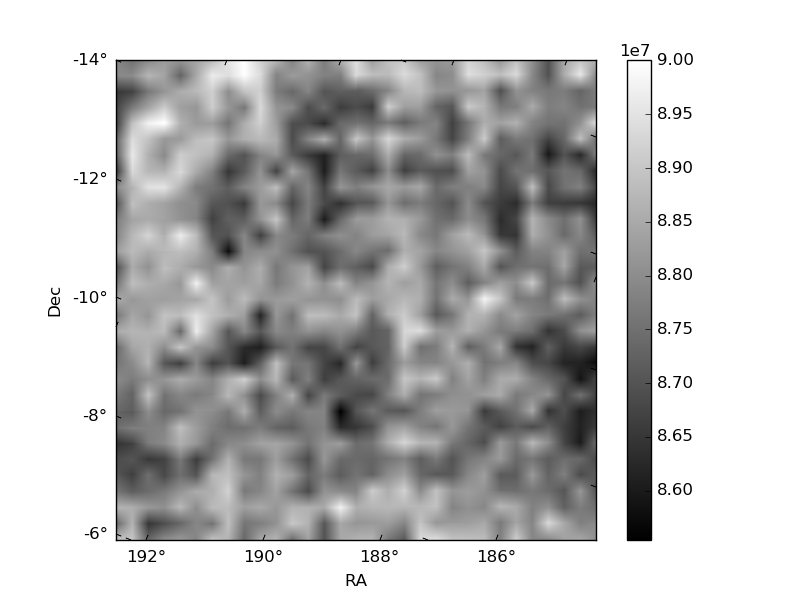
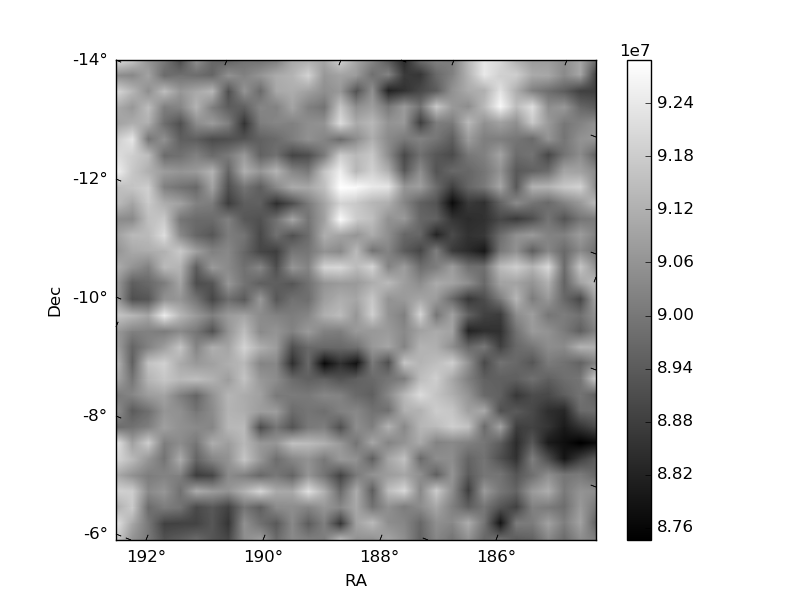
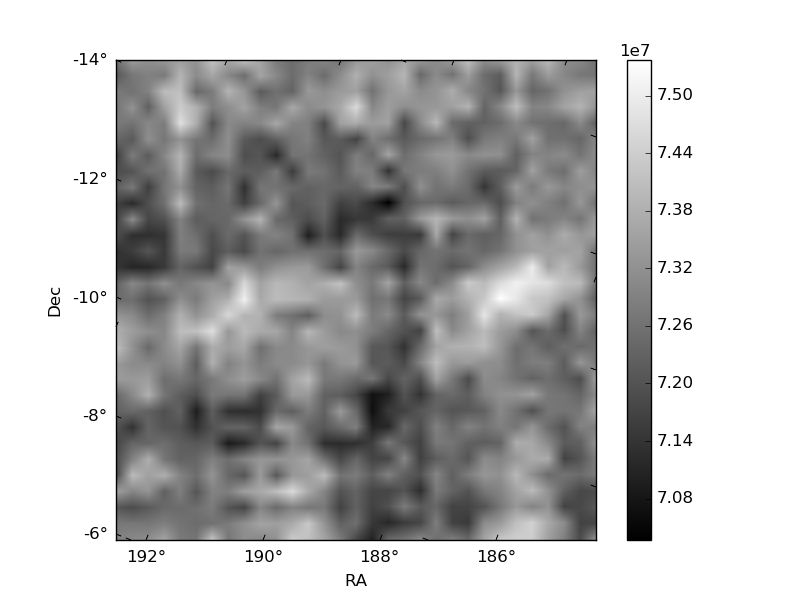
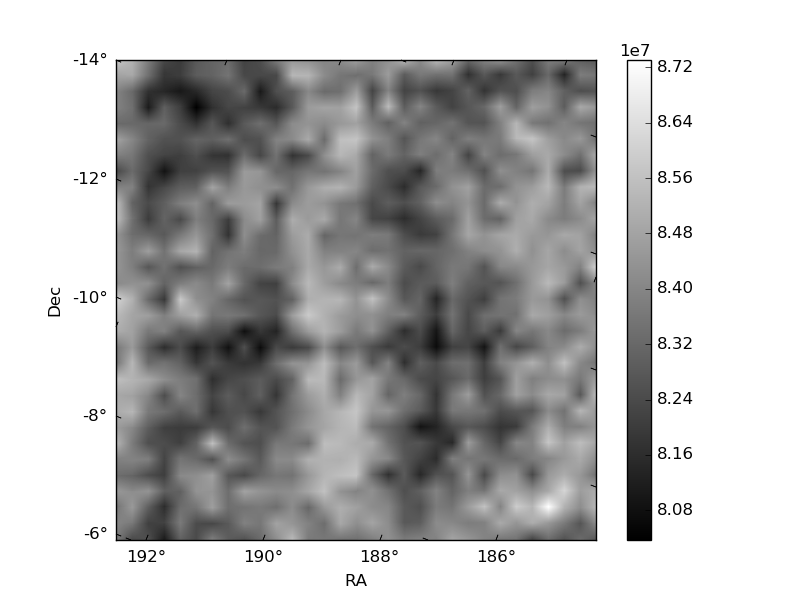
Histogram calculated using DETX and DETY for each event in the final _common_clean file
| Quadrant A | 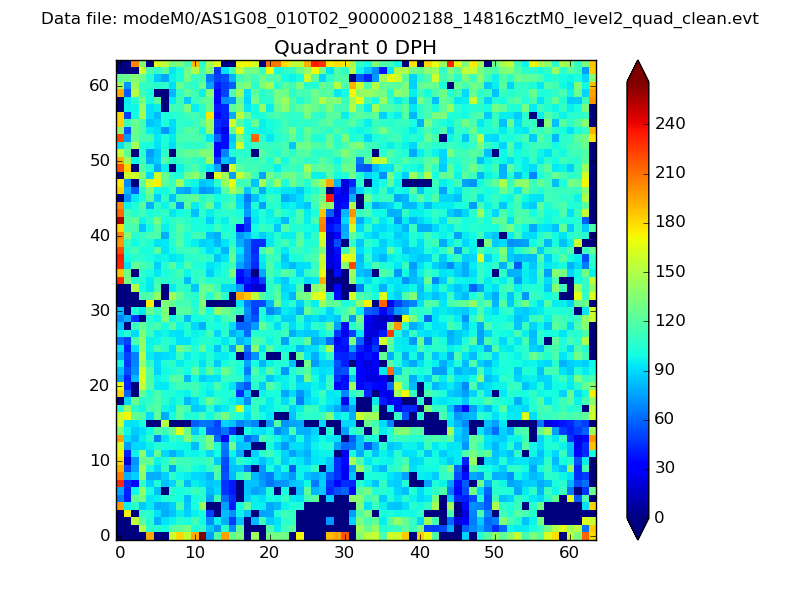 |
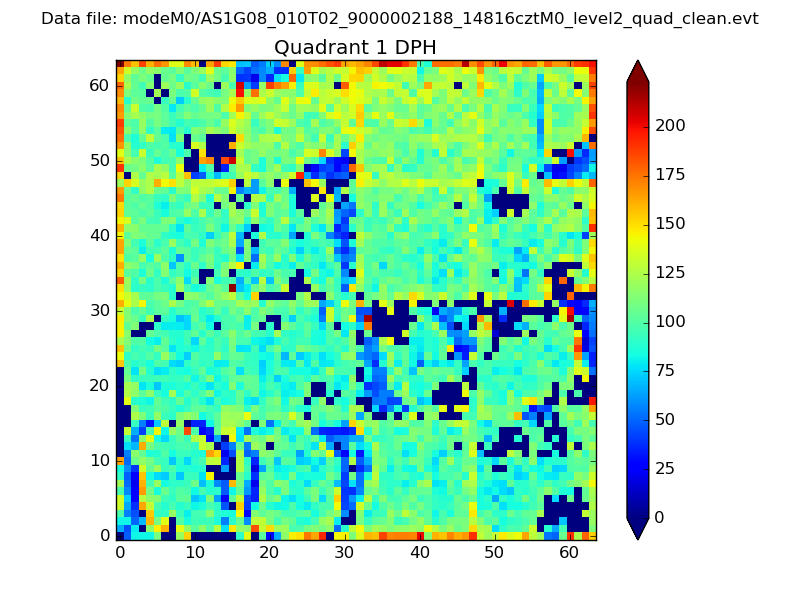 |
Quadrant B |
|---|---|---|---|
| Quadrant D | 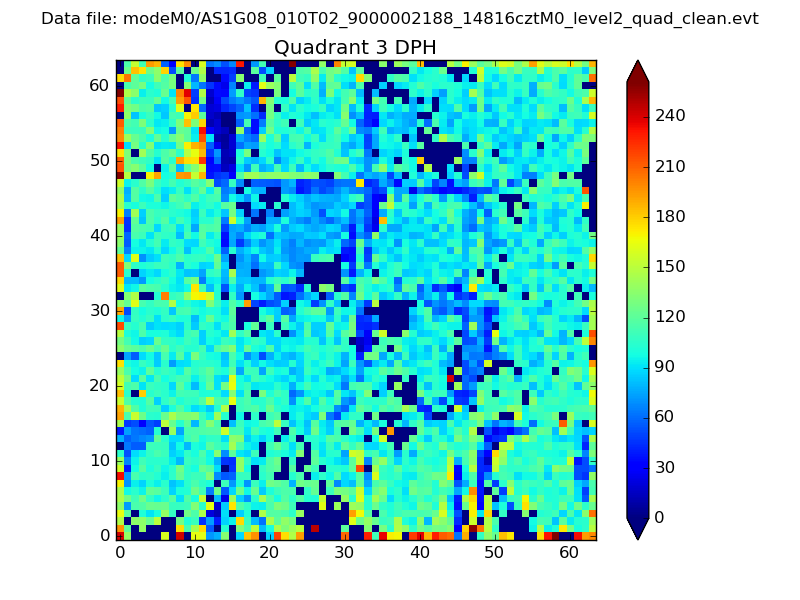 |
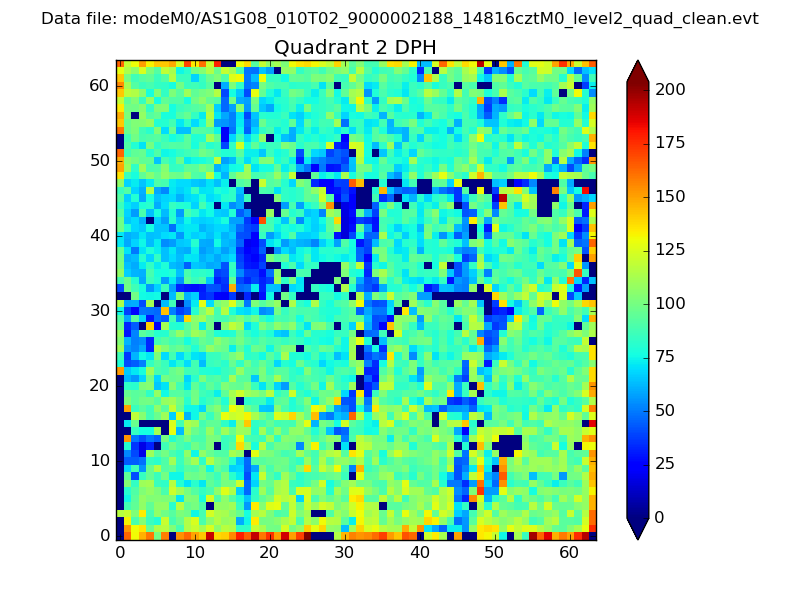 |
Quadrant C |
| Plot type | Count rate plots | Images |
|---|---|---|
| Comparison with Poisson distribution Blue bars denote a histogram of data divided into 1 sec bins. Red curve is a Poisson curve with rate = median count rate of data. |
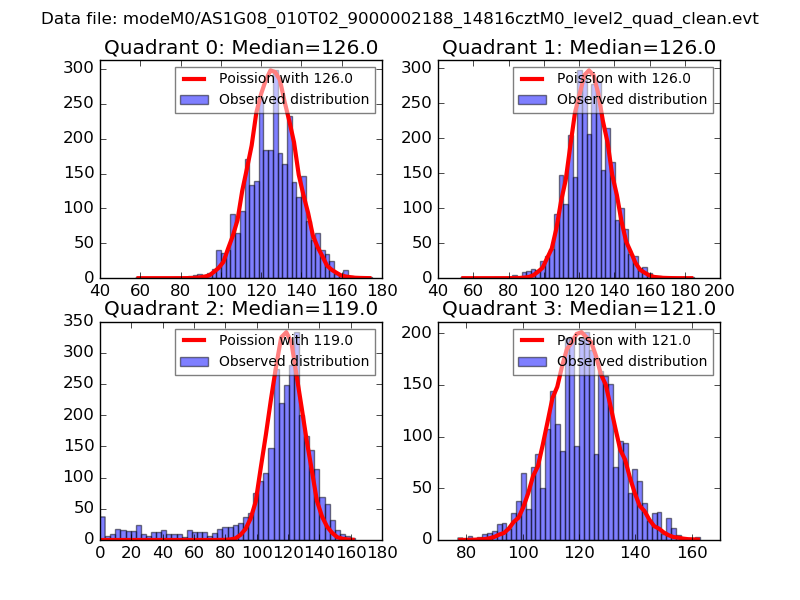 |
 |
| Quadrant-wise count rates Data is divided into 100 sec bins |
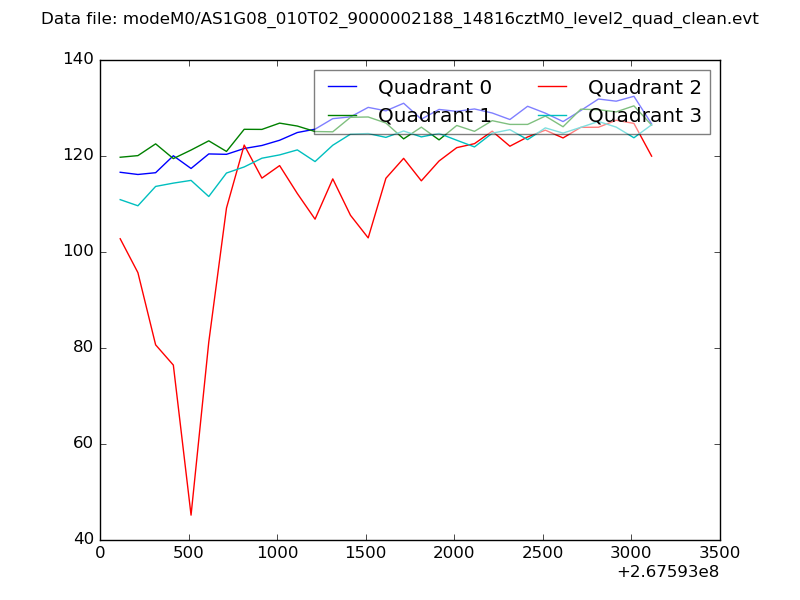 |
|
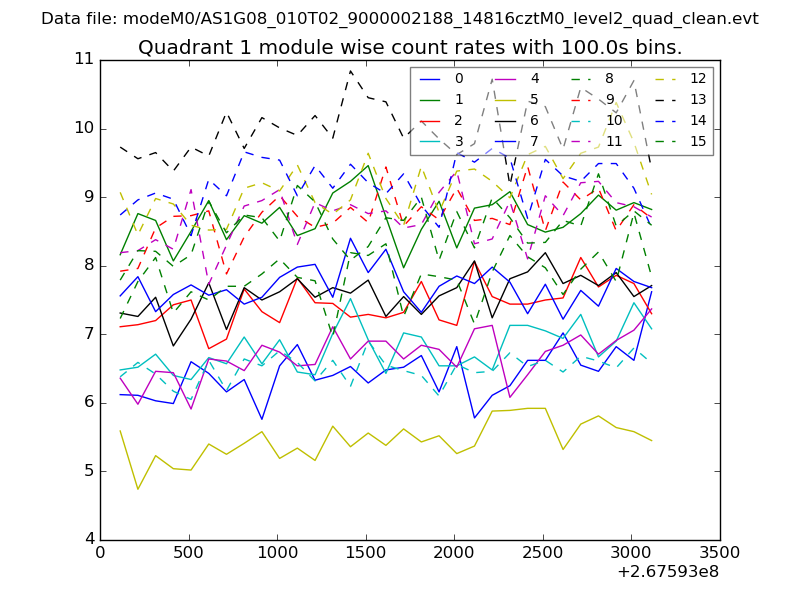
| Module-wise count rates for Quadrant A Data is divided into 100 sec bins |
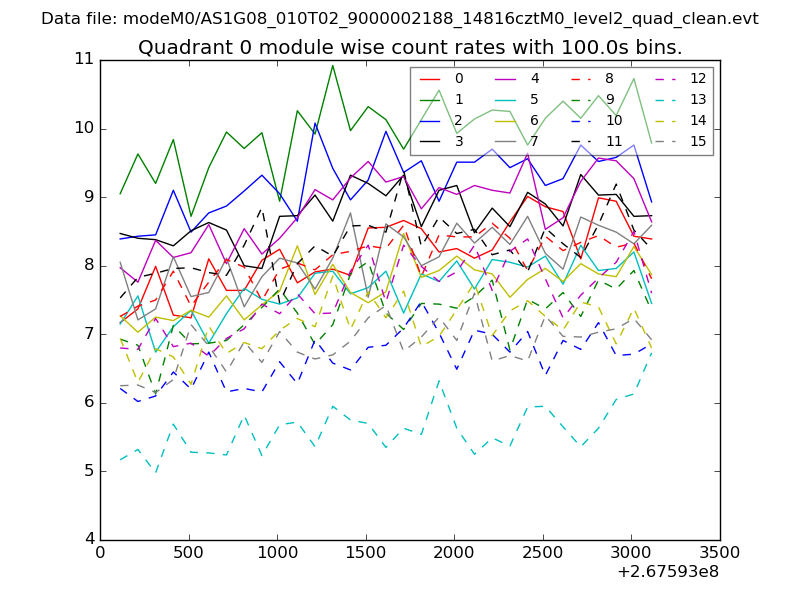 |
 |
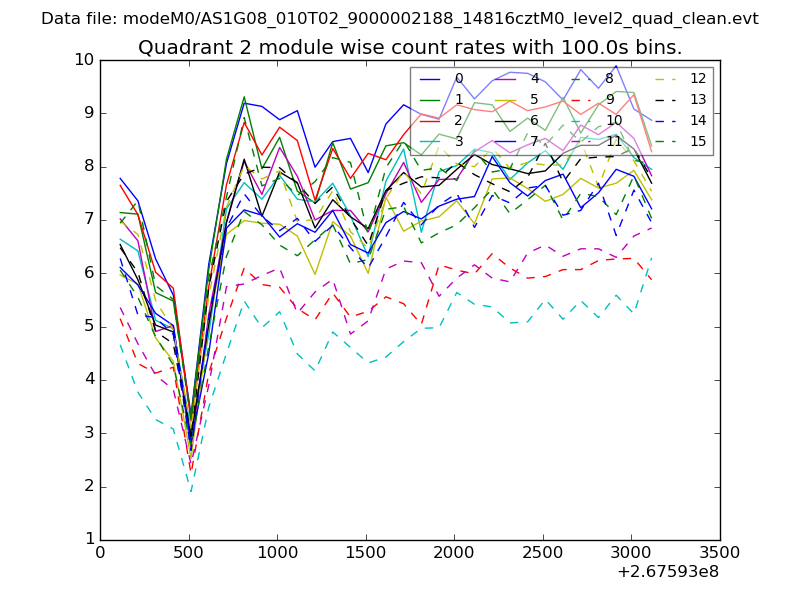
| Module-wise count rates for Quadrant B Data is divided into 100 sec bins |
 |
 |
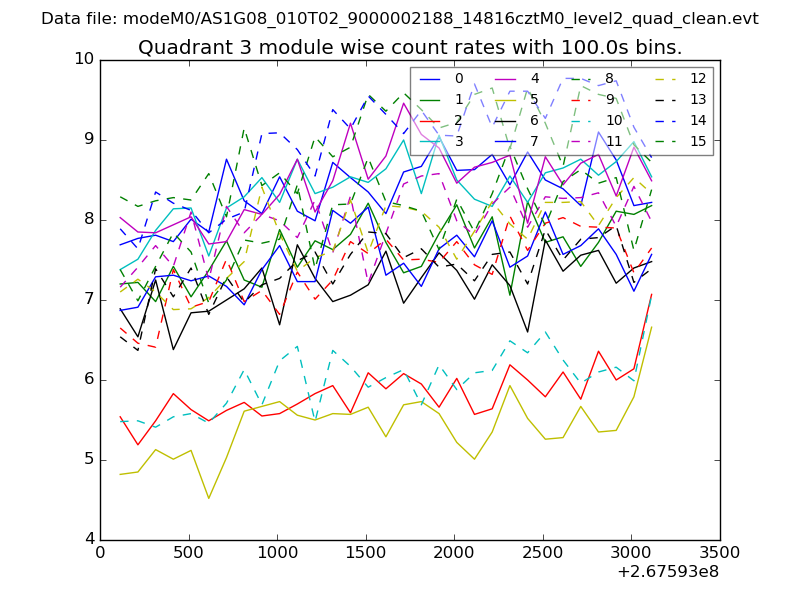
| Module-wise count rates for Quadrant C Data is divided into 100 sec bins |
 |
 |
| Module-wise count rates for Quadrant D Data is divided into 100 sec bins |
 |
 |
| Parameter | Plot |
|---|---|
| CZT HV Monitor | 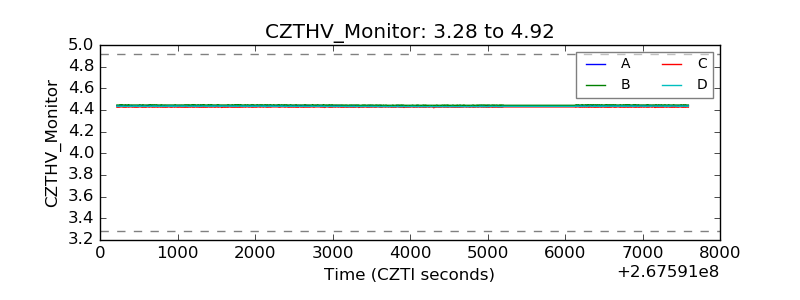 |
| D_VDD | 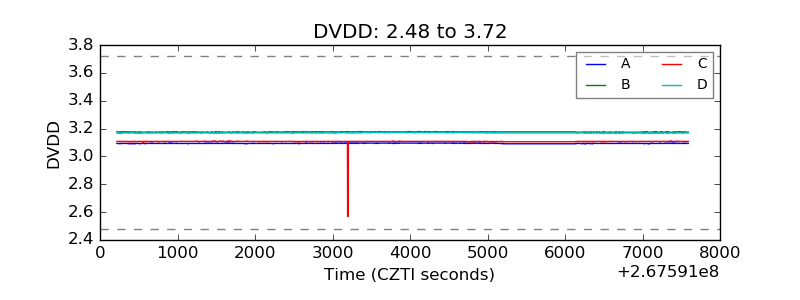 |
| Temperature 1 | 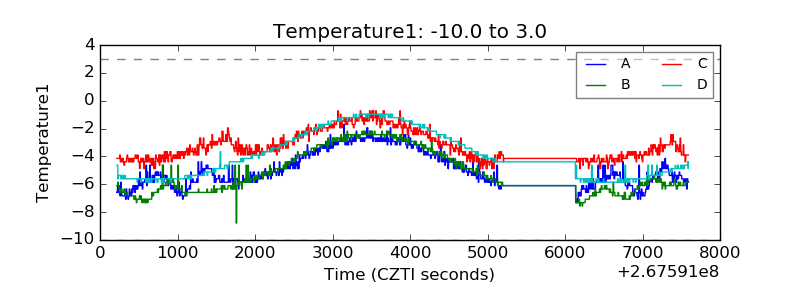 |
| Veto HV Monitor | 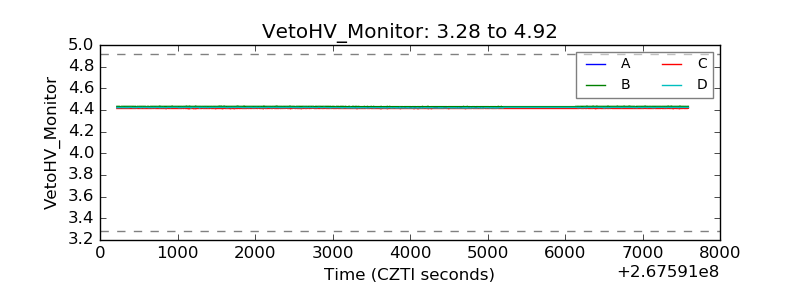 |
| Veto LLD | 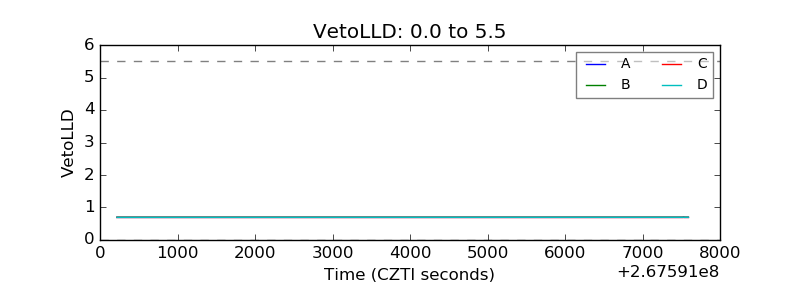 |
| Alpha Counter | 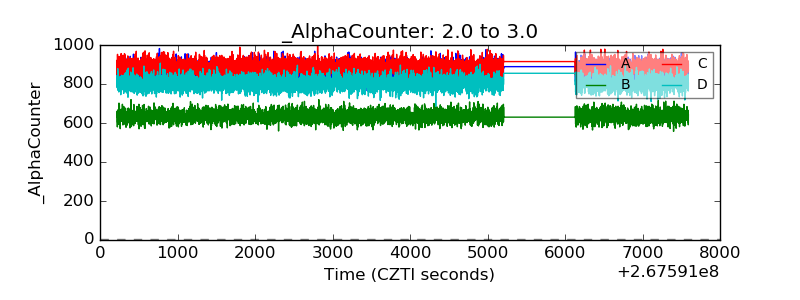 |
| _CPM_Rate | 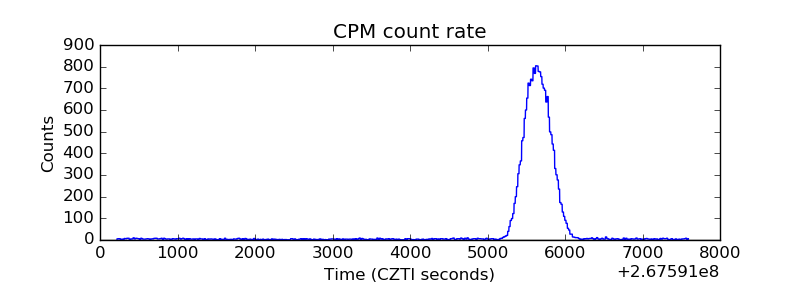 |
| CZT Counter | 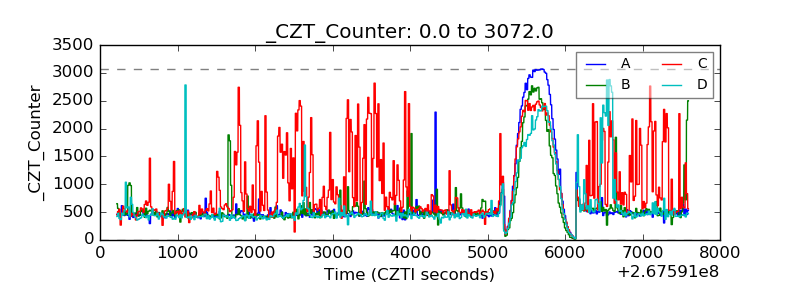 |
| +2.5 Volts monitor |  |
| +5 Volts monitor |  |
| _ROLL_ROT | 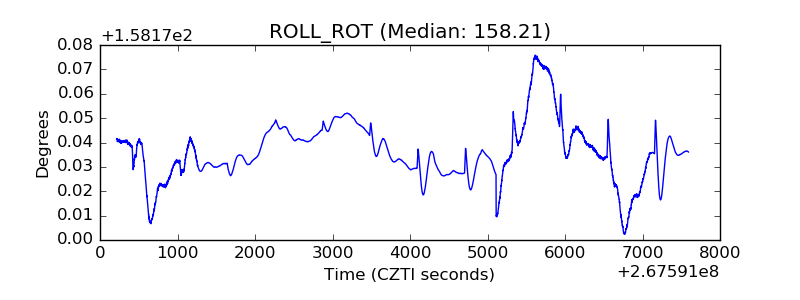 |
| _Roll_DEC |  |
| _Roll_RA | 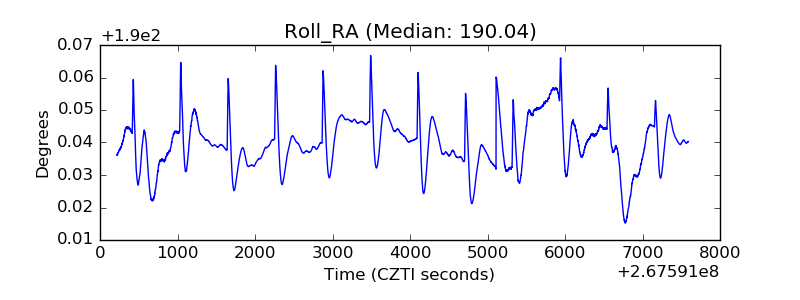 |
| Veto Counter | 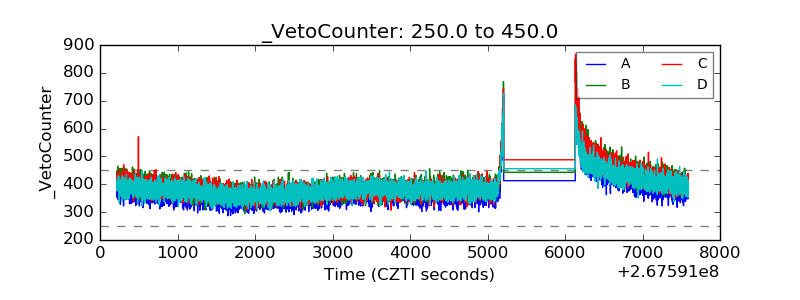 |