| Param | Original file | Final file |
|---|---|---|
| Filename | modeM0/AS1G08_010T02_9000002188_14817cztM0_level2.evt | modeM0/AS1G08_010T02_9000002188_14817cztM0_level2_quad_clean.evt |
| Size (bytes) | 570,234,240 | 72,797,760 |
| Size | 543.8 MB | 69.4 MB |
| Events in quadrant A | 3,416,975 | 444,694 |
| Events in quadrant B | 4,463,629 | 434,197 |
| Events in quadrant C | 4,917,152 | 430,258 |
| Events in quadrant D | 4,019,401 | 429,624 |
| Mode M9 | |||
|---|---|---|---|
| Quadrant | BADHDUFLAG | Total packets | Discarded packets |
| A | 0 | 11 | 0 |
| B | 0 | 11 | 0 |
| C | 0 | 11 | 0 |
| D | 0 | 12 | 0 |
| Mode M0 | |||
|---|---|---|---|
| Quadrant | BADHDUFLAG | Total packets | Discarded packets |
| A | 0 | 14167 | 3 |
| B | 0 | 17311 | 2 |
| C | 0 | 18634 | 2 |
| D | 0 | 16486 | 2 |
| Mode SS | |||
|---|---|---|---|
| Quadrant | BADHDUFLAG | Total packets | Discarded packets |
| A | 0 | 134 | 0 |
| B | 0 | 134 | 0 |
| C | 0 | 134 | 0 |
| D | 0 | 134 | 0 |
| Quadrant | Total seconds | Saturated seconds | Saturation percentage |
|---|---|---|---|
| A | 6680 | 64 | 0.958084% |
| B | 6680 | 416 | 6.227545% |
| C | 6680 | 570 | 8.532934% |
| D | 6680 | 218 | 3.263473% |
Noise dominated data is calculated using 1-second bins in cleaned event files. If a bin has >2000 counts, and if more than 50% of those come from <1% of pixels, then it is considered to be noise-dominated and hence unusable.
| Quadrant | # 1 sec bins | Bins with >0 counts | Bins with >2000 counts | High rate bins dominated by noise | Noise dominated (total time) | Noise dominated (detector-on time) | Marked lightcurve |
|---|---|---|---|---|---|---|---|
| A | 7751 | 6682 | 7 | 7 | 0.09% | 0.10% | 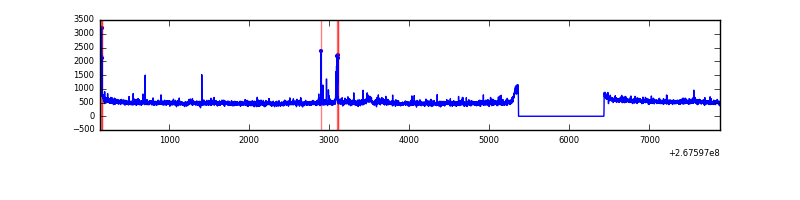 |
| B | 7751 | 6682 | 284 | 284 | 3.66% | 4.25% | 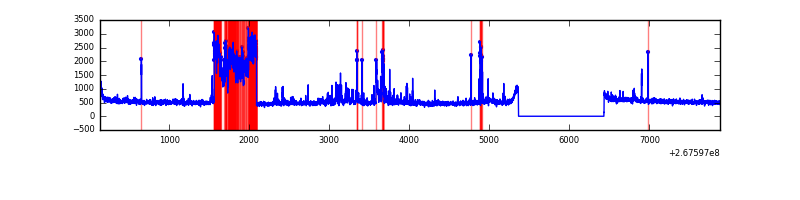 |
| C | 7751 | 6682 | 315 | 315 | 4.06% | 4.71% | 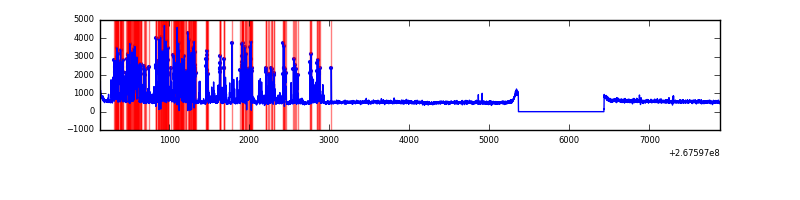 |
| D | 7751 | 6682 | 157 | 157 | 2.03% | 2.35% | 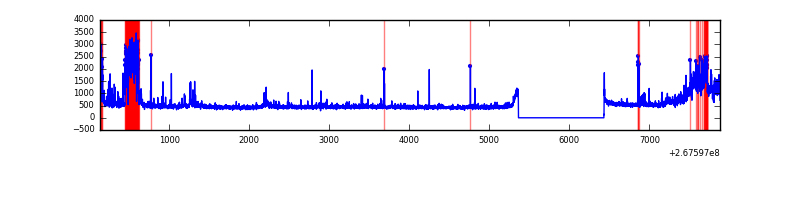 |
Top three noisy pixels from each quadrant. If the there are fewer than three noisy pixels in the level2.evt file, extra rows are filled as -1
| Pixel properties | Quadrant properties | ||||||
|---|---|---|---|---|---|---|---|
| Quadrant | DetID | PixID | Counts | Sigma | Mean | Median | Sigma |
| A | 12 | 189 | 125260 | 730.98 | 843 | 827 | 170.2 |
| A | 9 | 143 | 48072 | 277.54 | 843 | 827 | 170.2 |
| A | 0 | 226 | 7394 | 38.58 | 843 | 827 | 170.2 |
| B | 3 | 64 | 972444 | 6201.15 | 824 | 806 | 156.7 |
| B | 0 | 189 | 68174 | 429.95 | 824 | 806 | 156.7 |
| B | 0 | 229 | 55623 | 349.85 | 824 | 806 | 156.7 |
| C | 4 | 254 | 1556612 | 8654.4 | 778 | 782 | 179.8 |
| C | 3 | 233 | 314413 | 1744.59 | 778 | 782 | 179.8 |
| C | 4 | 238 | 7692 | 38.44 | 778 | 782 | 179.8 |
| D | 7 | 254 | 557020 | 2830.16 | 801 | 781 | 196.5 |
| D | 13 | 104 | 379284 | 1925.84 | 801 | 781 | 196.5 |
| D | 2 | 234 | 22383 | 109.91 | 801 | 781 | 196.5 |
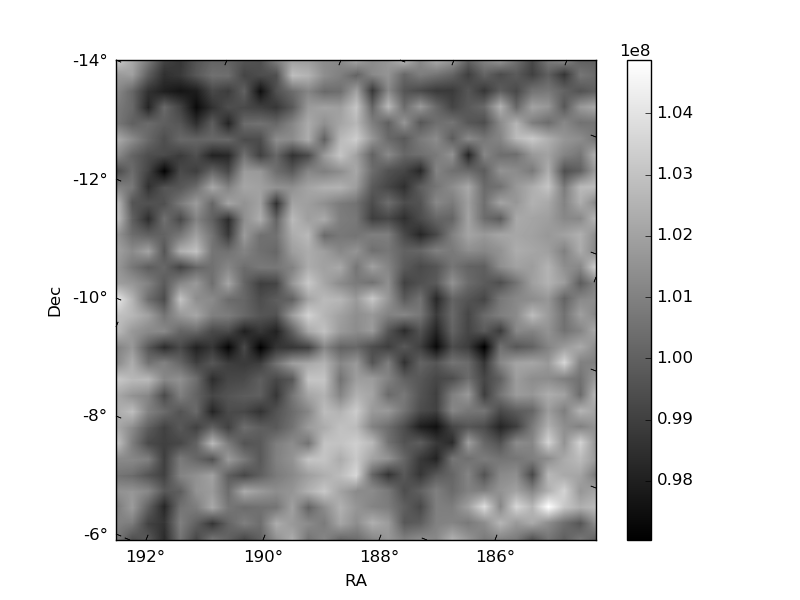
Histogram calculated using DETX and DETY for each event in the final _common_clean file
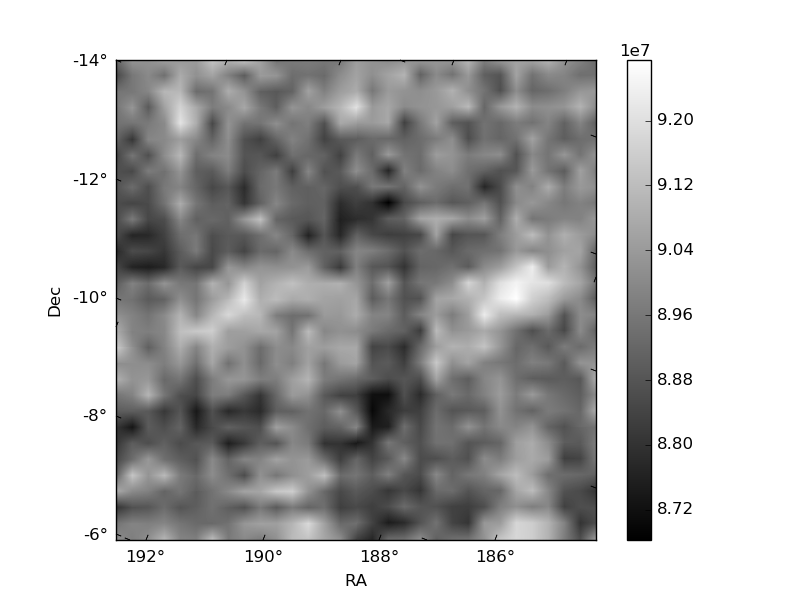
| Quadrant A | 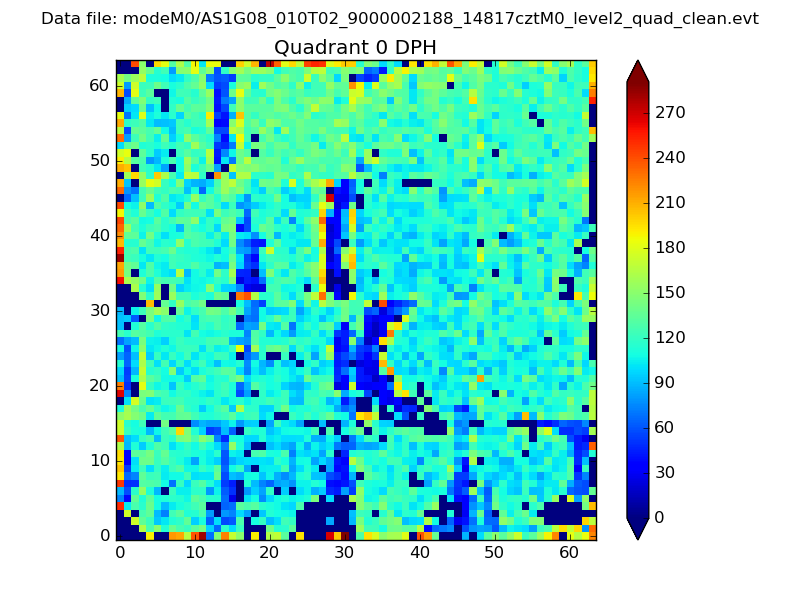 |
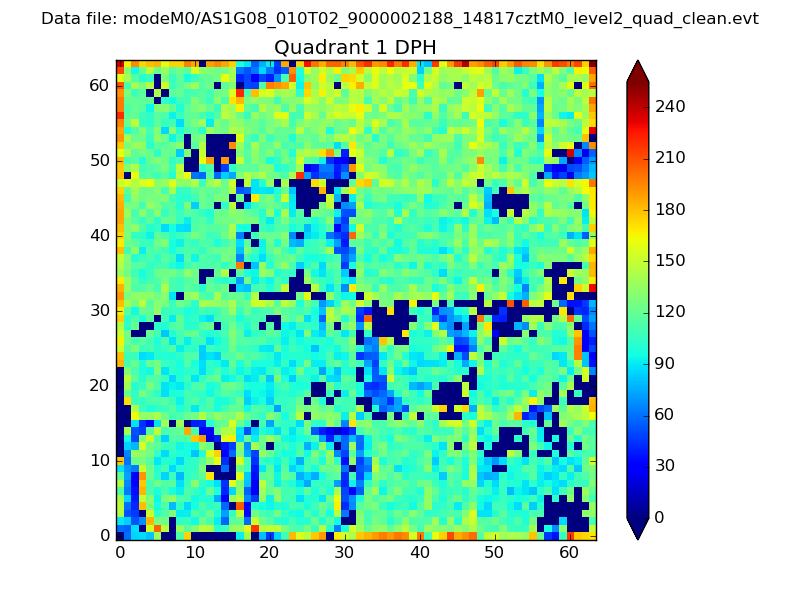 |
Quadrant B |
|---|---|---|---|
| Quadrant D |  |
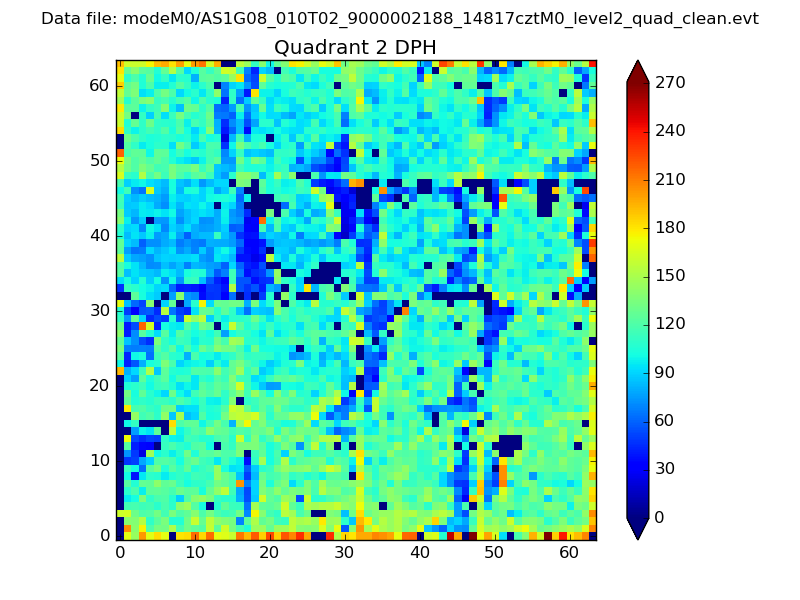 |
Quadrant C |
| Plot type | Count rate plots | Images |
|---|---|---|
| Comparison with Poisson distribution Blue bars denote a histogram of data divided into 1 sec bins. Red curve is a Poisson curve with rate = median count rate of data. |
 |
 |
| Quadrant-wise count rates Data is divided into 100 sec bins |
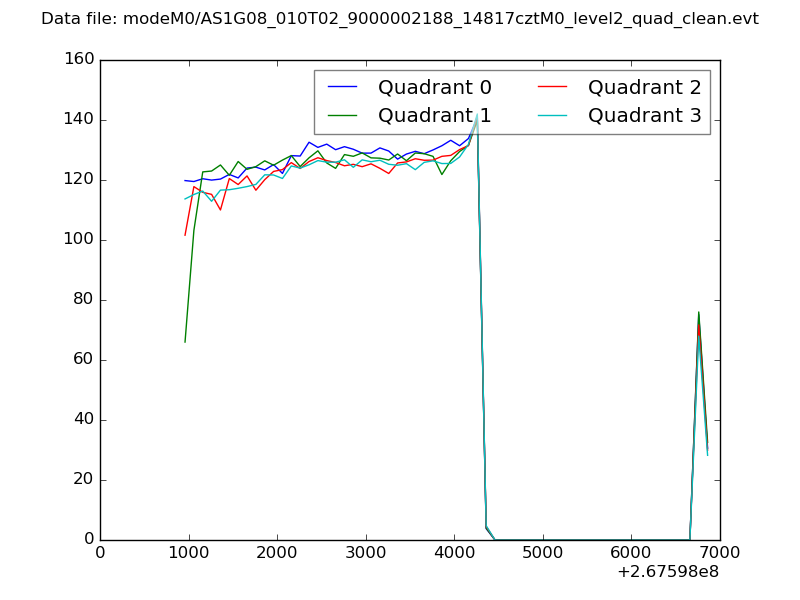 |
|
| Module-wise count rates for Quadrant A Data is divided into 100 sec bins |
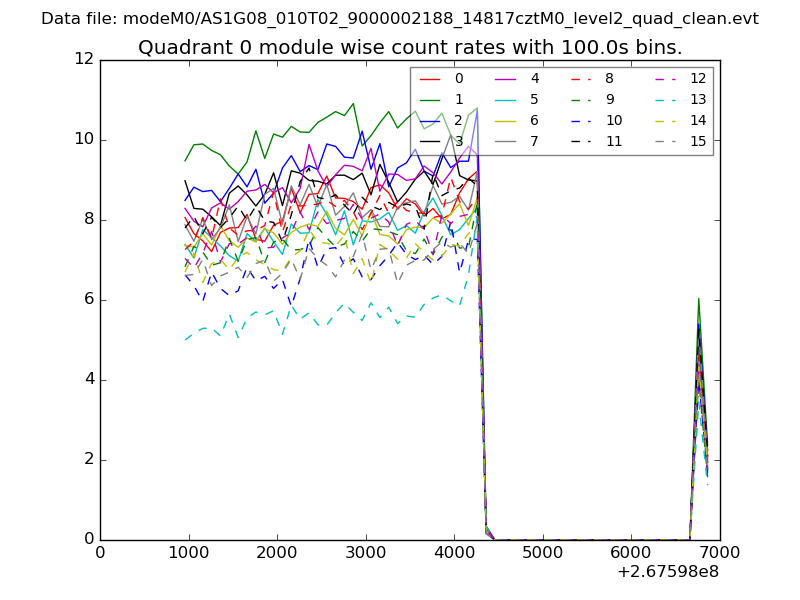 |
 |
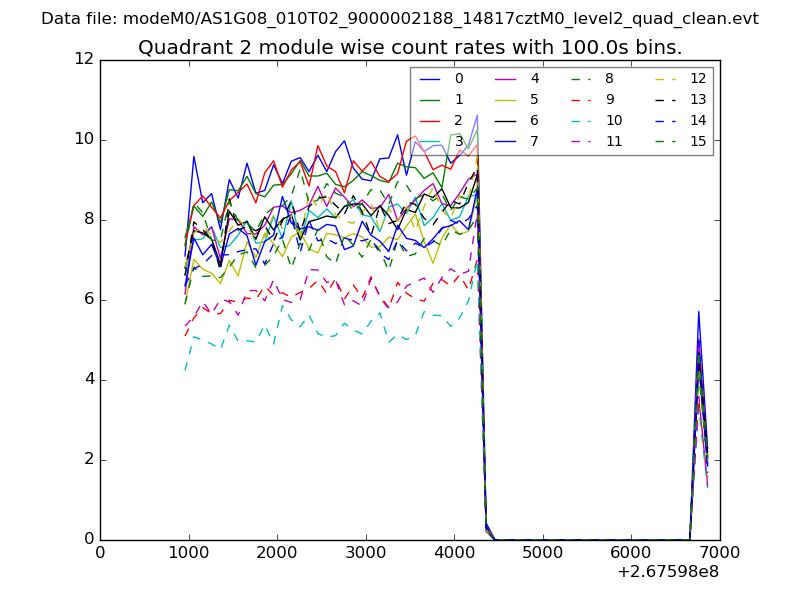
| Module-wise count rates for Quadrant B Data is divided into 100 sec bins |
 |
 |
| Module-wise count rates for Quadrant C Data is divided into 100 sec bins |
 |
 |
| Module-wise count rates for Quadrant D Data is divided into 100 sec bins |
 |
 |
| Parameter | Plot |
|---|---|
| CZT HV Monitor |  |
| D_VDD | 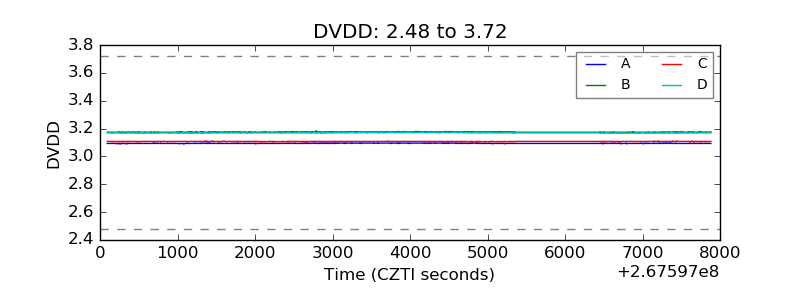 |
| Temperature 1 | 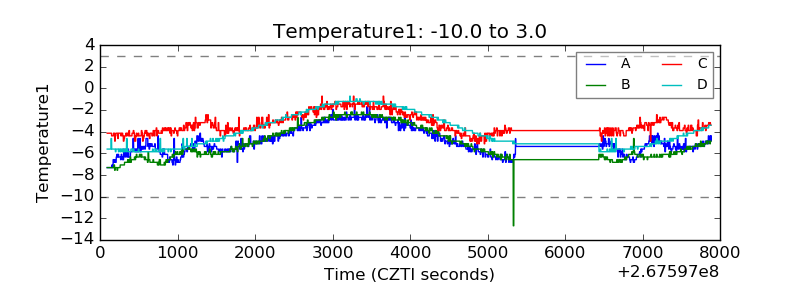 |
| Veto HV Monitor | 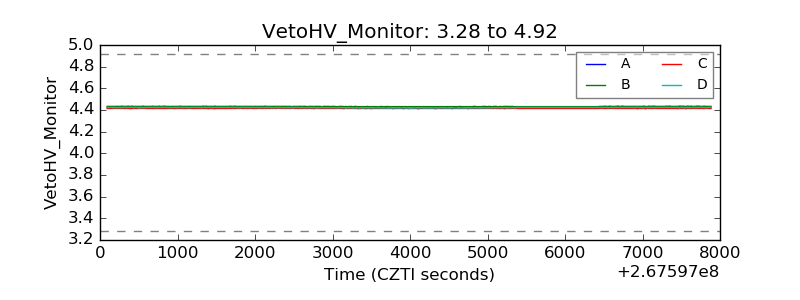 |
| Veto LLD |  |
| Alpha Counter | 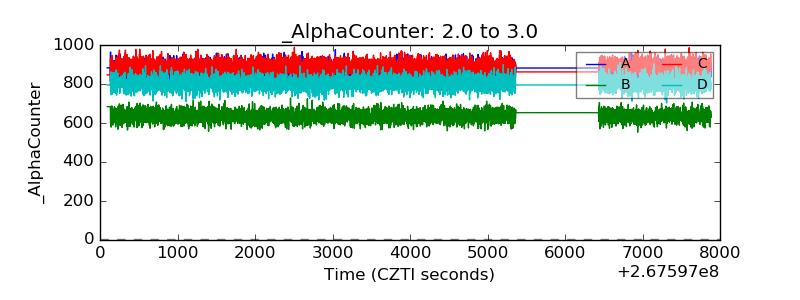 |
| _CPM_Rate | 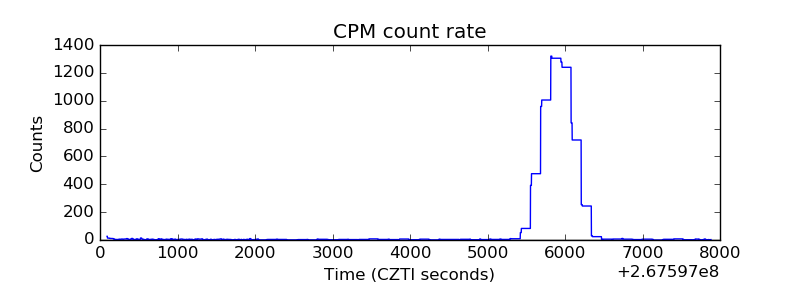 |
| CZT Counter | 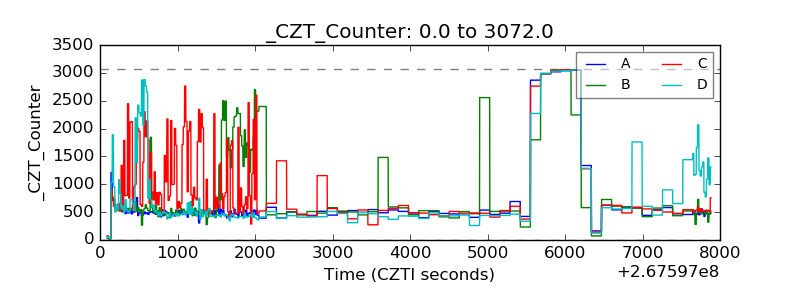 |
| +2.5 Volts monitor |  |
| +5 Volts monitor |  |
| _ROLL_ROT |  |
| _Roll_DEC | 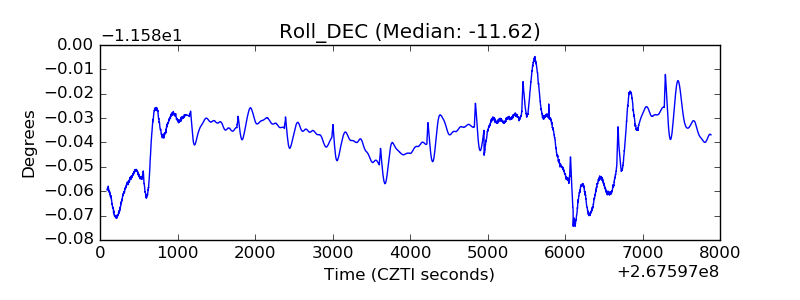 |
| _Roll_RA | 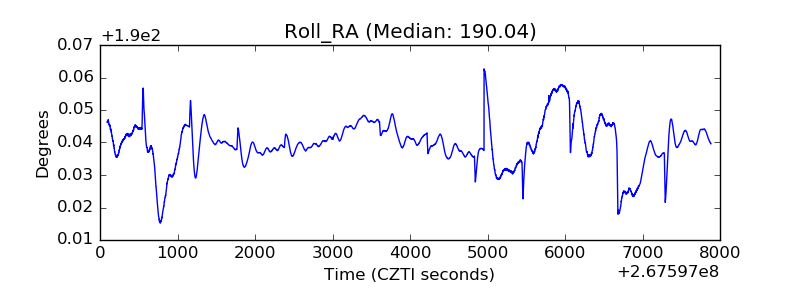 |
| Veto Counter |  |