| Param | Original file | Final file |
|---|---|---|
| Filename | modeM0/AS1G08_010T02_9000002188_14818cztM0_level2.evt | modeM0/AS1G08_010T02_9000002188_14818cztM0_level2_quad_clean.evt |
| Size (bytes) | 483,174,720 | 83,954,880 |
| Size | 460.8 MB | 80.1 MB |
| Events in quadrant A | 3,341,836 | 533,569 |
| Events in quadrant B | 3,704,121 | 529,133 |
| Events in quadrant C | 3,422,639 | 520,353 |
| Events in quadrant D | 3,728,075 | 510,893 |
| Mode M9 | |||
|---|---|---|---|
| Quadrant | BADHDUFLAG | Total packets | Discarded packets |
| A | 0 | 15 | 0 |
| B | 0 | 15 | 0 |
| C | 0 | 15 | 0 |
| D | 0 | 16 | 0 |
| Mode M0 | |||
|---|---|---|---|
| Quadrant | BADHDUFLAG | Total packets | Discarded packets |
| A | 0 | 13940 | 3 |
| B | 0 | 15001 | 2 |
| C | 0 | 14061 | 2 |
| D | 0 | 15302 | 2 |
| Mode SS | |||
|---|---|---|---|
| Quadrant | BADHDUFLAG | Total packets | Discarded packets |
| A | 0 | 132 | 0 |
| B | 0 | 132 | 0 |
| C | 0 | 132 | 0 |
| D | 0 | 132 | 0 |
| Quadrant | Total seconds | Saturated seconds | Saturation percentage |
|---|---|---|---|
| A | 6423 | 66 | 1.027557% |
| B | 6423 | 107 | 1.665888% |
| C | 6423 | 57 | 0.887436% |
| D | 6423 | 121 | 1.883855% |
Noise dominated data is calculated using 1-second bins in cleaned event files. If a bin has >2000 counts, and if more than 50% of those come from <1% of pixels, then it is considered to be noise-dominated and hence unusable.
| Quadrant | # 1 sec bins | Bins with >0 counts | Bins with >2000 counts | High rate bins dominated by noise | Noise dominated (total time) | Noise dominated (detector-on time) | Marked lightcurve |
|---|---|---|---|---|---|---|---|
| A | 7594 | 6425 | 2 | 2 | 0.03% | 0.03% | 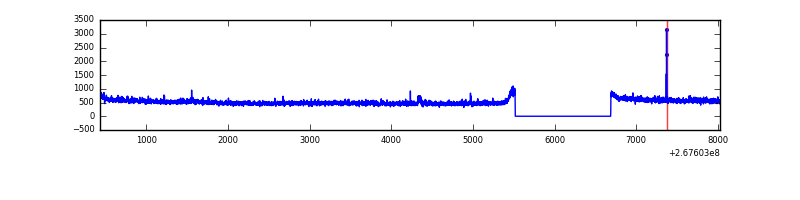 |
| B | 7594 | 6425 | 21 | 21 | 0.28% | 0.33% | 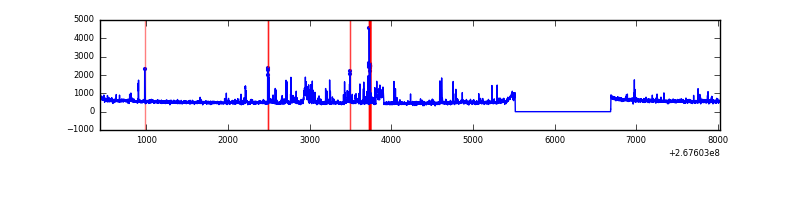 |
| C | 7594 | 6425 | 1 | 1 | 0.01% | 0.02% | 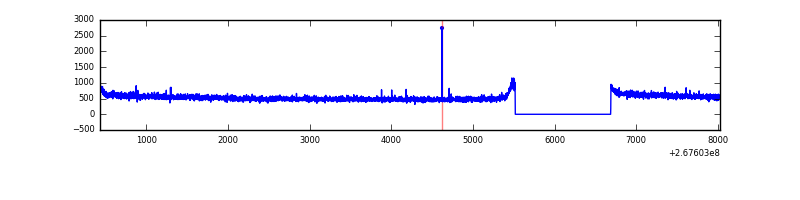 |
| D | 7594 | 6425 | 53 | 53 | 0.70% | 0.82% | 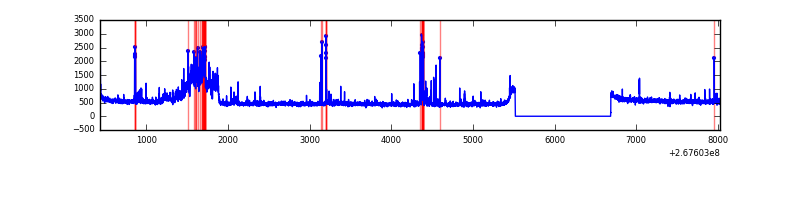 |
Top three noisy pixels from each quadrant. If the there are fewer than three noisy pixels in the level2.evt file, extra rows are filled as -1
| Pixel properties | Quadrant properties | ||||||
|---|---|---|---|---|---|---|---|
| Quadrant | DetID | PixID | Counts | Sigma | Mean | Median | Sigma |
| A | 12 | 189 | 51341 | 294.56 | 851 | 834 | 171.5 |
| A | 9 | 143 | 10532 | 56.56 | 851 | 834 | 171.5 |
| A | 0 | 226 | 7729 | 40.21 | 851 | 834 | 171.5 |
| B | 3 | 64 | 176920 | 1114.8 | 837 | 816 | 158.0 |
| B | 0 | 189 | 99253 | 623.14 | 837 | 816 | 158.0 |
| B | 0 | 229 | 41518 | 257.66 | 837 | 816 | 158.0 |
| C | 3 | 233 | 242064 | 1291.73 | 814 | 821 | 186.8 |
| C | 13 | 61 | 5996 | 27.71 | 814 | 821 | 186.8 |
| C | 14 | 234 | 4842 | 21.53 | 814 | 821 | 186.8 |
| D | 13 | 104 | 333051 | 1713.43 | 816 | 798 | 193.9 |
| D | 7 | 254 | 162552 | 834.16 | 816 | 798 | 193.9 |
| D | 10 | 70 | 111678 | 571.81 | 816 | 798 | 193.9 |
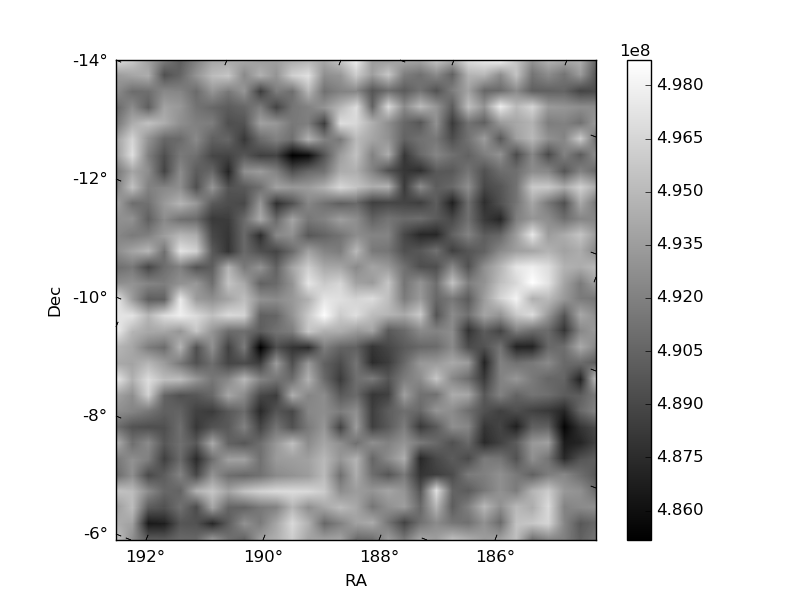
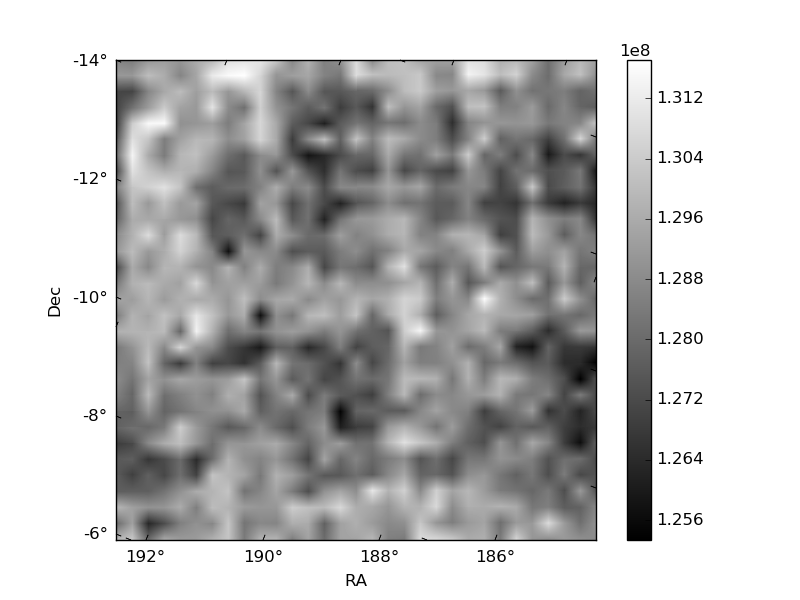
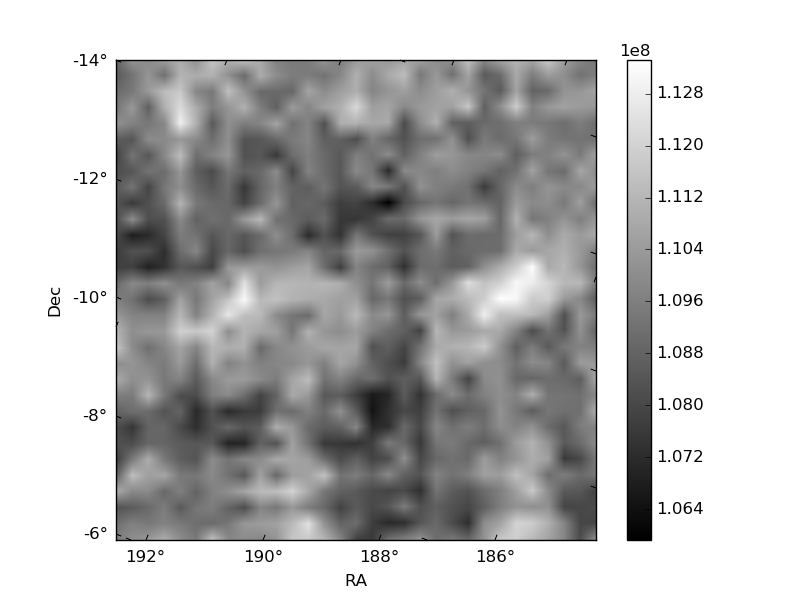
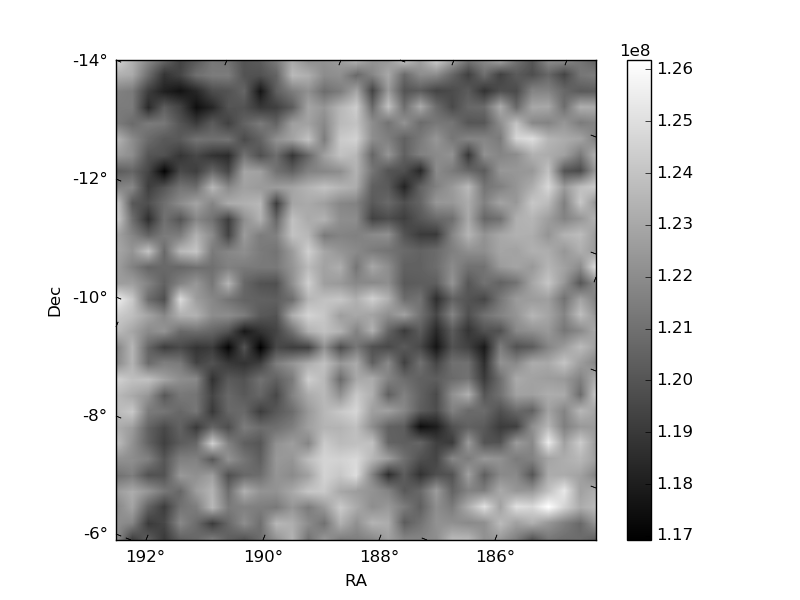
Histogram calculated using DETX and DETY for each event in the final _common_clean file
| Quadrant A | 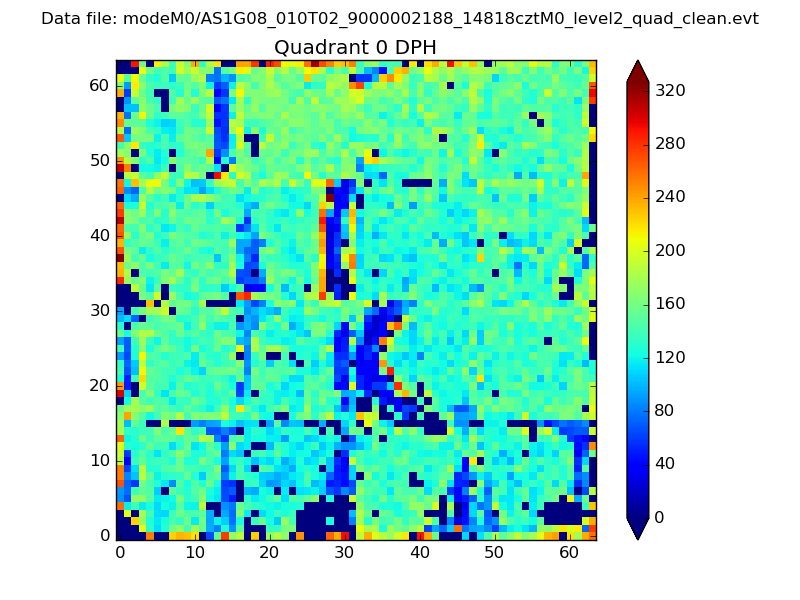 |
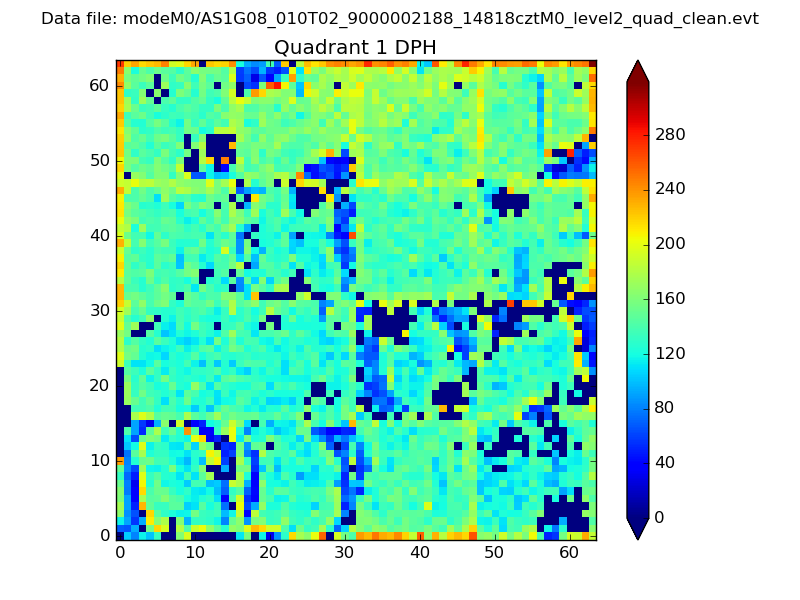 |
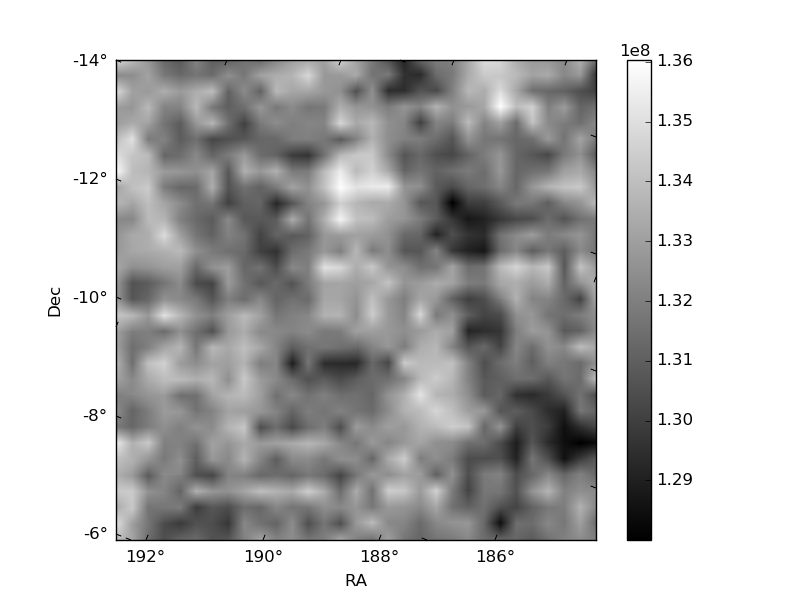
Quadrant B |
|---|---|---|---|
| Quadrant D | 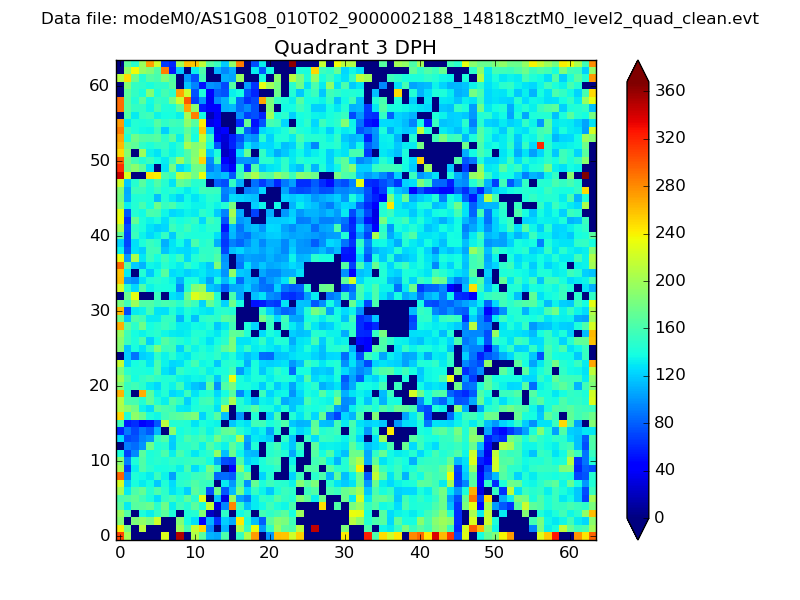 |
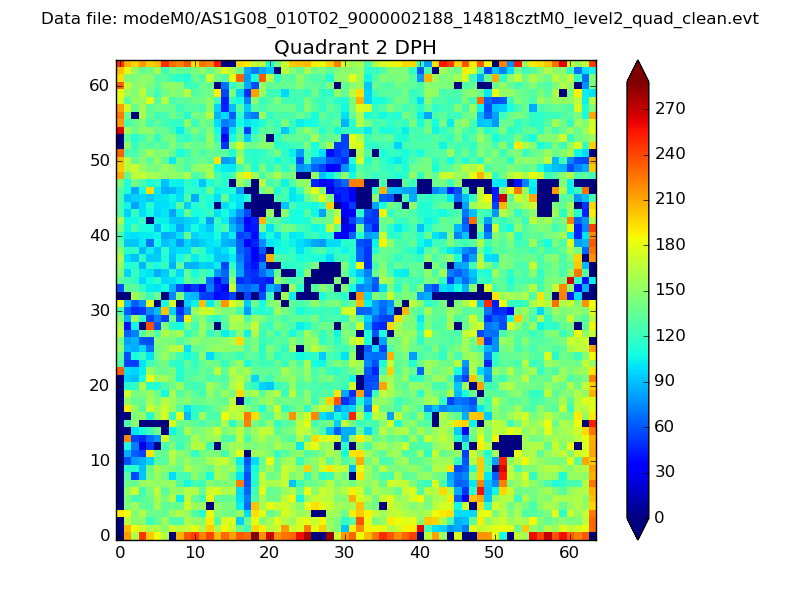 |
Quadrant C |
| Plot type | Count rate plots | Images |
|---|---|---|
| Comparison with Poisson distribution Blue bars denote a histogram of data divided into 1 sec bins. Red curve is a Poisson curve with rate = median count rate of data. |
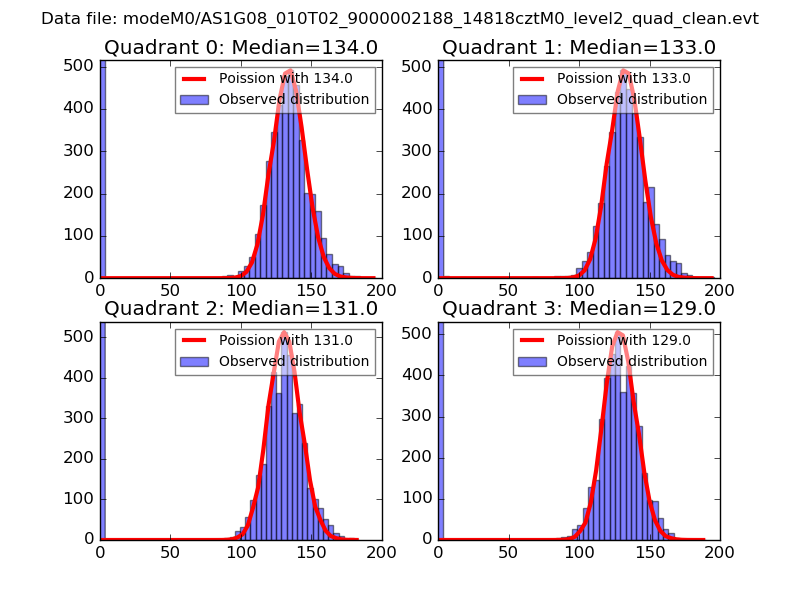 |
 |
| Quadrant-wise count rates Data is divided into 100 sec bins |
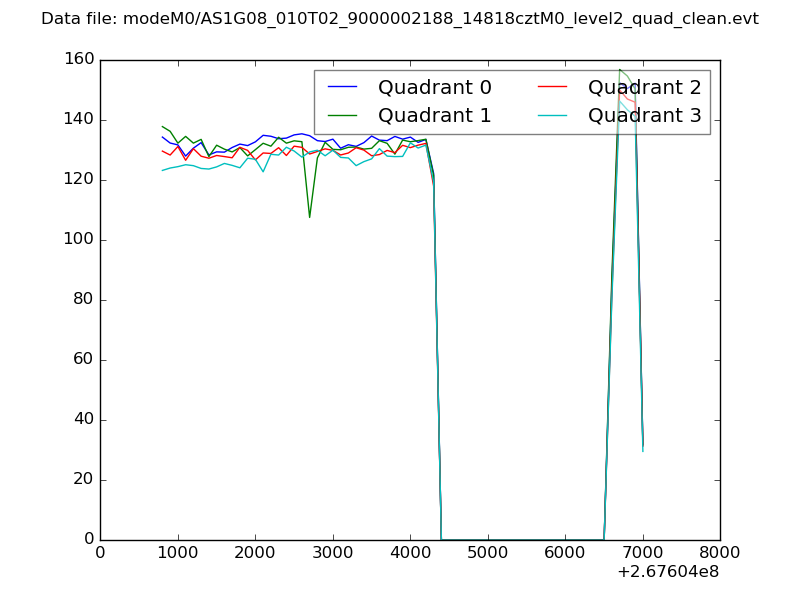 |
|
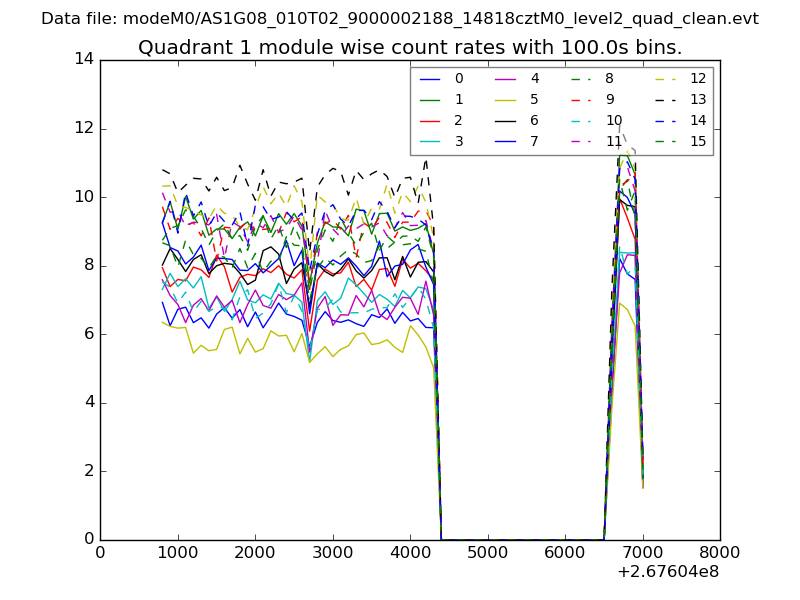
| Module-wise count rates for Quadrant A Data is divided into 100 sec bins |
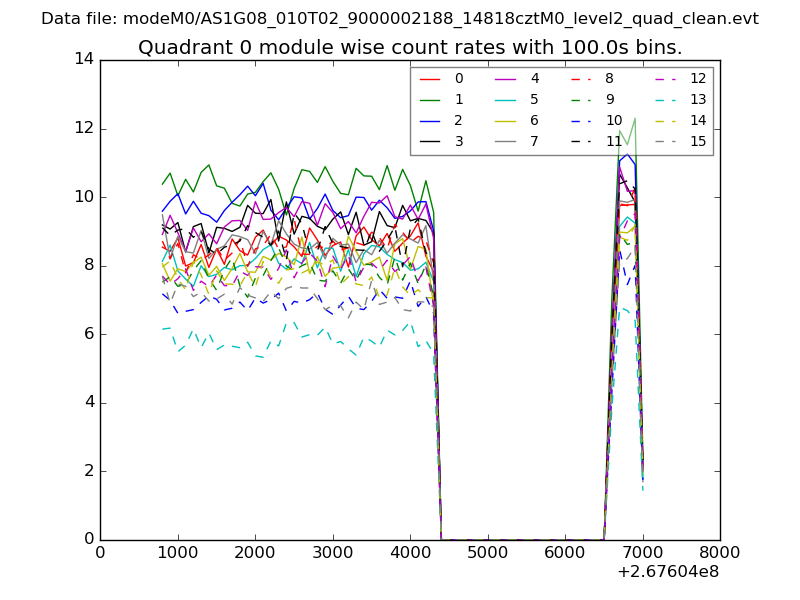 |
 |
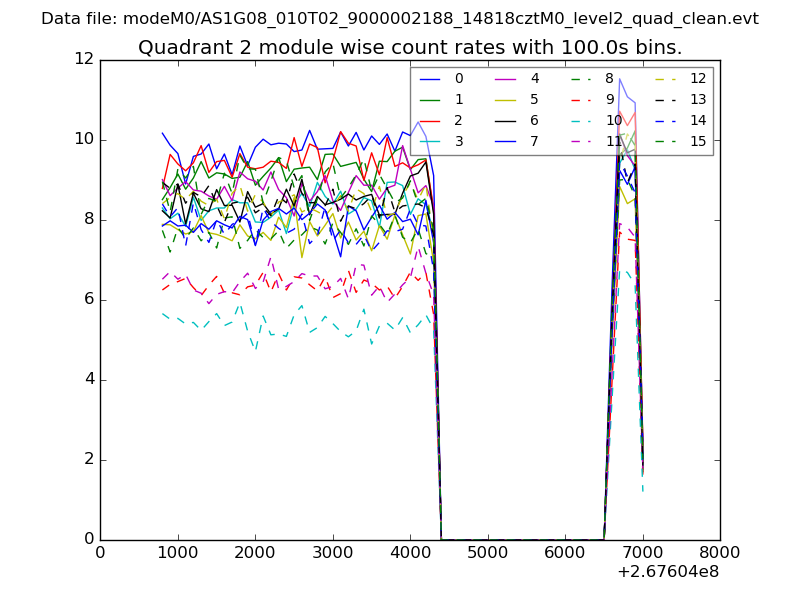
| Module-wise count rates for Quadrant B Data is divided into 100 sec bins |
 |
 |
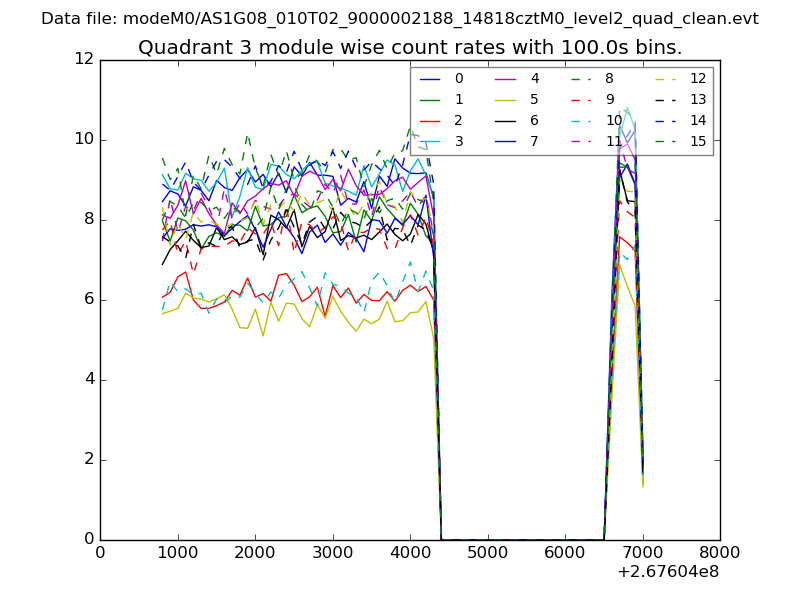
| Module-wise count rates for Quadrant C Data is divided into 100 sec bins |
 |
 |
| Module-wise count rates for Quadrant D Data is divided into 100 sec bins |
 |
 |
| Parameter | Plot |
|---|---|
| CZT HV Monitor | 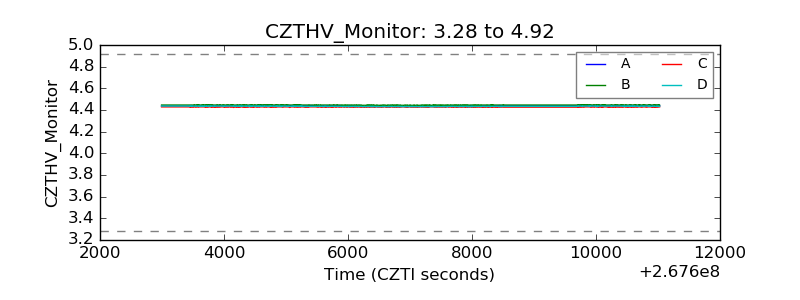 |
| D_VDD | 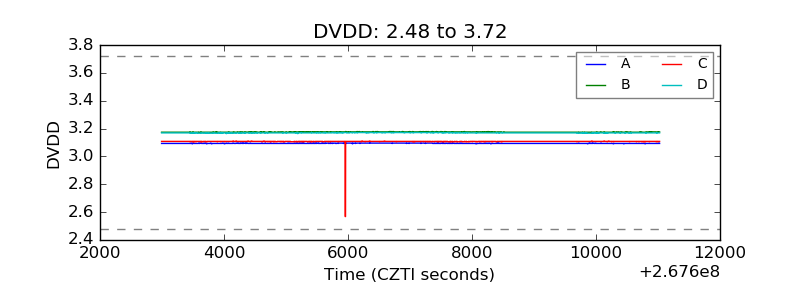 |
| Temperature 1 | 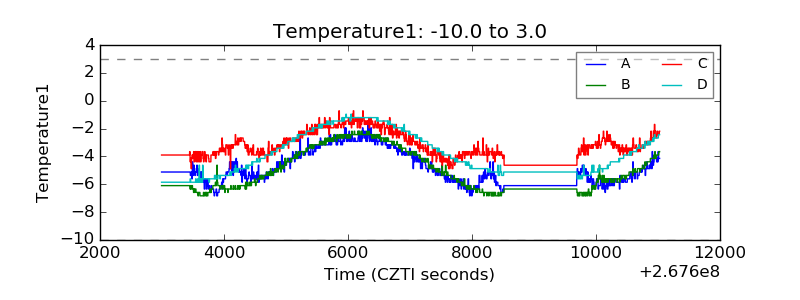 |
| Veto HV Monitor | 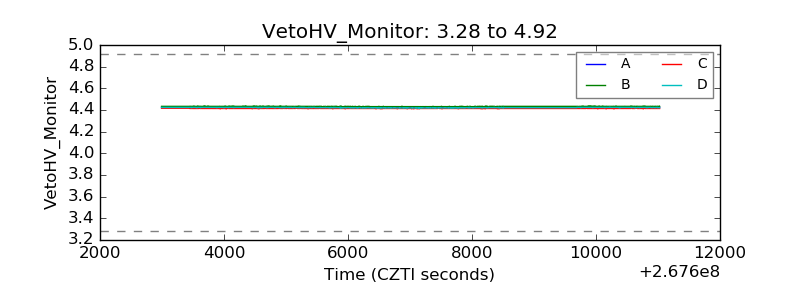 |
| Veto LLD | 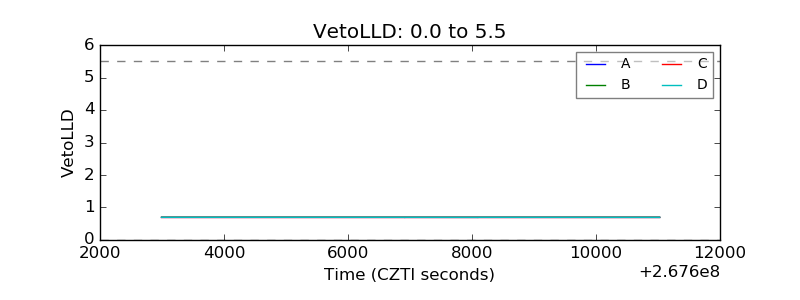 |
| Alpha Counter | 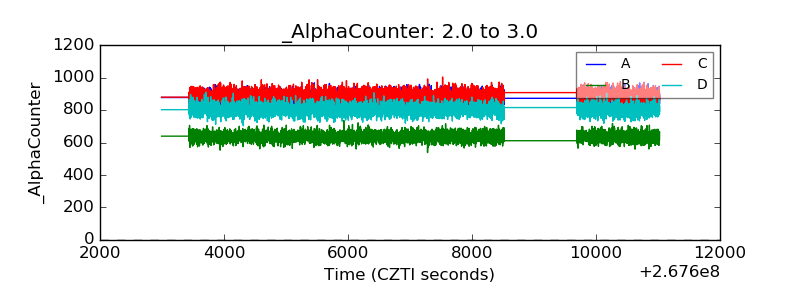 |
| _CPM_Rate | 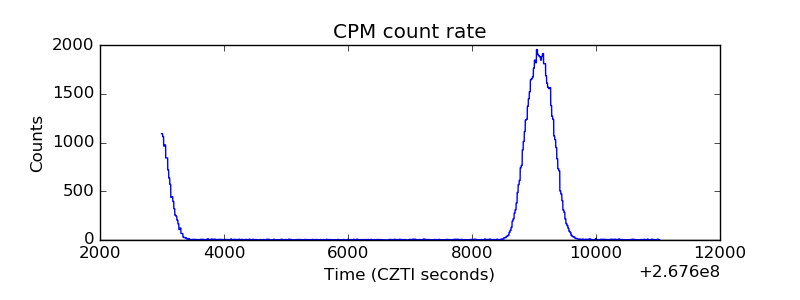 |
| CZT Counter | 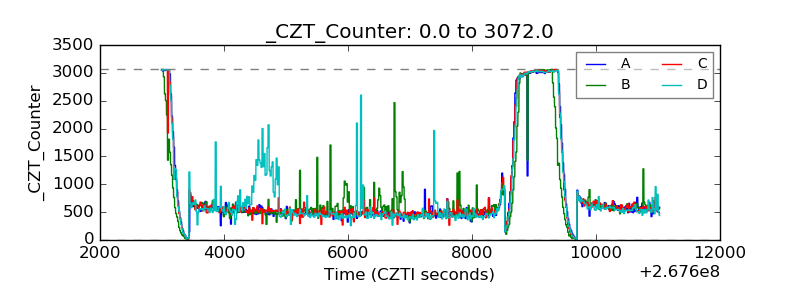 |
| +2.5 Volts monitor |  |
| +5 Volts monitor |  |
| _ROLL_ROT | 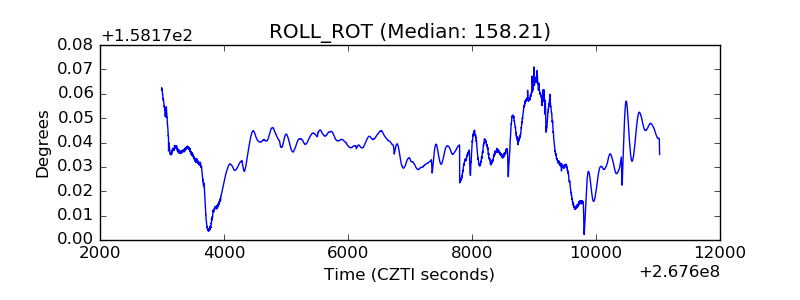 |
| _Roll_DEC | 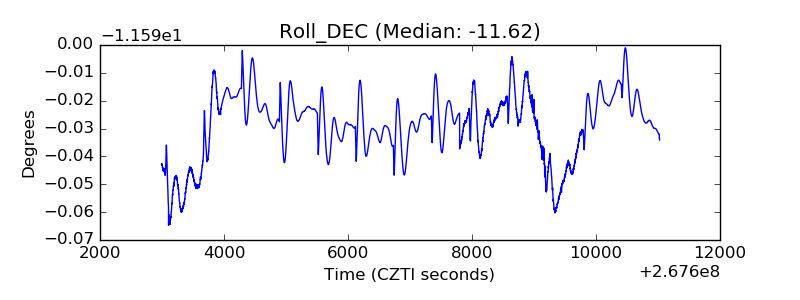 |
| _Roll_RA | 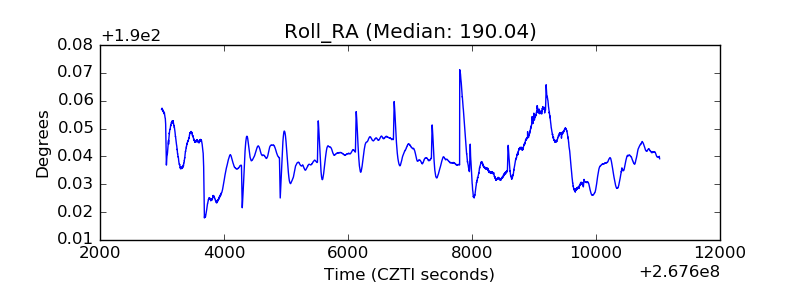 |
| Veto Counter | 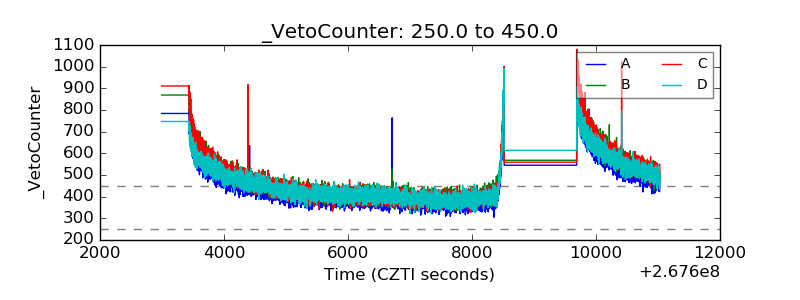 |