| Param | Original file | Final file |
|---|---|---|
| Filename | modeM0/AS1G08_010T02_9000002188_14822cztM0_level2.evt | modeM0/AS1G08_010T02_9000002188_14822cztM0_level2_quad_clean.evt |
| Size (bytes) | 463,547,520 | 109,941,120 |
| Size | 442.1 MB | 104.8 MB |
| Events in quadrant A | 3,345,666 | 749,557 |
| Events in quadrant B | 3,595,273 | 734,623 |
| Events in quadrant C | 3,292,247 | 718,500 |
| Events in quadrant D | 3,395,142 | 705,143 |
| Mode M9 | |||
|---|---|---|---|
| Quadrant | BADHDUFLAG | Total packets | Discarded packets |
| A | 0 | 13 | 0 |
| B | 0 | 13 | 0 |
| C | 0 | 13 | 0 |
| D | 0 | 13 | 0 |
| Mode M0 | |||
|---|---|---|---|
| Quadrant | BADHDUFLAG | Total packets | Discarded packets |
| A | 0 | 13681 | 2 |
| B | 0 | 14569 | 1 |
| C | 0 | 13501 | 1 |
| D | 0 | 14065 | 1 |
| Mode SS | |||
|---|---|---|---|
| Quadrant | BADHDUFLAG | Total packets | Discarded packets |
| A | 0 | 122 | 0 |
| B | 0 | 122 | 0 |
| C | 0 | 122 | 0 |
| D | 0 | 122 | 0 |
| Quadrant | Total seconds | Saturated seconds | Saturation percentage |
|---|---|---|---|
| A | 6047 | 88 | 1.455267% |
| B | 6047 | 144 | 2.381346% |
| C | 6047 | 74 | 1.223747% |
| D | 6047 | 128 | 2.116752% |
Noise dominated data is calculated using 1-second bins in cleaned event files. If a bin has >2000 counts, and if more than 50% of those come from <1% of pixels, then it is considered to be noise-dominated and hence unusable.
| Quadrant | # 1 sec bins | Bins with >0 counts | Bins with >2000 counts | High rate bins dominated by noise | Noise dominated (total time) | Noise dominated (detector-on time) | Marked lightcurve |
|---|---|---|---|---|---|---|---|
| A | 7373 | 6049 | 1 | 1 | 0.01% | 0.02% | 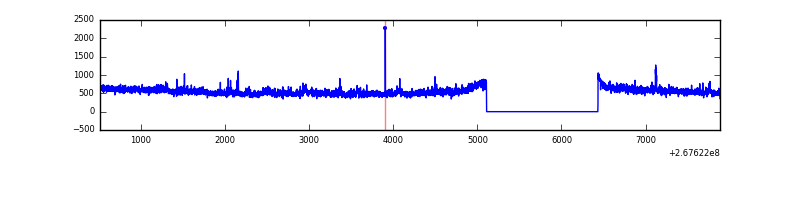 |
| B | 7373 | 6049 | 35 | 35 | 0.47% | 0.58% | 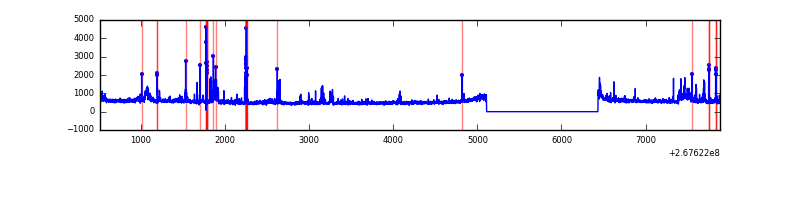 |
| C | 7373 | 6049 | 0 | 0 | 0.00% | 0.00% | 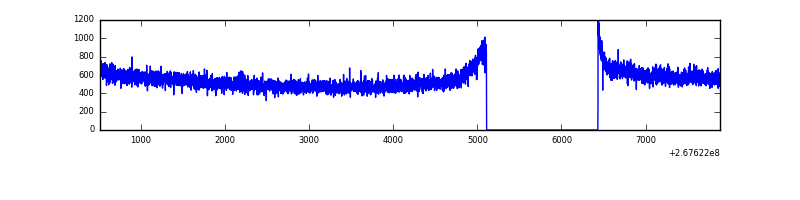 |
| D | 7373 | 6049 | 44 | 44 | 0.60% | 0.73% | 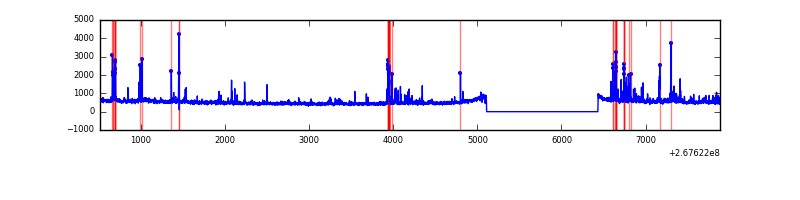 |
Top three noisy pixels from each quadrant. If the there are fewer than three noisy pixels in the level2.evt file, extra rows are filled as -1
| Pixel properties | Quadrant properties | ||||||
|---|---|---|---|---|---|---|---|
| Quadrant | DetID | PixID | Counts | Sigma | Mean | Median | Sigma |
| A | 12 | 189 | 178302 | 1075.35 | 820 | 806 | 165.1 |
| A | 1 | 162 | 8035 | 43.8 | 820 | 806 | 165.1 |
| A | 0 | 226 | 7491 | 40.5 | 820 | 806 | 165.1 |
| B | 3 | 64 | 174495 | 1160.01 | 797 | 779 | 149.8 |
| B | 0 | 229 | 69551 | 459.23 | 797 | 779 | 149.8 |
| B | 0 | 228 | 59848 | 394.44 | 797 | 779 | 149.8 |
| C | 3 | 233 | 271280 | 1524.66 | 775 | 783 | 177.4 |
| C | 13 | 61 | 5538 | 26.8 | 775 | 783 | 177.4 |
| C | 3 | 202 | 1932 | 6.48 | 775 | 783 | 177.4 |
| D | 7 | 254 | 157450 | 758.54 | 784 | 768 | 206.6 |
| D | 10 | 70 | 126082 | 606.68 | 784 | 768 | 206.6 |
| D | 13 | 249 | 101266 | 486.54 | 784 | 768 | 206.6 |
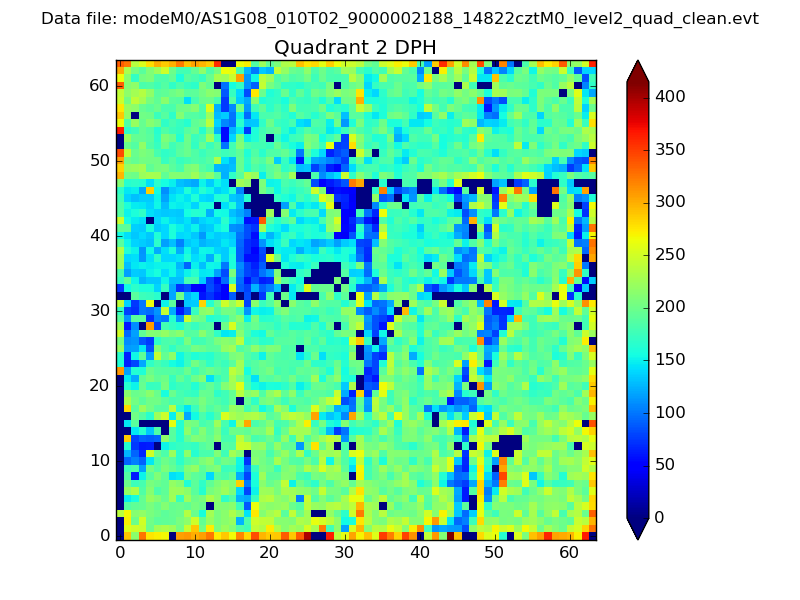
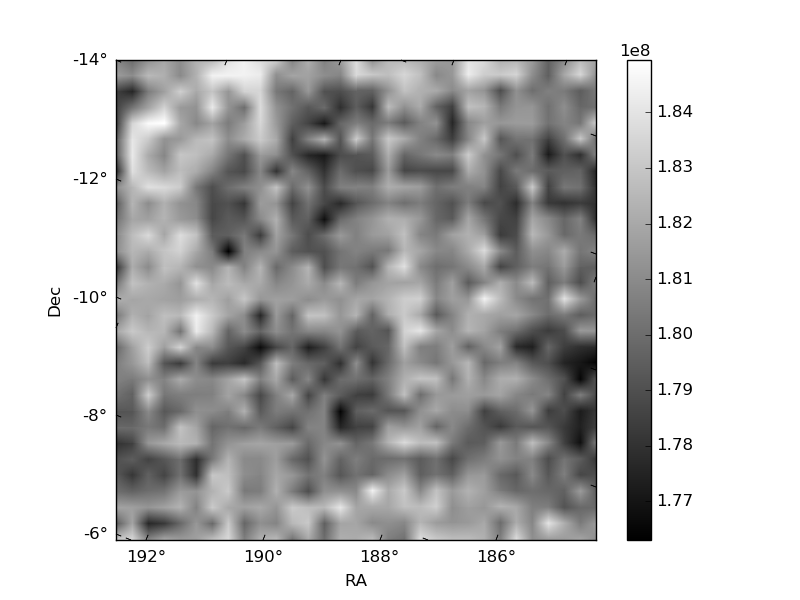
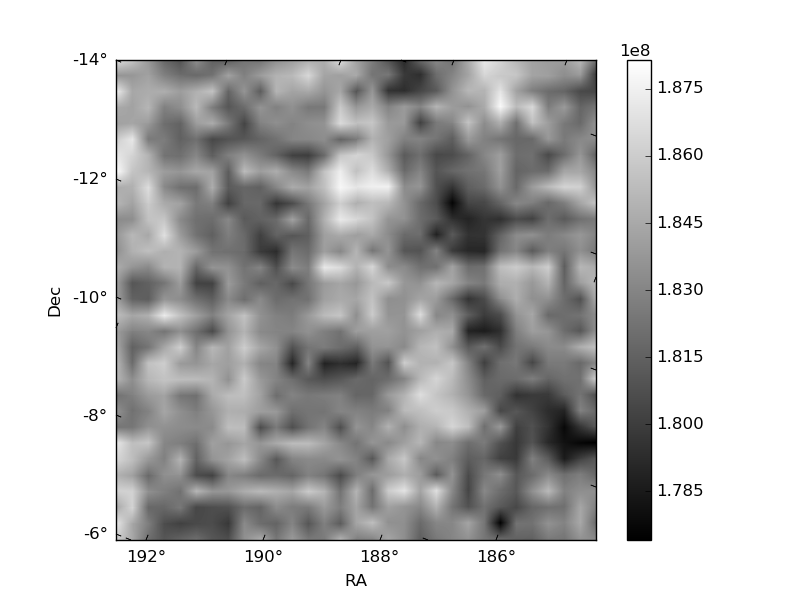
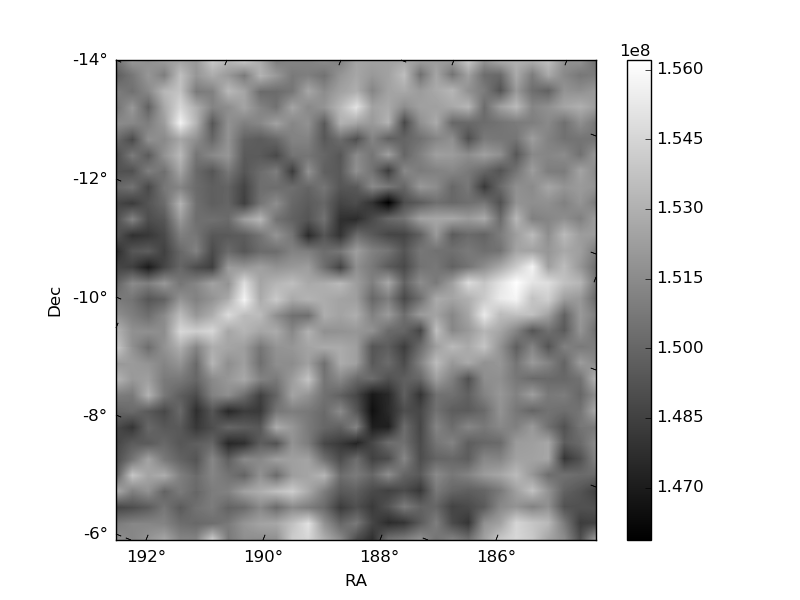
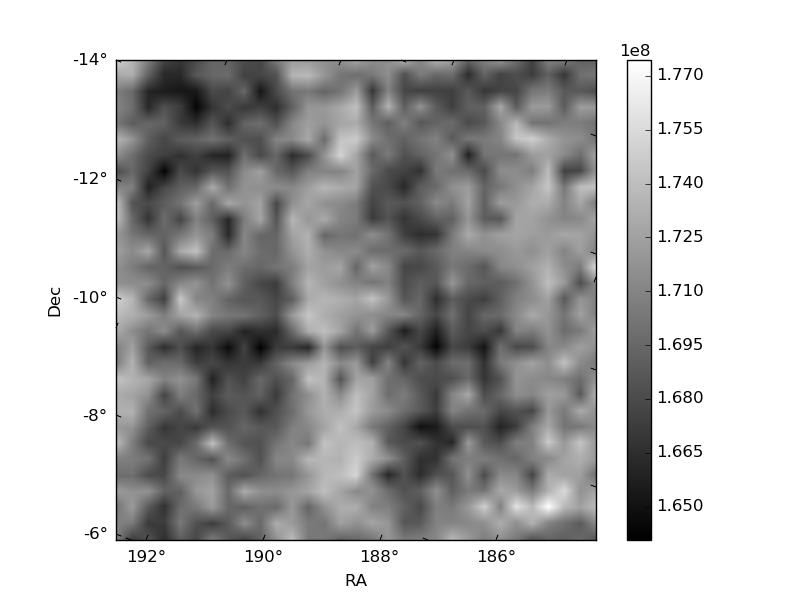
Histogram calculated using DETX and DETY for each event in the final _common_clean file
| Quadrant A | 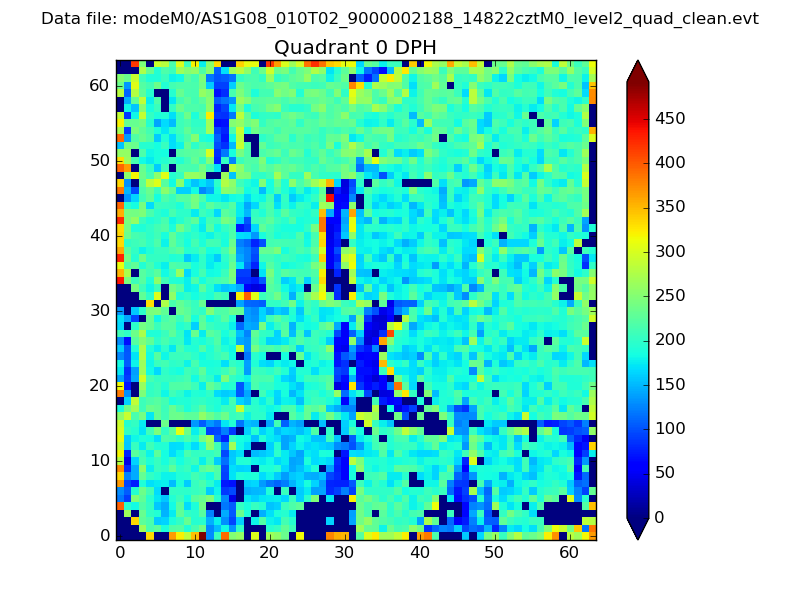 |
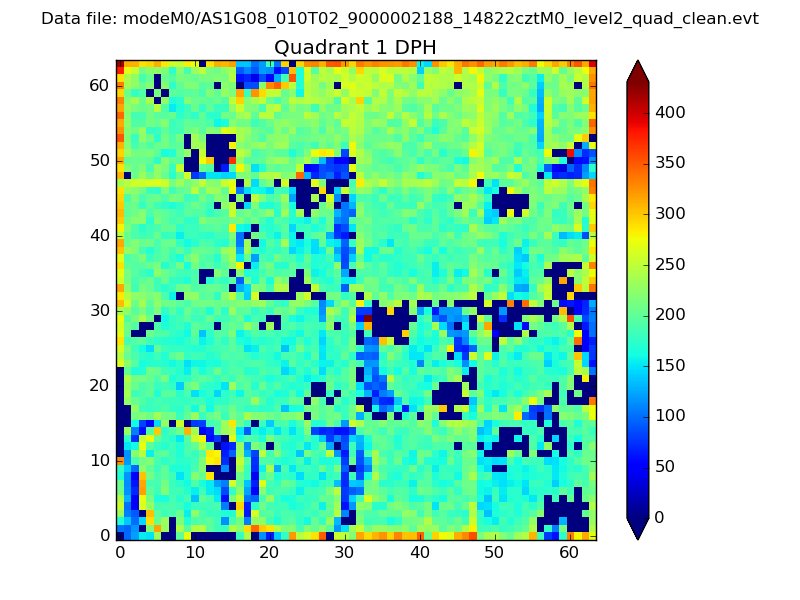 |
Quadrant B |
|---|---|---|---|
| Quadrant D | 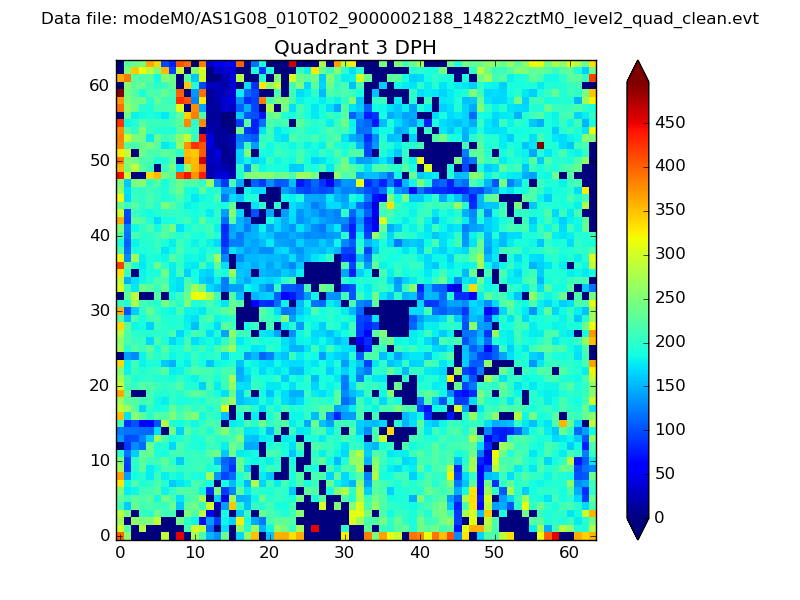 |
 |
Quadrant C |
| Plot type | Count rate plots | Images |
|---|---|---|
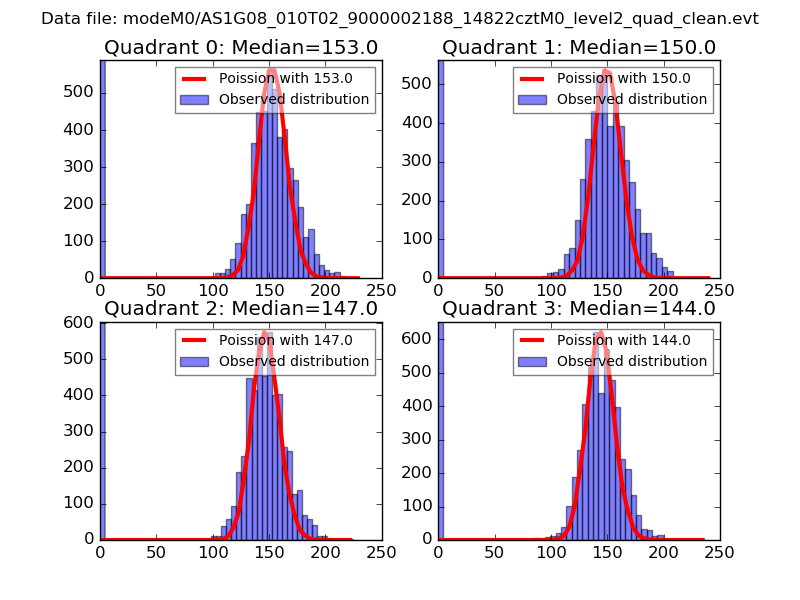
| Comparison with Poisson distribution Blue bars denote a histogram of data divided into 1 sec bins. Red curve is a Poisson curve with rate = median count rate of data. |
 |
 |
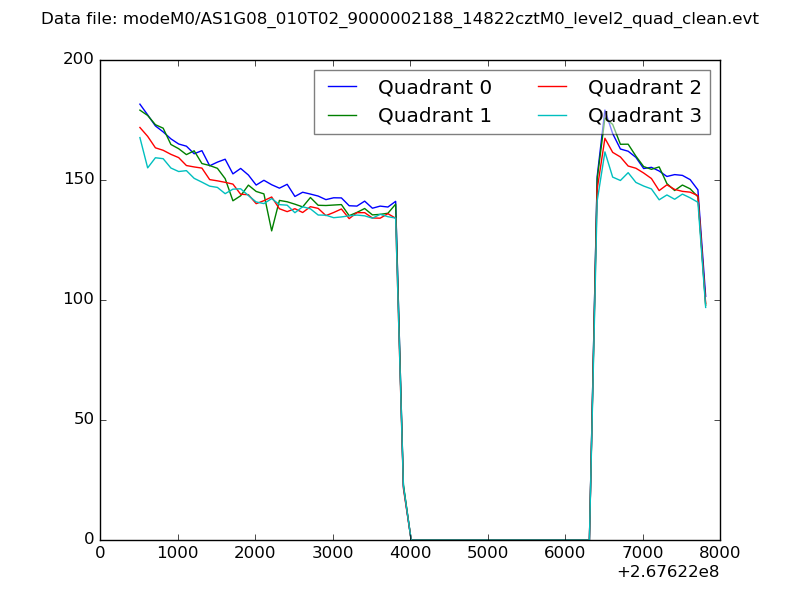
| Quadrant-wise count rates Data is divided into 100 sec bins |
 |
|
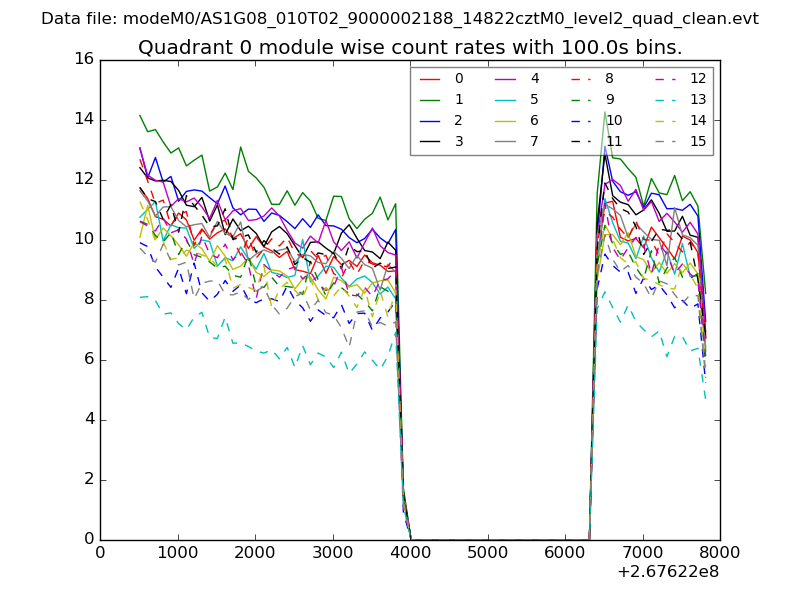
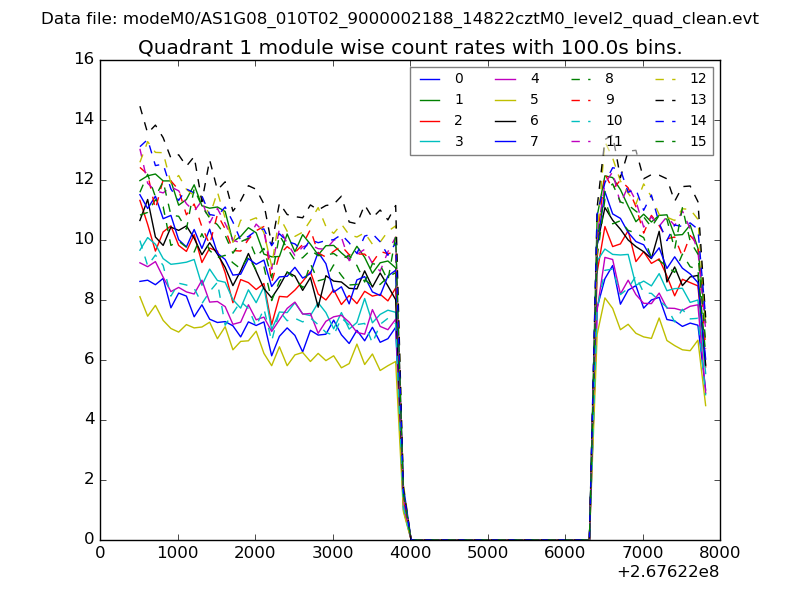
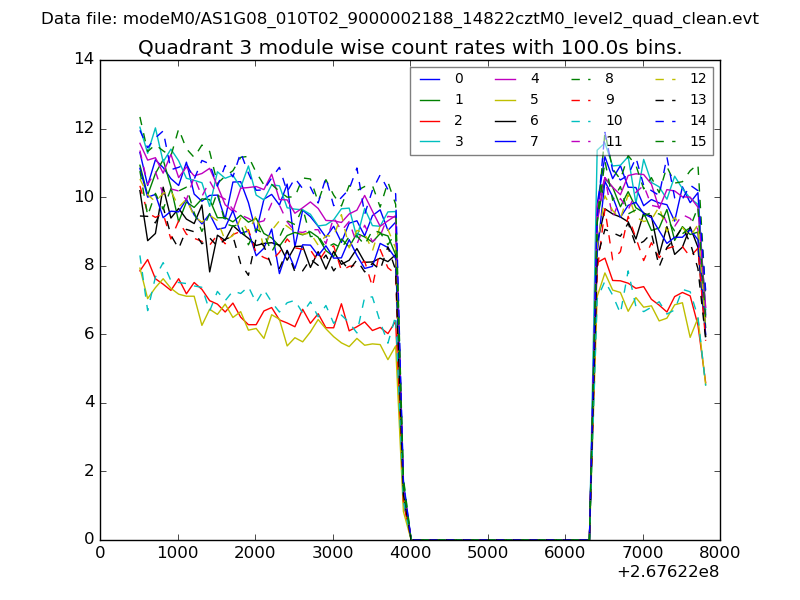
| Module-wise count rates for Quadrant A Data is divided into 100 sec bins |
 |
 |
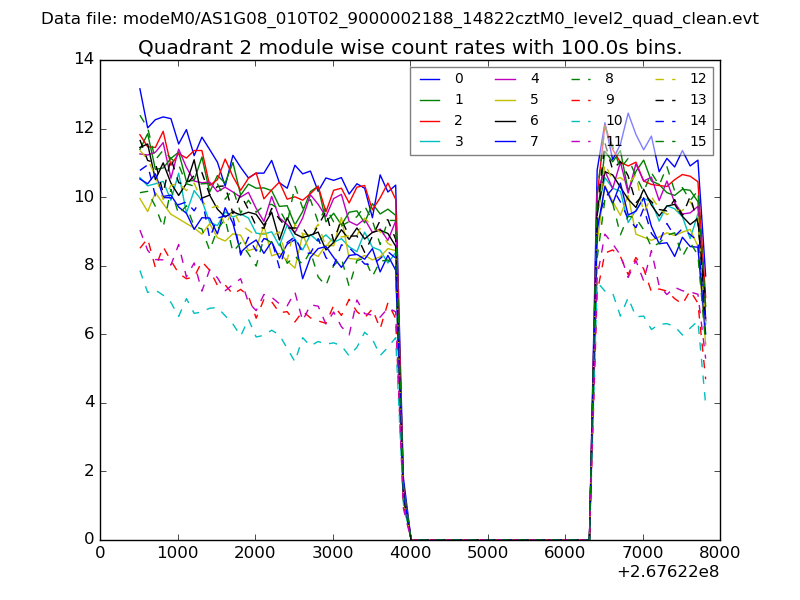
| Module-wise count rates for Quadrant B Data is divided into 100 sec bins |
 |
 |
| Module-wise count rates for Quadrant C Data is divided into 100 sec bins |
 |
 |
| Module-wise count rates for Quadrant D Data is divided into 100 sec bins |
 |
 |
| Parameter | Plot |
|---|---|
| CZT HV Monitor | 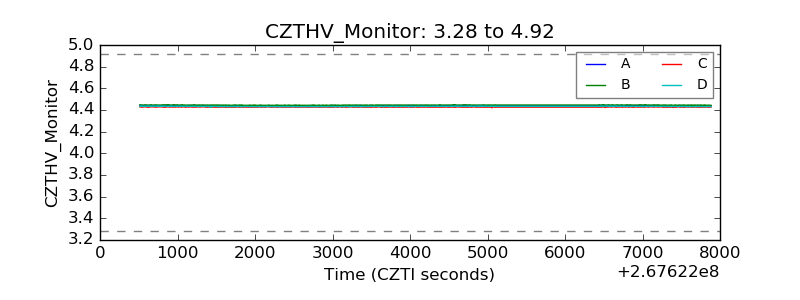 |
| D_VDD | 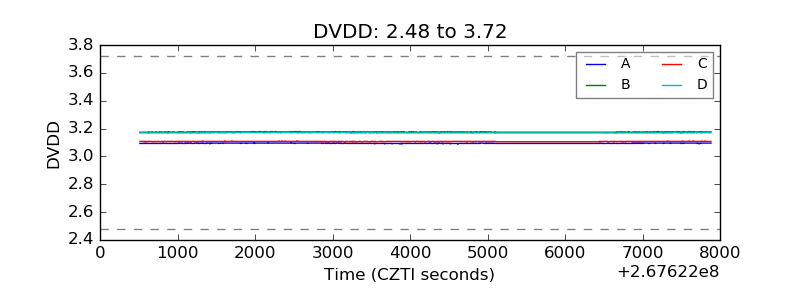 |
| Temperature 1 |  |
| Veto HV Monitor | 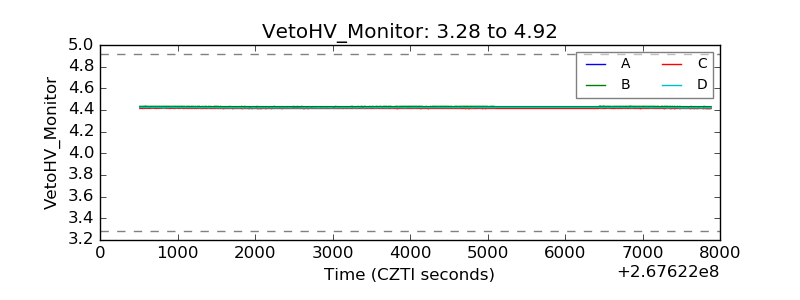 |
| Veto LLD |  |
| Alpha Counter | 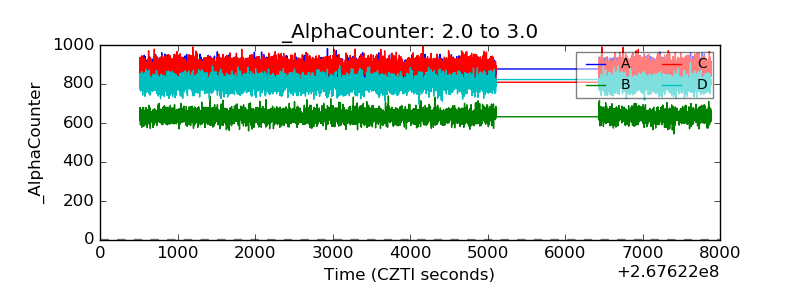 |
| _CPM_Rate | 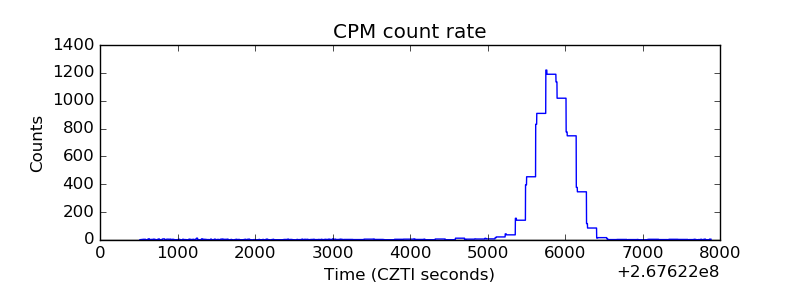 |
| CZT Counter | 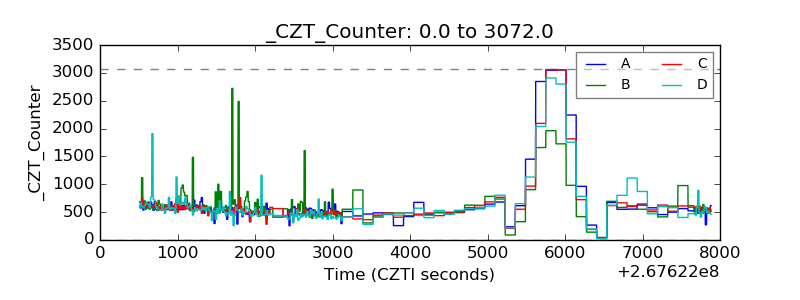 |
| +2.5 Volts monitor |  |
| +5 Volts monitor |  |
| _ROLL_ROT |  |
| _Roll_DEC |  |
| _Roll_RA | 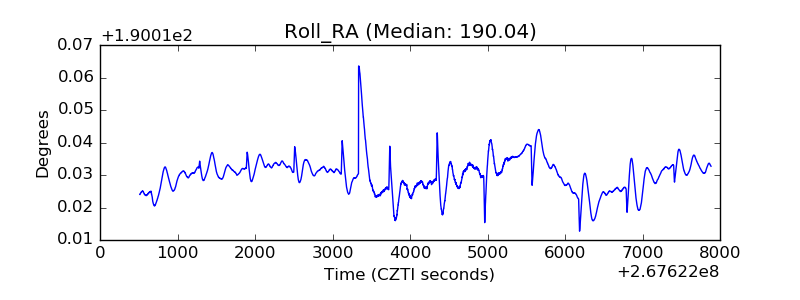 |
| Veto Counter | 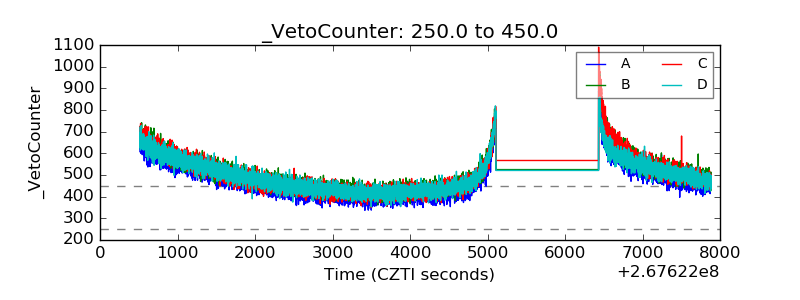 |