| Param | Original file | Final file |
|---|---|---|
| Filename | modeM0/AS1G08_010T02_9000002188_14826cztM0_level2.evt | modeM0/AS1G08_010T02_9000002188_14826cztM0_level2_quad_clean.evt |
| Size (bytes) | 944,343,360 | 122,192,640 |
| Size | 900.6 MB | 116.5 MB |
| Events in quadrant A | 6,767,678 | 707,316 |
| Events in quadrant B | 7,074,713 | 697,567 |
| Events in quadrant C | 6,824,802 | 691,248 |
| Events in quadrant D | 7,019,756 | 672,503 |
| Mode M9 | |||
|---|---|---|---|
| Quadrant | BADHDUFLAG | Total packets | Discarded packets |
| A | 0 | 6 | 0 |
| B | 0 | 6 | 0 |
| C | 0 | 6 | 0 |
| D | 0 | 6 | 0 |
| Mode M0 | |||
|---|---|---|---|
| Quadrant | BADHDUFLAG | Total packets | Discarded packets |
| A | 0 | 28804 | 4 |
| B | 0 | 29691 | 3 |
| C | 0 | 28767 | 3 |
| D | 0 | 30229 | 3 |
| Mode SS | |||
|---|---|---|---|
| Quadrant | BADHDUFLAG | Total packets | Discarded packets |
| A | 0 | 274 | 0 |
| B | 0 | 274 | 0 |
| C | 0 | 274 | 0 |
| D | 0 | 274 | 0 |
| Quadrant | Total seconds | Saturated seconds | Saturation percentage |
|---|---|---|---|
| A | 13482 | 175 | 1.298027% |
| B | 13482 | 326 | 2.418039% |
| C | 13482 | 142 | 1.053256% |
| D | 13483 | 246 | 1.824520% |
Noise dominated data is calculated using 1-second bins in cleaned event files. If a bin has >2000 counts, and if more than 50% of those come from <1% of pixels, then it is considered to be noise-dominated and hence unusable.
| Quadrant | # 1 sec bins | Bins with >0 counts | Bins with >2000 counts | High rate bins dominated by noise | Noise dominated (total time) | Noise dominated (detector-on time) | Marked lightcurve |
|---|---|---|---|---|---|---|---|
| A | 14013 | 13485 | 0 | 0 | 0.00% | 0.00% | 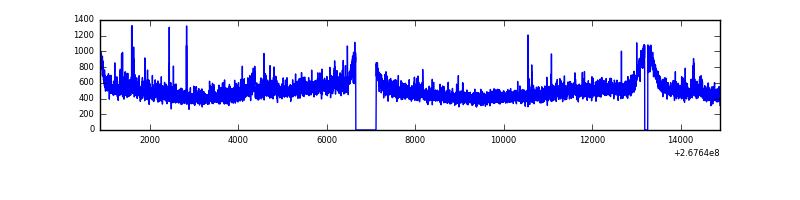 |
| B | 14013 | 13485 | 57 | 57 | 0.41% | 0.42% | 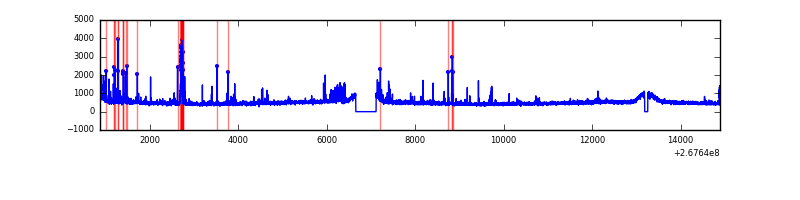 |
| C | 14013 | 13485 | 0 | 0 | 0.00% | 0.00% | 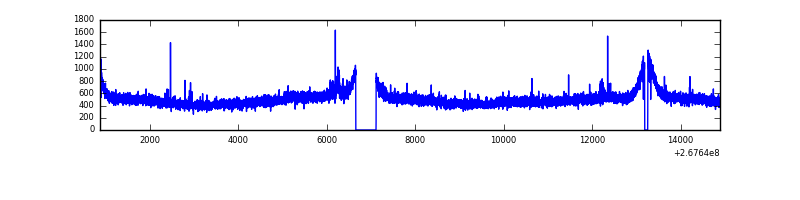 |
| D | 14014 | 13486 | 100 | 100 | 0.71% | 0.74% | 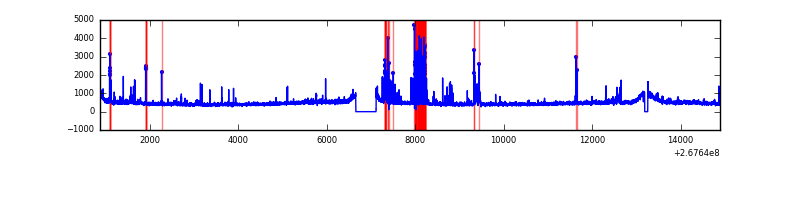 |
Top three noisy pixels from each quadrant. If the there are fewer than three noisy pixels in the level2.evt file, extra rows are filled as -1
| Pixel properties | Quadrant properties | ||||||
|---|---|---|---|---|---|---|---|
| Quadrant | DetID | PixID | Counts | Sigma | Mean | Median | Sigma |
| A | 12 | 189 | 274075 | 797.87 | 1682 | 1646 | 341.4 |
| A | 0 | 226 | 14836 | 38.63 | 1682 | 1646 | 341.4 |
| A | 9 | 143 | 14033 | 36.28 | 1682 | 1646 | 341.4 |
| B | 3 | 64 | 216882 | 675.19 | 1660 | 1620 | 318.8 |
| B | 0 | 189 | 109951 | 339.79 | 1660 | 1620 | 318.8 |
| B | 0 | 229 | 38941 | 117.06 | 1660 | 1620 | 318.8 |
| C | 3 | 233 | 492043 | 1298.94 | 1614 | 1623 | 377.6 |
| C | 8 | 128 | 14526 | 34.18 | 1614 | 1623 | 377.6 |
| C | 6 | 96 | 14097 | 33.04 | 1614 | 1623 | 377.6 |
| D | 7 | 254 | 623415 | 1447.34 | 1604 | 1569 | 429.6 |
| D | 10 | 70 | 79397 | 181.14 | 1604 | 1569 | 429.6 |
| D | 12 | 110 | 77927 | 177.72 | 1604 | 1569 | 429.6 |
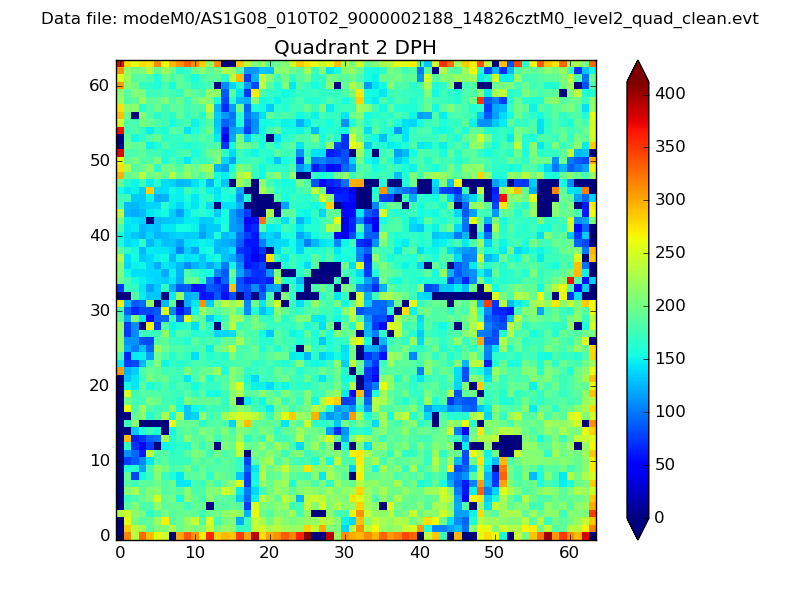
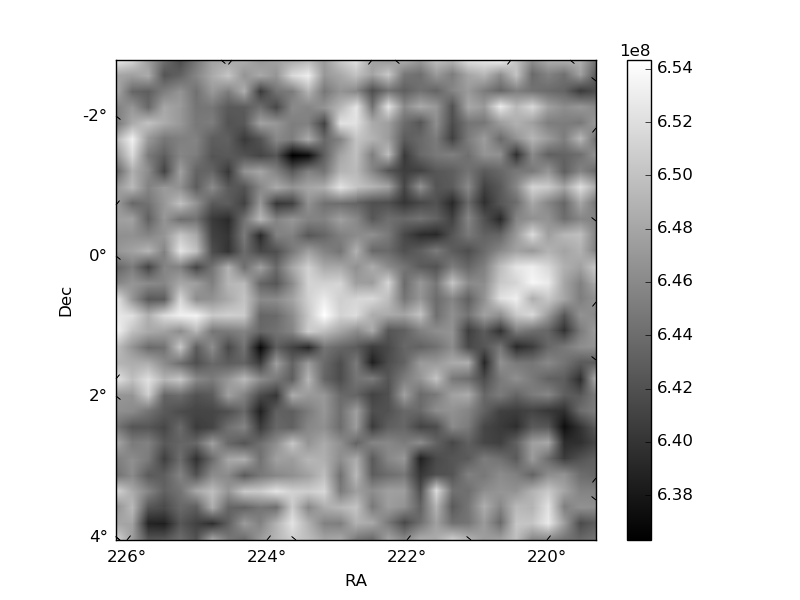
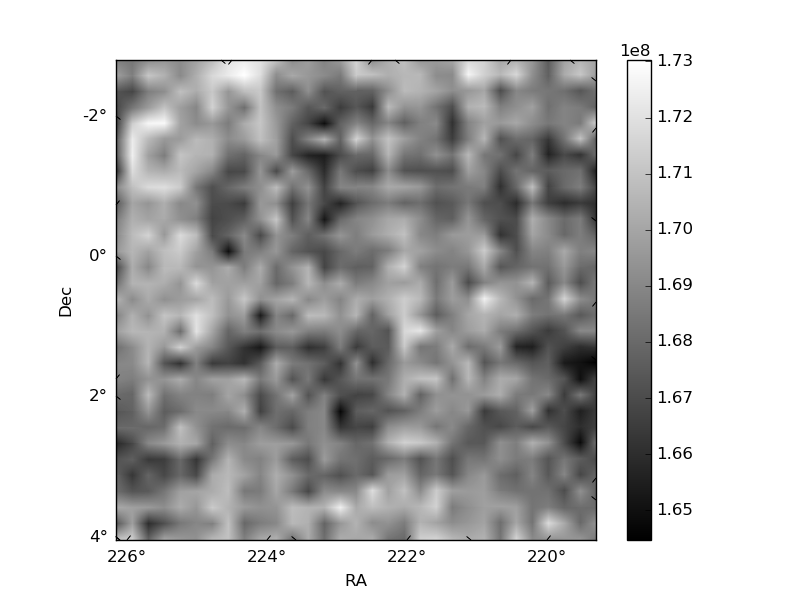
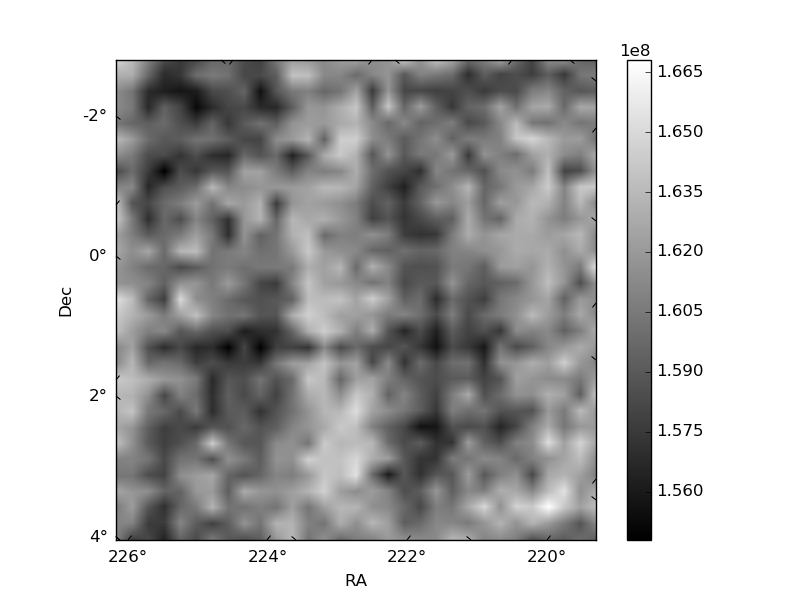
Histogram calculated using DETX and DETY for each event in the final _common_clean file
| Quadrant A | 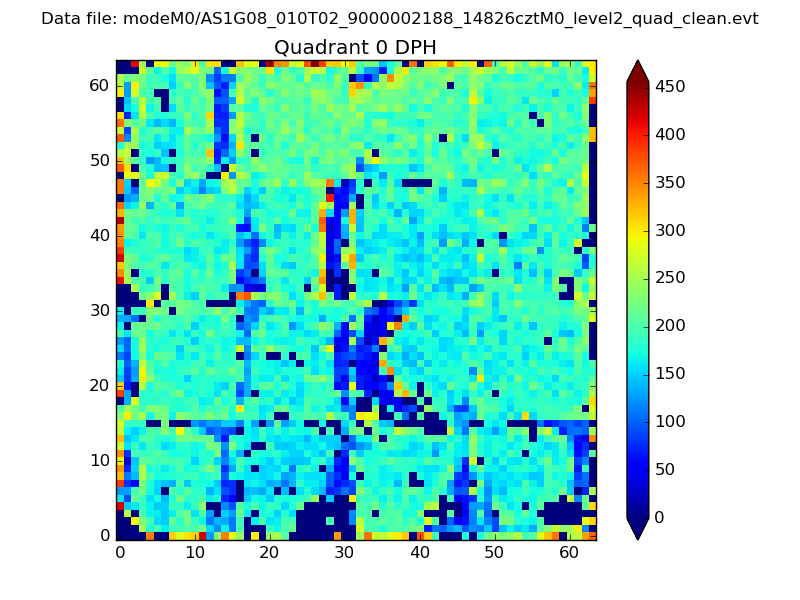 |
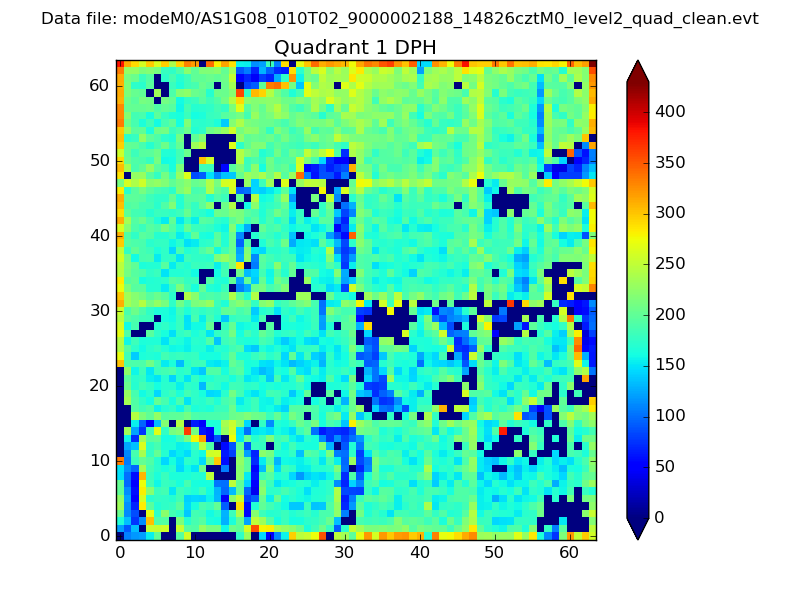 |
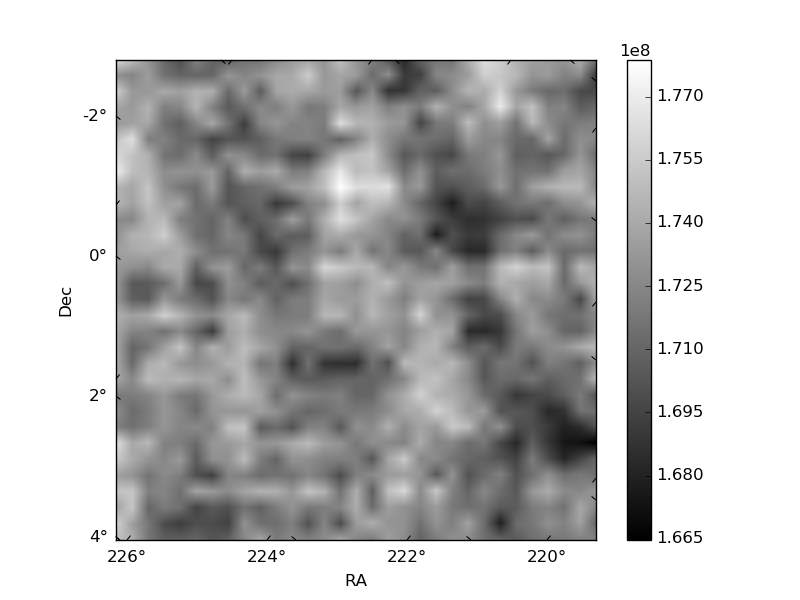
Quadrant B |
|---|---|---|---|
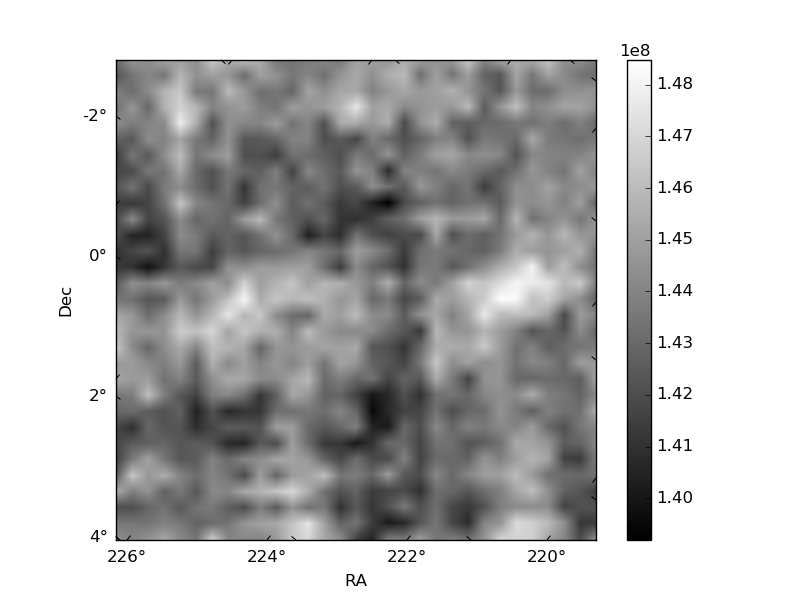
| Quadrant D | 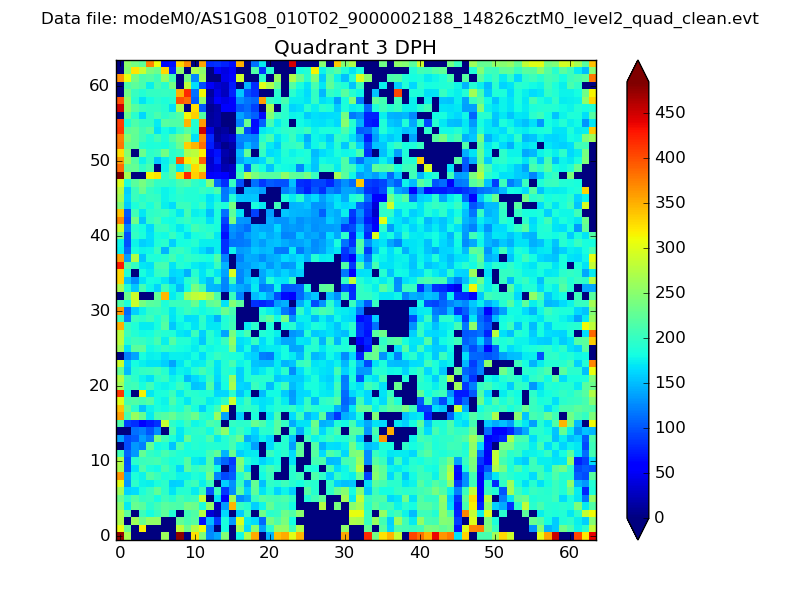 |
 |
Quadrant C |
| Plot type | Count rate plots | Images |
|---|---|---|
| Comparison with Poisson distribution Blue bars denote a histogram of data divided into 1 sec bins. Red curve is a Poisson curve with rate = median count rate of data. |
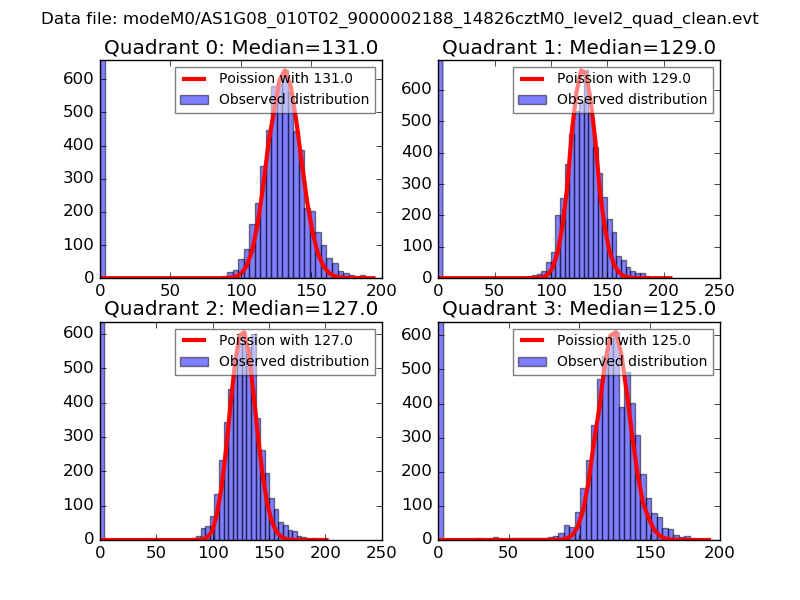 |
 |
| Quadrant-wise count rates Data is divided into 100 sec bins |
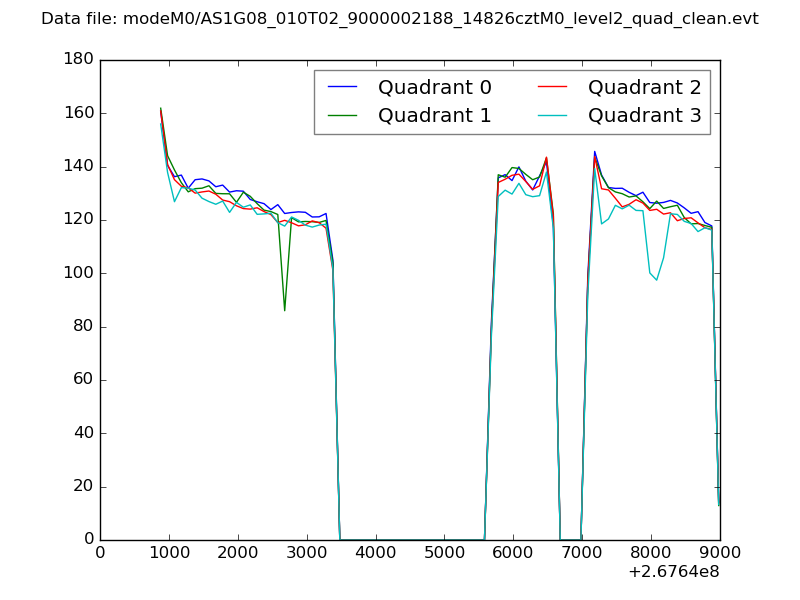 |
|
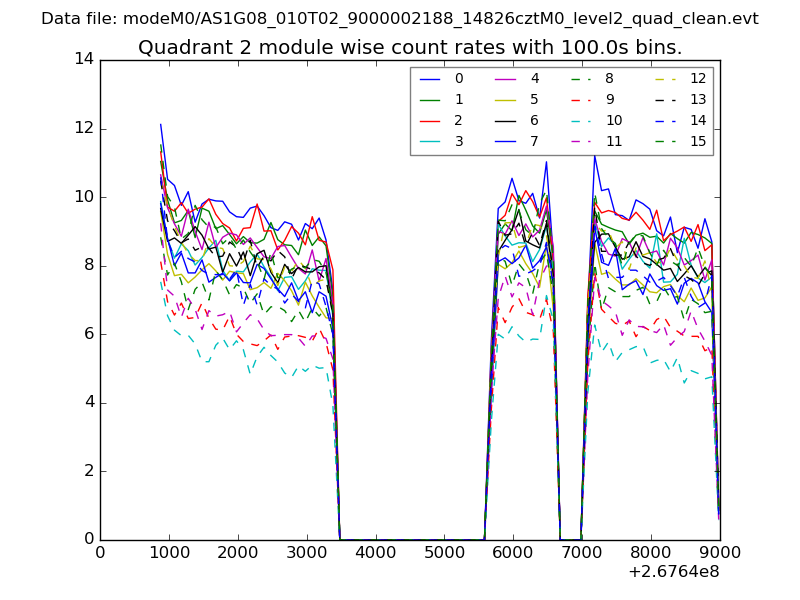
| Module-wise count rates for Quadrant A Data is divided into 100 sec bins |
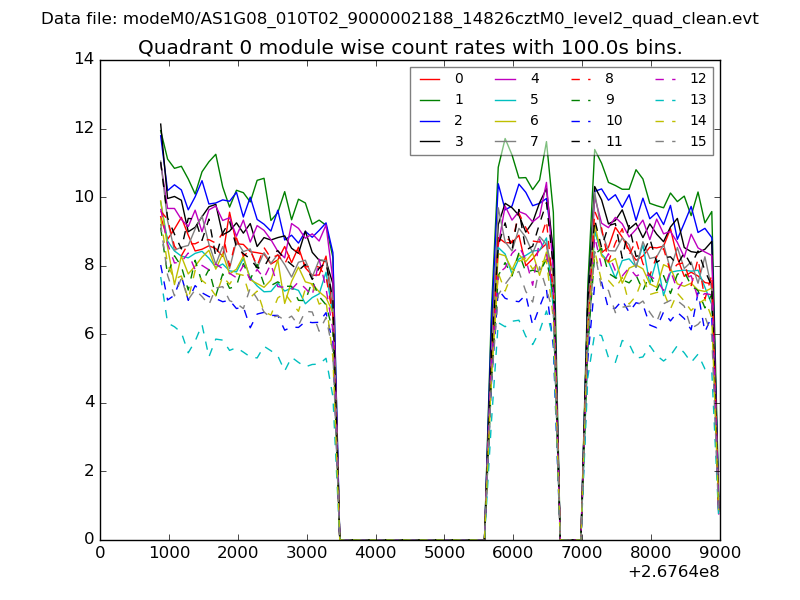 |
 |
| Module-wise count rates for Quadrant B Data is divided into 100 sec bins |
 |
 |
| Module-wise count rates for Quadrant C Data is divided into 100 sec bins |
 |
 |
| Module-wise count rates for Quadrant D Data is divided into 100 sec bins |
 |
 |
| Parameter | Plot |
|---|---|
| CZT HV Monitor |  |
| D_VDD | 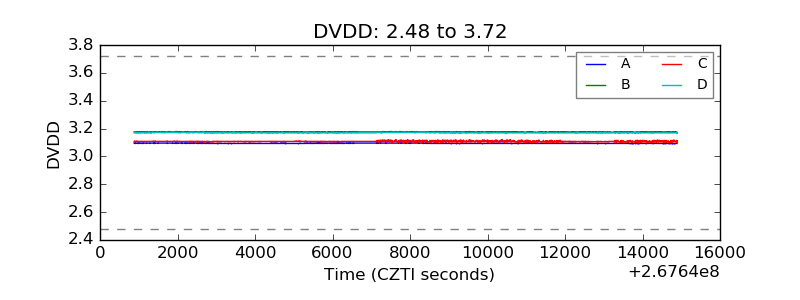 |
| Temperature 1 | 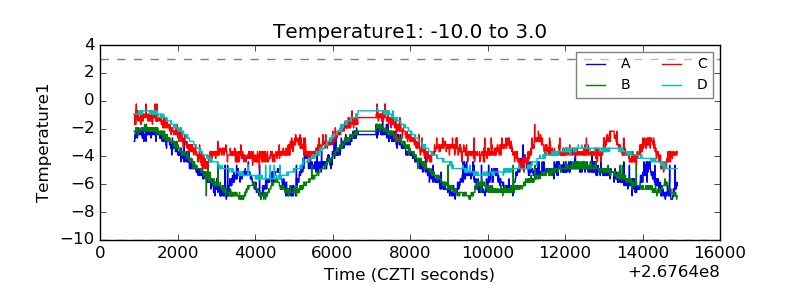 |
| Veto HV Monitor | 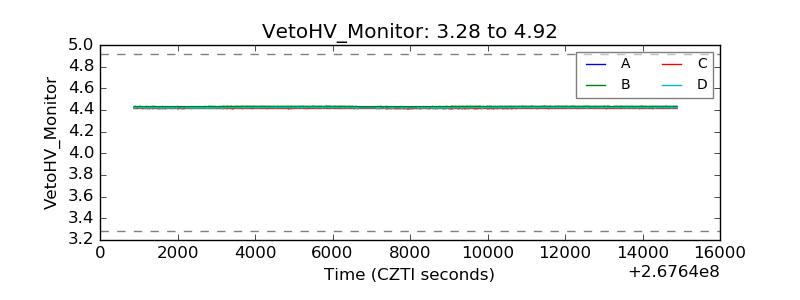 |
| Veto LLD | 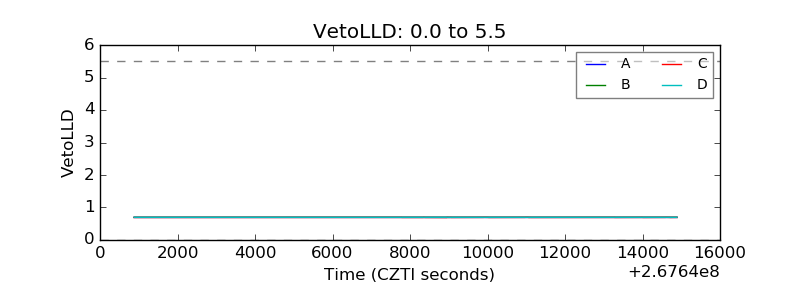 |
| Alpha Counter | 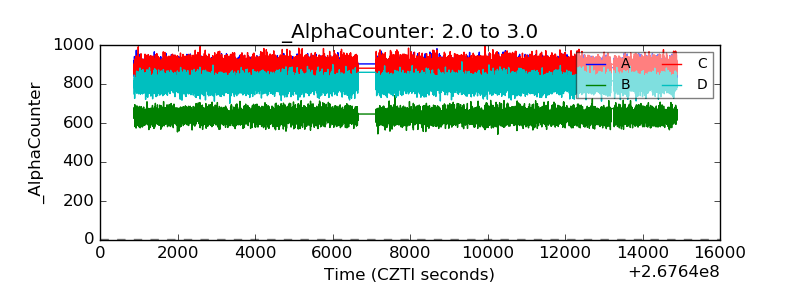 |
| _CPM_Rate | 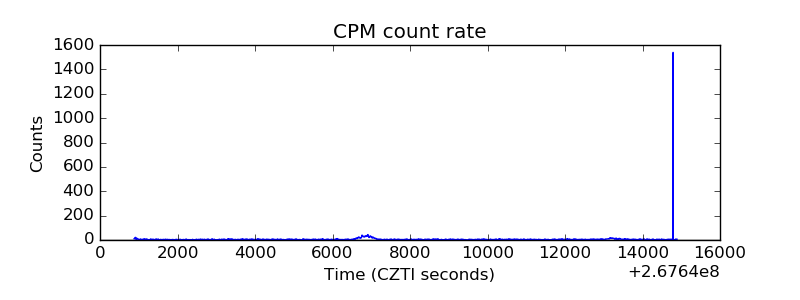 |
| CZT Counter | 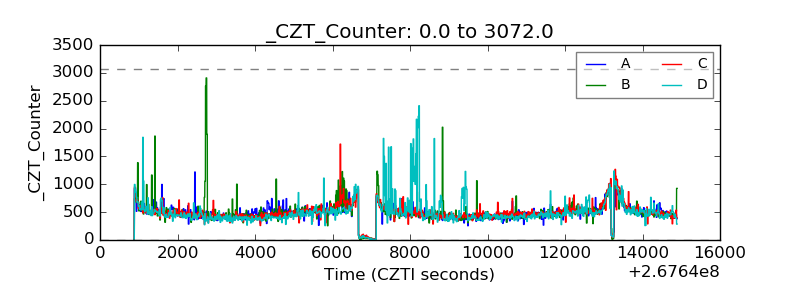 |
| +2.5 Volts monitor |  |
| +5 Volts monitor |  |
| _ROLL_ROT | 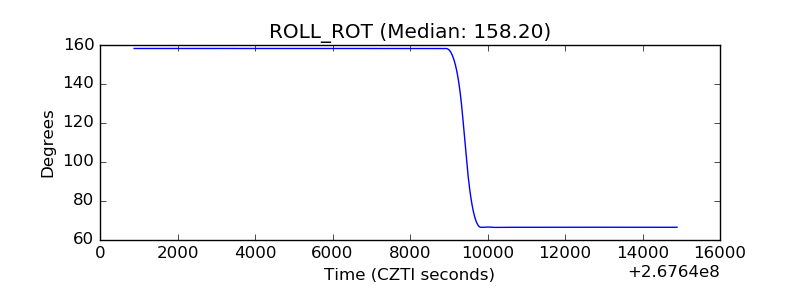 |
| _Roll_DEC | 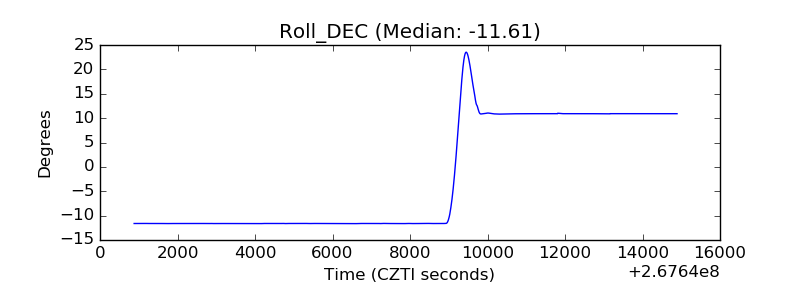 |
| _Roll_RA | 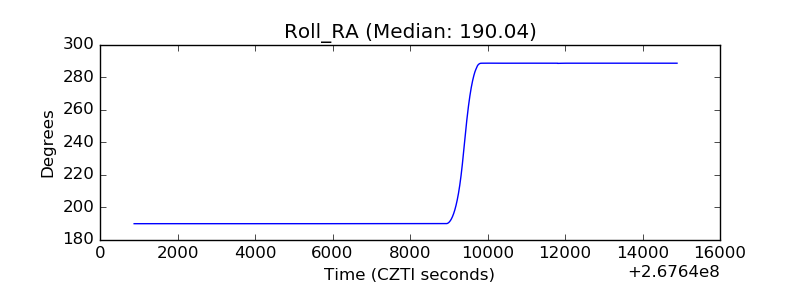 |
| Veto Counter | 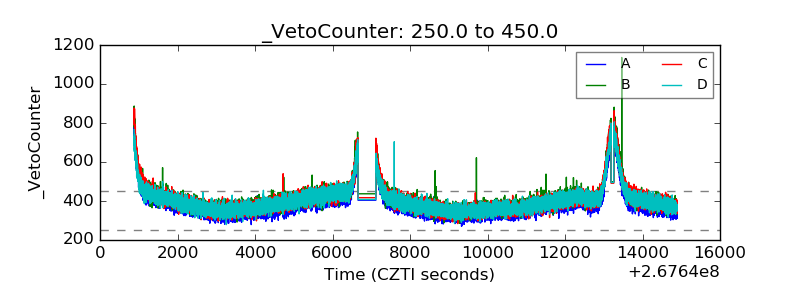 |