| Param | Original file | Final file |
|---|---|---|
| Filename | modeM0/AS1C03_005T02_9000002192cztM0_level2.fits | modeM0/AS1C03_005T02_9000002192cztM0_level2_quad_clean.evt |
| Size (bytes) | 681,166,080 | 738,849,600 |
| Size | 649.6 MB | 704.6 MB |
| Events in quadrant A | 4,191,262 | 4,614,156 |
| Events in quadrant B | 3,964,220 | 4,513,236 |
| Events in quadrant C | 4,062,132 | 4,350,190 |
| Events in quadrant D | 3,569,088 | 4,057,397 |
| Mode M0 | |||
|---|---|---|---|
| Quadrant | BADHDUFLAG | Total packets | Discarded packets |
| A | 0 | 147214 | 0 |
| B | 0 | 155434 | 0 |
| C | 0 | 150501 | 0 |
| D | 0 | 161641 | 0 |
| Mode SS | |||
|---|---|---|---|
| Quadrant | BADHDUFLAG | Total packets | Discarded packets |
| A | 0 | 1436 | 0 |
| B | 0 | 1436 | 0 |
| C | 0 | 1436 | 0 |
| D | 0 | 1436 | 0 |
| Mode M9 | |||
|---|---|---|---|
| Quadrant | BADHDUFLAG | Total packets | Discarded packets |
| A | 0 | 112 | 0 |
| B | 0 | 112 | 0 |
| C | 0 | 112 | 0 |
| D | 0 | 112 | 0 |
| Quadrant | Total seconds | Saturated seconds | Saturation percentage |
|---|---|---|---|
| A | 70630 | 676 | 0.957100% |
| B | 70630 | 1165 | 1.649441% |
| C | 70630 | 581 | 0.822597% |
| D | 70630 | 1089 | 1.541838% |
Noise dominated data is calculated using 1-second bins in cleaned event files. If a bin has >2000 counts, and if more than 50% of those come from <1% of pixels, then it is considered to be noise-dominated and hence unusable.
| Quadrant | # 1 sec bins | Bins with >0 counts | Bins with >2000 counts | High rate bins dominated by noise | Noise dominated (total time) | Noise dominated (detector-on time) | Marked lightcurve |
|---|---|---|---|---|---|---|---|
| A | 81670 | 70630 | 0 | 0 | 0.00% | 0.00% |  |
| B | 81670 | 70611 | 0 | 0 | 0.00% | 0.00% |  |
| C | 81670 | 70631 | 0 | 0 | 0.00% | 0.00% |  |
| D | 81670 | 70613 | 0 | 0 | 0.00% | 0.00% |  |
Top three noisy pixels from each quadrant. If the there are fewer than three noisy pixels in the level2.evt file, extra rows are filled as -1
| Pixel properties | Quadrant properties | ||||||
|---|---|---|---|---|---|---|---|
| Quadrant | DetID | PixID | Counts | Sigma | Mean | Median | Sigma |
| A | 0 | 29 | 4096 | 11.45 | 1091 | 1028 | 268.0 |
| A | 7 | 110 | 3263 | 8.34 | 1091 | 1028 | 268.0 |
| A | 0 | 30 | 3127 | 7.83 | 1091 | 1028 | 268.0 |
| B | 2 | 9 | 3389 | 11.91 | 1048 | 1005 | 200.2 |
| B | 5 | 128 | 2633 | 8.13 | 1048 | 1005 | 200.2 |
| B | 3 | 17 | 2540 | 7.67 | 1048 | 1005 | 200.2 |
| C | 1 | 80 | 3171 | 7.88 | 1073 | 1003 | 275.2 |
| C | 1 | 81 | 3169 | 7.87 | 1073 | 1003 | 275.2 |
| C | 12 | 241 | 2841 | 6.68 | 1073 | 1003 | 275.2 |
| D | 6 | 231 | 2631 | 6.26 | 1019 | 931 | 271.4 |
| D | 6 | 67 | 2519 | 5.85 | 1019 | 931 | 271.4 |
| D | 3 | 14 | 2519 | 5.85 | 1019 | 931 | 271.4 |
Histogram calculated using DETX and DETY for each event in the final _common_clean file
| Quadrant A | 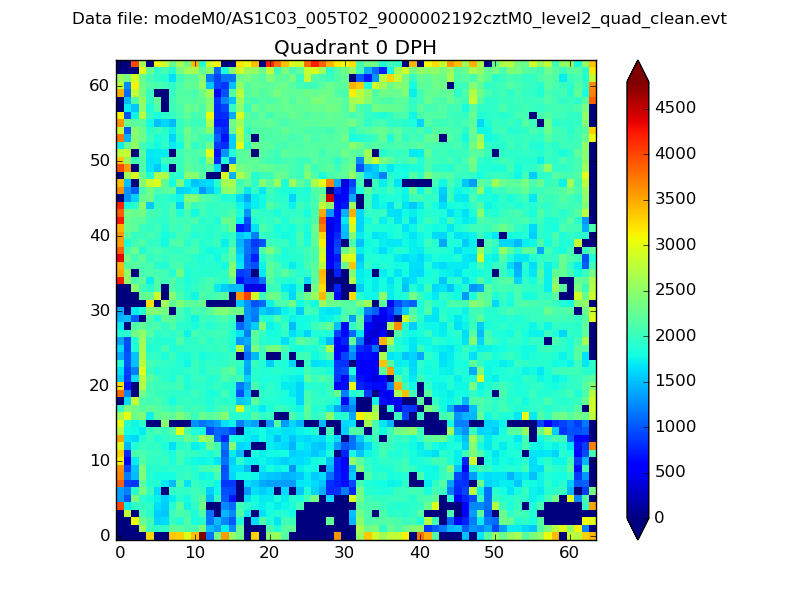 |
 |
Quadrant B |
|---|---|---|---|
| Quadrant D |  |
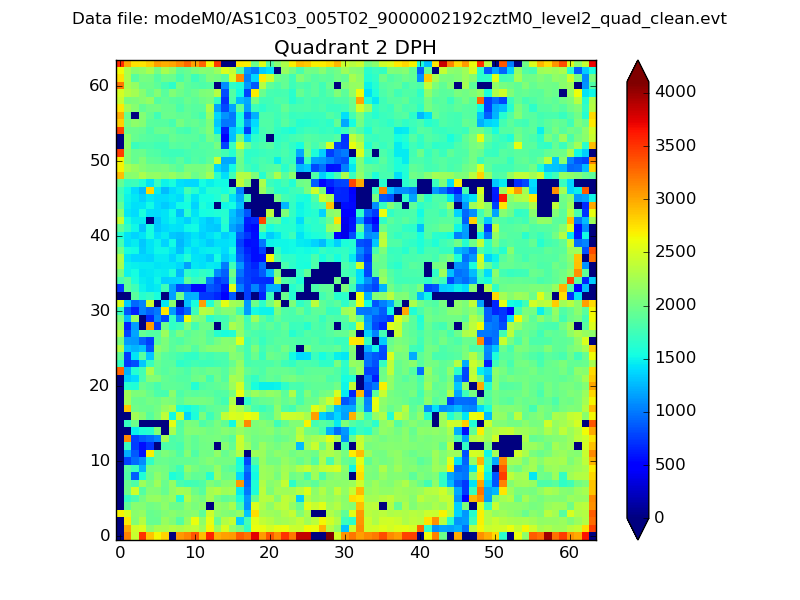 |
Quadrant C |
| Plot type | Count rate plots | Images |
|---|---|---|
| Comparison with Poisson distribution Blue bars denote a histogram of data divided into 1 sec bins. Red curve is a Poisson curve with rate = median count rate of data. |
 |
 |
| Quadrant-wise count rates Data is divided into 100 sec bins |
 |
|
| Module-wise count rates for Quadrant A Data is divided into 100 sec bins |
 |
 |
| Module-wise count rates for Quadrant B Data is divided into 100 sec bins |
 |
 |
| Module-wise count rates for Quadrant C Data is divided into 100 sec bins |
 |
 |
| Module-wise count rates for Quadrant D Data is divided into 100 sec bins |
 |
 |
| Parameter | Plot |
|---|---|
| CZT HV Monitor |  |
| D_VDD | 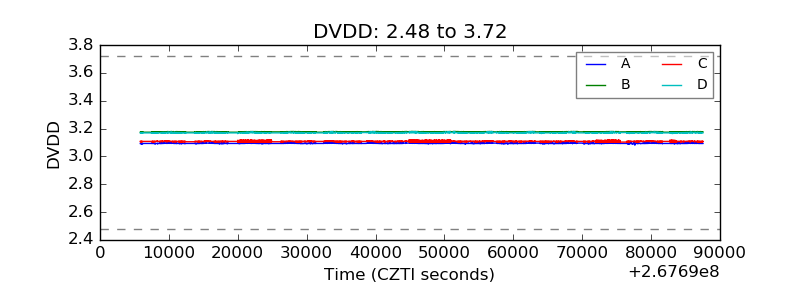 |
| Temperature 1 |  |
| Veto HV Monitor |  |
| Veto LLD |  |
| Alpha Counter |  |
| _CPM_Rate |  |
| CZT Counter |  |
| +2.5 Volts monitor |  |
| +5 Volts monitor |  |
| _ROLL_ROT |  |
| _Roll_DEC |  |
| _Roll_RA |  |
| Veto Counter |  |