| Param | Original file | Final file |
|---|---|---|
| Filename | modeM0/AS1C03_005T02_9000002192_14834cztM0_level2.evt | modeM0/AS1C03_005T02_9000002192_14834cztM0_level2_quad_clean.evt |
| Size (bytes) | 171,083,520 | 48,997,440 |
| Size | 163.2 MB | 46.7 MB |
| Events in quadrant A | 1,202,548 | 336,113 |
| Events in quadrant B | 1,300,260 | 340,855 |
| Events in quadrant C | 1,315,598 | 331,953 |
| Events in quadrant D | 1,216,151 | 320,699 |
| Mode M0 | |||
|---|---|---|---|
| Quadrant | BADHDUFLAG | Total packets | Discarded packets |
| A | 0 | 4983 | 2 |
| B | 0 | 5261 | 1 |
| C | 0 | 5305 | 1 |
| D | 0 | 4988 | 1 |
| Mode SS | |||
|---|---|---|---|
| Quadrant | BADHDUFLAG | Total packets | Discarded packets |
| A | 0 | 44 | 0 |
| B | 0 | 44 | 0 |
| C | 0 | 44 | 0 |
| D | 0 | 44 | 0 |
| Mode M9 | |||
|---|---|---|---|
| Quadrant | BADHDUFLAG | Total packets | Discarded packets |
| A | 0 | 12 | 0 |
| B | 0 | 12 | 0 |
| C | 0 | 12 | 0 |
| D | 0 | 12 | 0 |
| Quadrant | Total seconds | Saturated seconds | Saturation percentage |
|---|---|---|---|
| A | 2128 | 71 | 3.336466% |
| B | 2128 | 90 | 4.229323% |
| C | 2128 | 80 | 3.759398% |
| D | 2128 | 63 | 2.960526% |
Noise dominated data is calculated using 1-second bins in cleaned event files. If a bin has >2000 counts, and if more than 50% of those come from <1% of pixels, then it is considered to be noise-dominated and hence unusable.
| Quadrant | # 1 sec bins | Bins with >0 counts | Bins with >2000 counts | High rate bins dominated by noise | Noise dominated (total time) | Noise dominated (detector-on time) | Marked lightcurve |
|---|---|---|---|---|---|---|---|
| A | 3319 | 2130 | 2 | 2 | 0.06% | 0.09% | 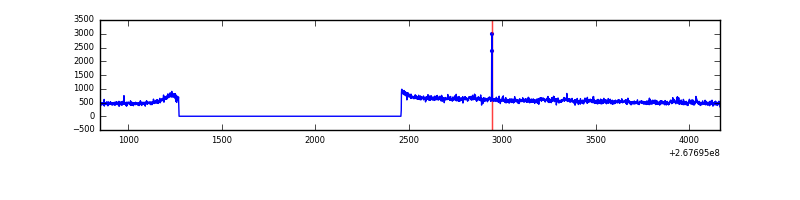 |
| B | 3319 | 2130 | 10 | 10 | 0.30% | 0.47% | 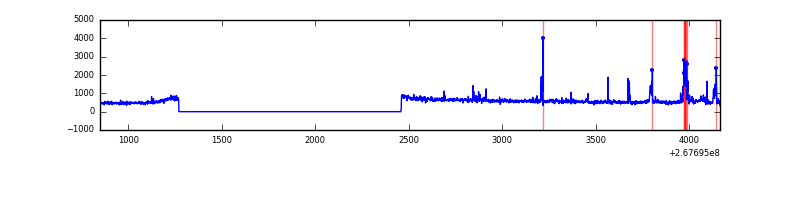 |
| C | 3319 | 2130 | 21 | 21 | 0.63% | 0.99% | 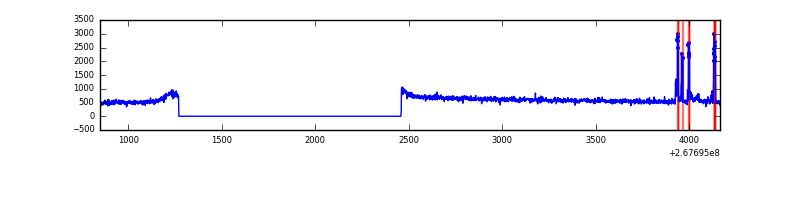 |
| D | 3319 | 2130 | 9 | 9 | 0.27% | 0.42% | 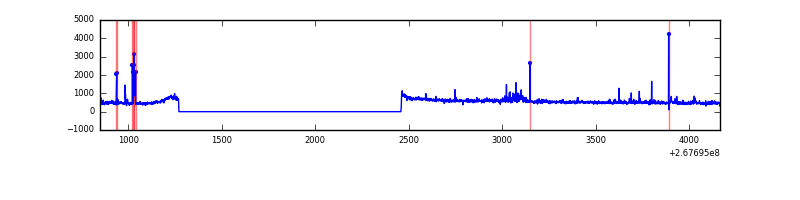 |
Top three noisy pixels from each quadrant. If the there are fewer than three noisy pixels in the level2.evt file, extra rows are filled as -1
| Pixel properties | Quadrant properties | ||||||
|---|---|---|---|---|---|---|---|
| Quadrant | DetID | PixID | Counts | Sigma | Mean | Median | Sigma |
| A | 12 | 189 | 33387 | 539.29 | 301 | 295 | 61.4 |
| A | 9 | 143 | 6024 | 93.36 | 301 | 295 | 61.4 |
| A | 4 | 2 | 3427 | 51.04 | 301 | 295 | 61.4 |
| B | 0 | 229 | 67087 | 1194.92 | 295 | 288 | 55.9 |
| B | 0 | 189 | 28387 | 502.64 | 295 | 288 | 55.9 |
| B | 3 | 64 | 27924 | 494.36 | 295 | 288 | 55.9 |
| C | 3 | 233 | 100167 | 1470.79 | 294 | 295 | 67.9 |
| C | 0 | 207 | 70342 | 1031.57 | 294 | 295 | 67.9 |
| C | 13 | 61 | 2076 | 26.23 | 294 | 295 | 67.9 |
| D | 7 | 254 | 30416 | 417.07 | 298 | 289 | 72.2 |
| D | 2 | 136 | 23170 | 316.76 | 298 | 289 | 72.2 |
| D | 10 | 70 | 11987 | 161.95 | 298 | 289 | 72.2 |
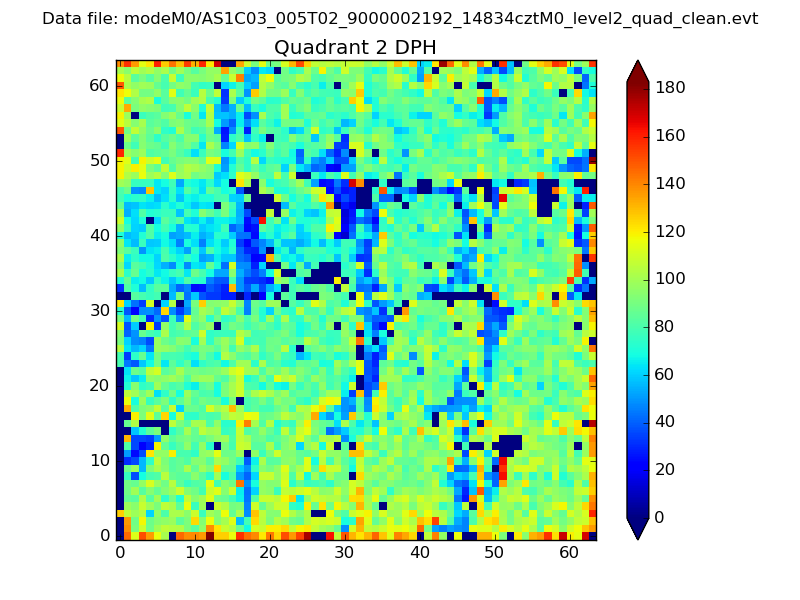
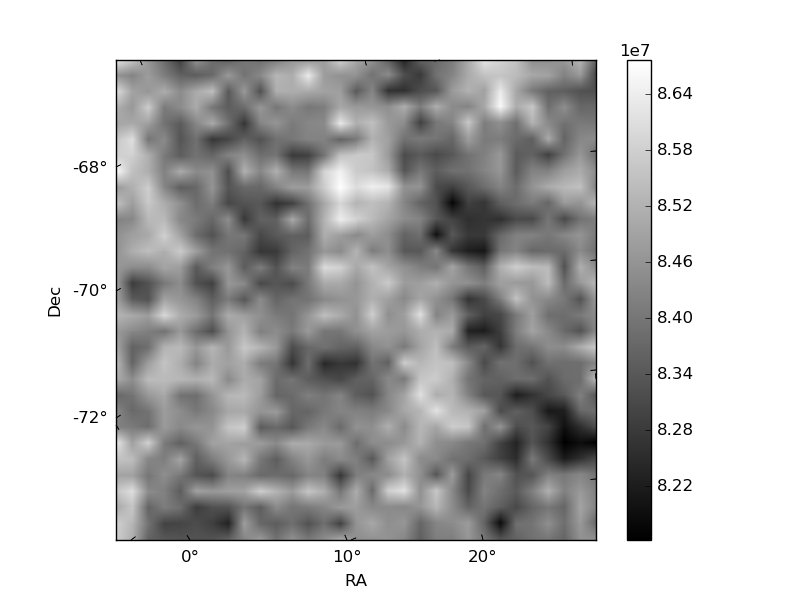
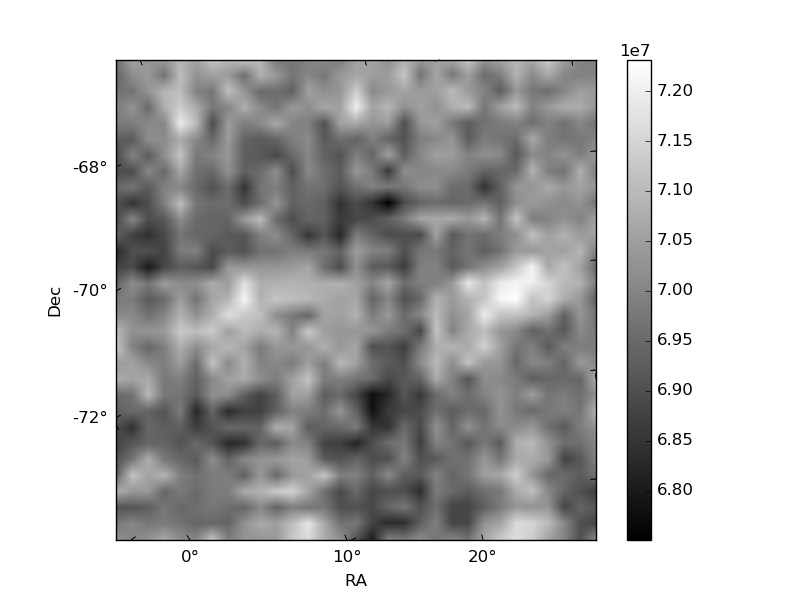
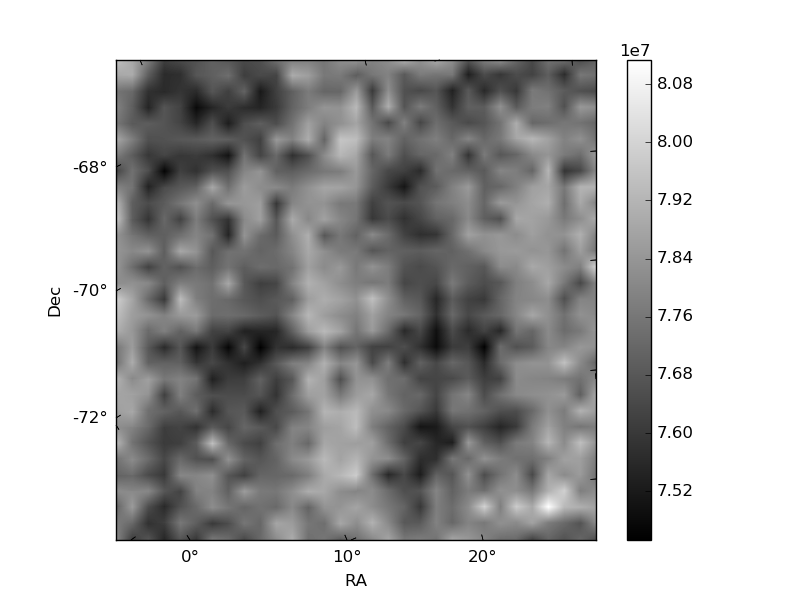
Histogram calculated using DETX and DETY for each event in the final _common_clean file
| Quadrant A | 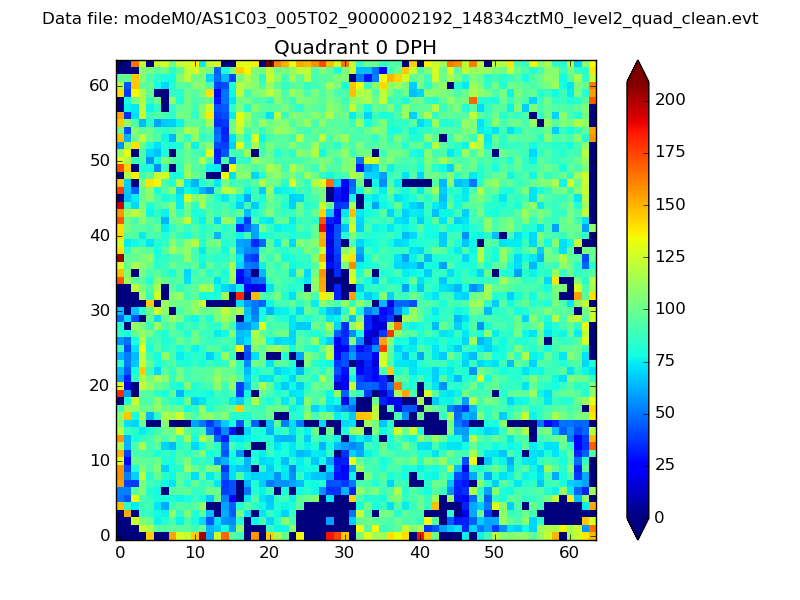 |
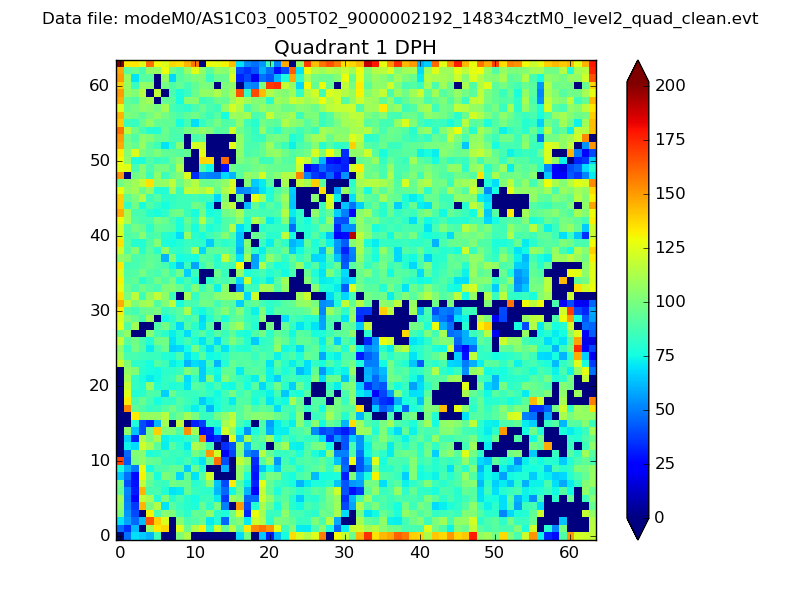 |
Quadrant B |
|---|---|---|---|
| Quadrant D | 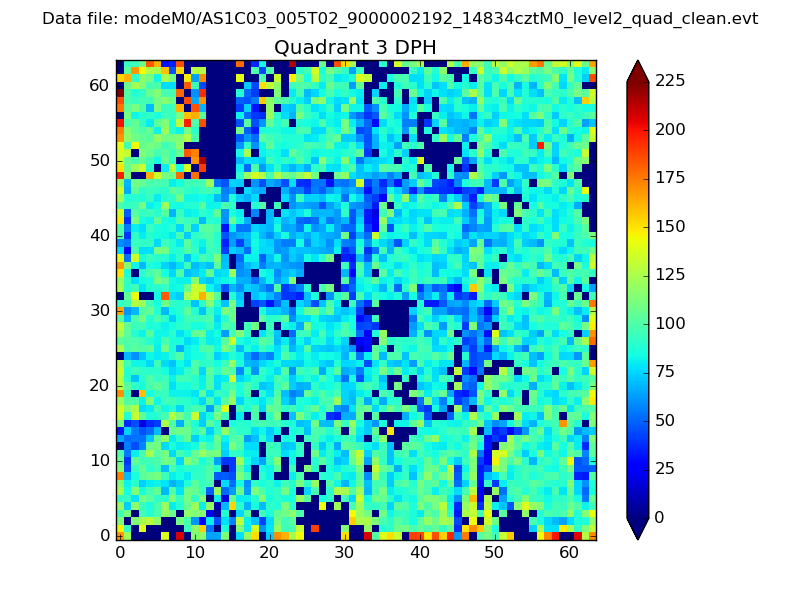 |
 |
Quadrant C |
| Plot type | Count rate plots | Images |
|---|---|---|
| Comparison with Poisson distribution Blue bars denote a histogram of data divided into 1 sec bins. Red curve is a Poisson curve with rate = median count rate of data. |
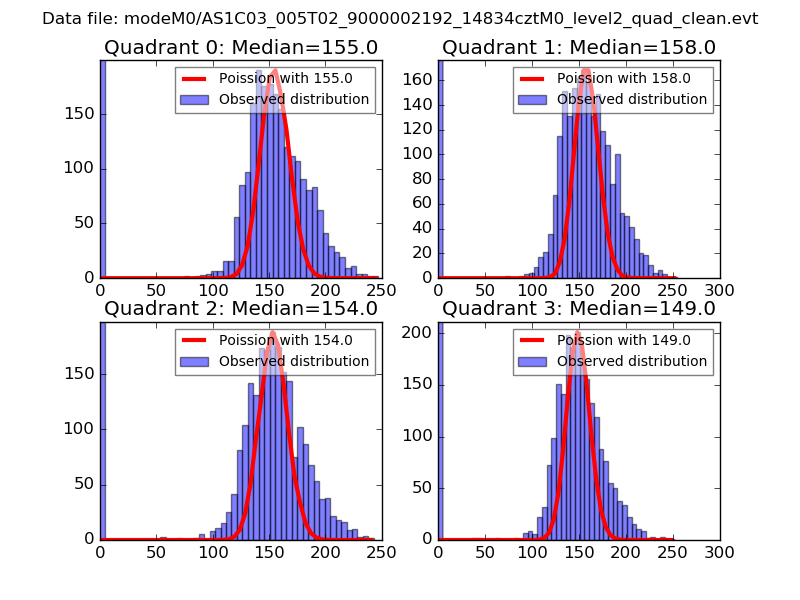 |
 |
| Quadrant-wise count rates Data is divided into 100 sec bins |
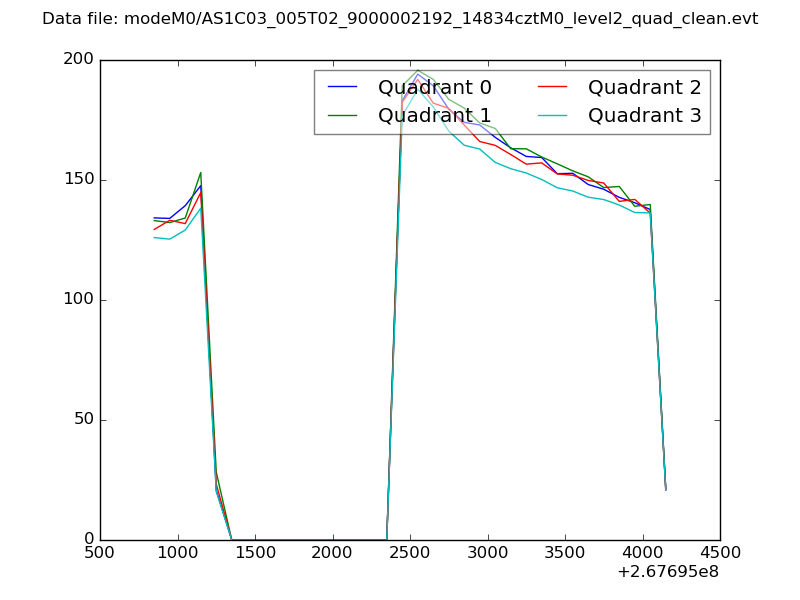 |
|
| Module-wise count rates for Quadrant A Data is divided into 100 sec bins |
 |
 |
| Module-wise count rates for Quadrant B Data is divided into 100 sec bins |
 |
 |
| Module-wise count rates for Quadrant C Data is divided into 100 sec bins |
 |
 |
| Module-wise count rates for Quadrant D Data is divided into 100 sec bins |
 |
 |
| Parameter | Plot |
|---|---|
| CZT HV Monitor | 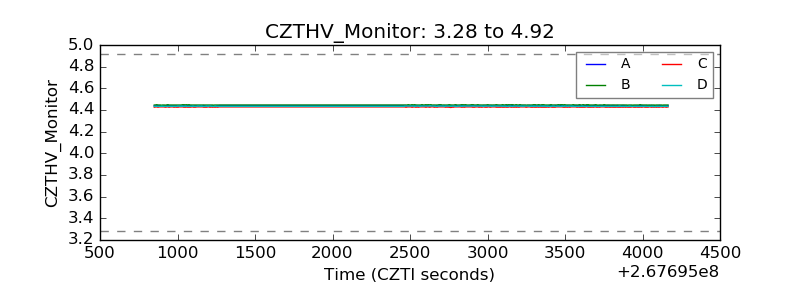 |
| D_VDD | 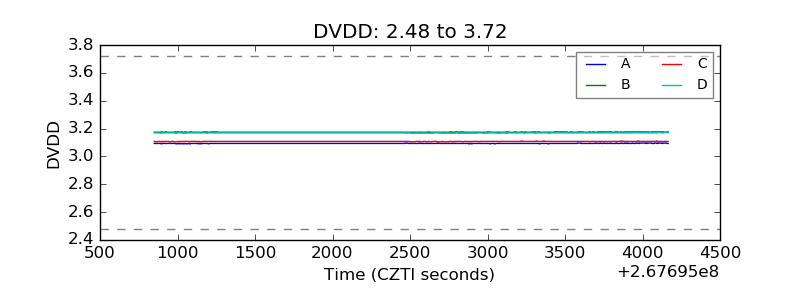 |
| Temperature 1 |  |
| Veto HV Monitor | 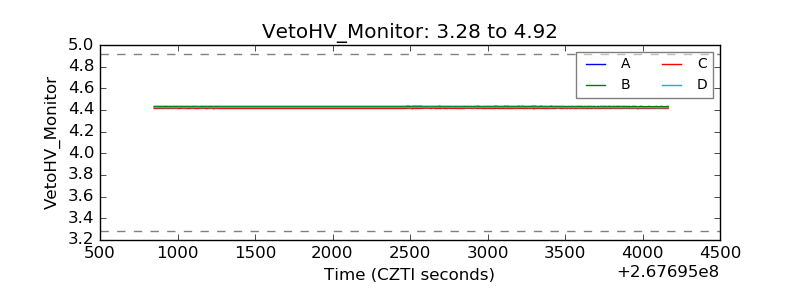 |
| Veto LLD |  |
| Alpha Counter | 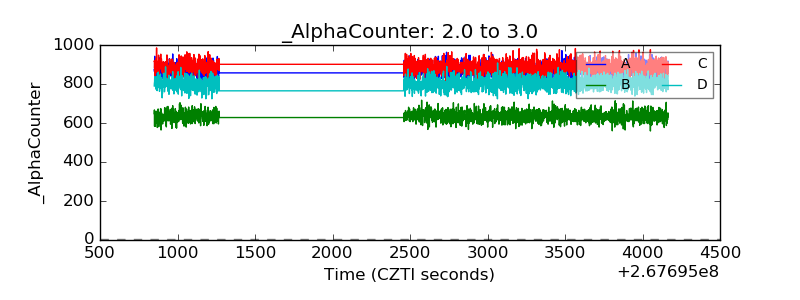 |
| _CPM_Rate | 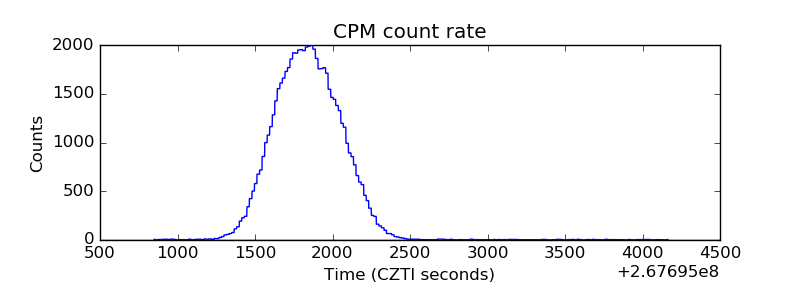 |
| CZT Counter | 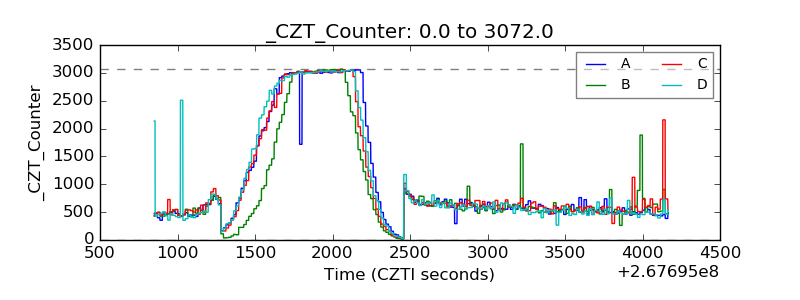 |
| +2.5 Volts monitor |  |
| +5 Volts monitor |  |
| _ROLL_ROT |  |
| _Roll_DEC |  |
| _Roll_RA | 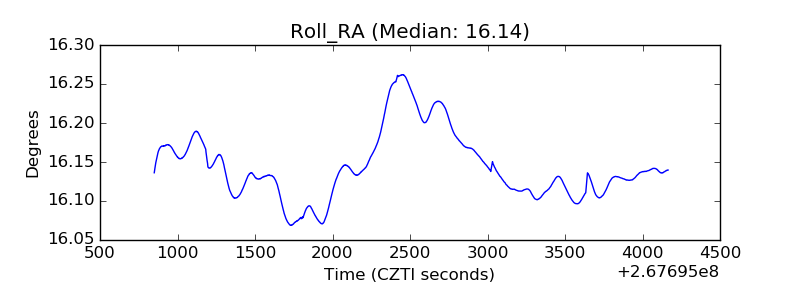 |
| Veto Counter |  |