| Param | Original file | Final file |
|---|---|---|
| Filename | modeM0/AS1C03_005T02_9000002192_14835cztM0_level2.evt | modeM0/AS1C03_005T02_9000002192_14835cztM0_level2_quad_clean.evt |
| Size (bytes) | 464,230,080 | 115,542,720 |
| Size | 442.7 MB | 110.2 MB |
| Events in quadrant A | 3,266,023 | 779,306 |
| Events in quadrant B | 3,527,138 | 779,613 |
| Events in quadrant C | 3,520,379 | 765,952 |
| Events in quadrant D | 3,323,970 | 741,107 |
| Mode M0 | |||
|---|---|---|---|
| Quadrant | BADHDUFLAG | Total packets | Discarded packets |
| A | 0 | 13500 | 2 |
| B | 0 | 14331 | 1 |
| C | 0 | 14177 | 1 |
| D | 0 | 13983 | 1 |
| Mode SS | |||
|---|---|---|---|
| Quadrant | BADHDUFLAG | Total packets | Discarded packets |
| A | 0 | 126 | 0 |
| B | 0 | 126 | 0 |
| C | 0 | 126 | 0 |
| D | 0 | 126 | 0 |
| Mode M9 | |||
|---|---|---|---|
| Quadrant | BADHDUFLAG | Total packets | Discarded packets |
| A | 0 | 13 | 0 |
| B | 0 | 13 | 0 |
| C | 0 | 13 | 0 |
| D | 0 | 13 | 0 |
| Quadrant | Total seconds | Saturated seconds | Saturation percentage |
|---|---|---|---|
| A | 6211 | 94 | 1.513444% |
| B | 6211 | 136 | 2.189664% |
| C | 6211 | 103 | 1.658348% |
| D | 6211 | 94 | 1.513444% |
Noise dominated data is calculated using 1-second bins in cleaned event files. If a bin has >2000 counts, and if more than 50% of those come from <1% of pixels, then it is considered to be noise-dominated and hence unusable.
| Quadrant | # 1 sec bins | Bins with >0 counts | Bins with >2000 counts | High rate bins dominated by noise | Noise dominated (total time) | Noise dominated (detector-on time) | Marked lightcurve |
|---|---|---|---|---|---|---|---|
| A | 7472 | 6213 | 2 | 2 | 0.03% | 0.03% | 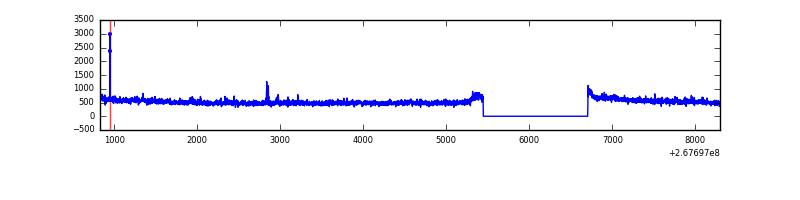 |
| B | 7472 | 6213 | 21 | 21 | 0.28% | 0.34% | 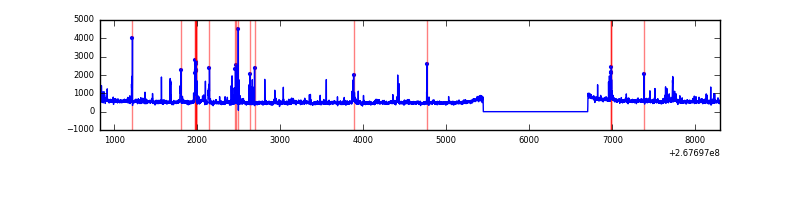 |
| C | 7472 | 6213 | 35 | 35 | 0.47% | 0.56% | 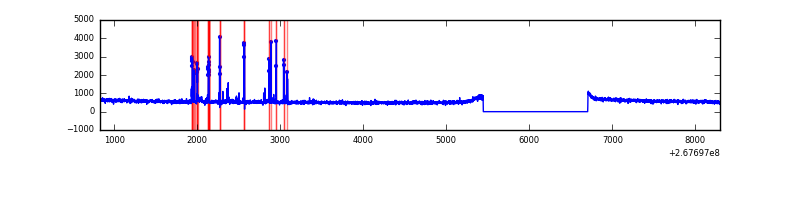 |
| D | 7472 | 6213 | 14 | 14 | 0.19% | 0.23% | 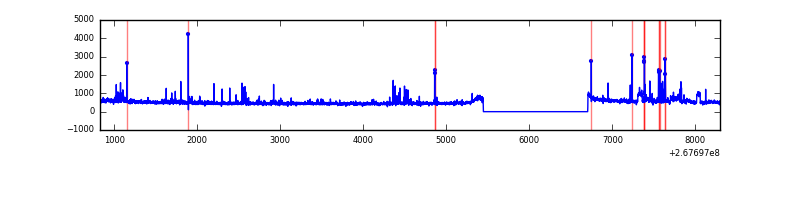 |
Top three noisy pixels from each quadrant. If the there are fewer than three noisy pixels in the level2.evt file, extra rows are filled as -1
| Pixel properties | Quadrant properties | ||||||
|---|---|---|---|---|---|---|---|
| Quadrant | DetID | PixID | Counts | Sigma | Mean | Median | Sigma |
| A | 12 | 189 | 100269 | 612.47 | 817 | 802 | 162.4 |
| A | 9 | 143 | 12511 | 72.1 | 817 | 802 | 162.4 |
| A | 0 | 226 | 7305 | 40.04 | 817 | 802 | 162.4 |
| B | 3 | 64 | 108090 | 731.26 | 800 | 783 | 146.7 |
| B | 0 | 229 | 88879 | 600.34 | 800 | 783 | 146.7 |
| B | 0 | 189 | 50322 | 337.59 | 800 | 783 | 146.7 |
| C | 3 | 233 | 307949 | 1730.3 | 783 | 789 | 177.5 |
| C | 0 | 207 | 158616 | 889.07 | 783 | 789 | 177.5 |
| C | 13 | 61 | 5660 | 27.44 | 783 | 789 | 177.5 |
| D | 13 | 104 | 72630 | 376.82 | 797 | 774 | 190.7 |
| D | 10 | 70 | 63978 | 331.45 | 797 | 774 | 190.7 |
| D | 7 | 254 | 44761 | 230.67 | 797 | 774 | 190.7 |
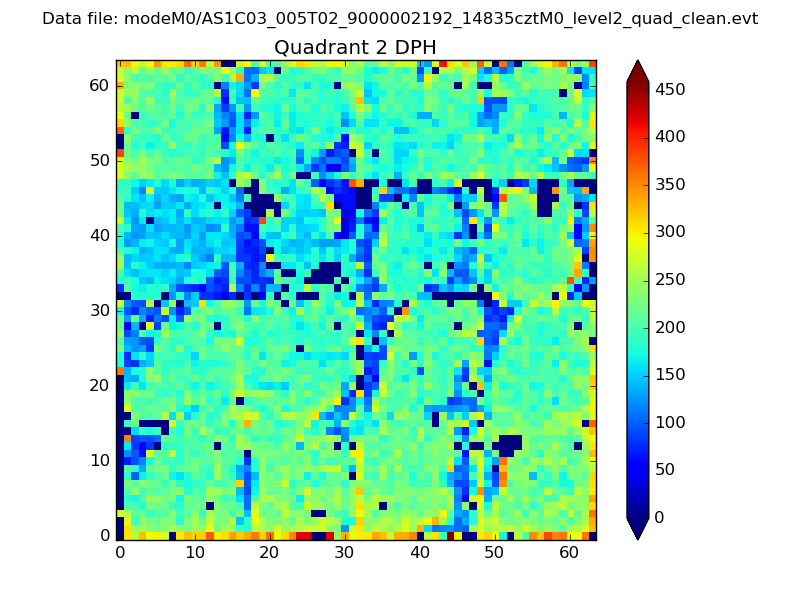
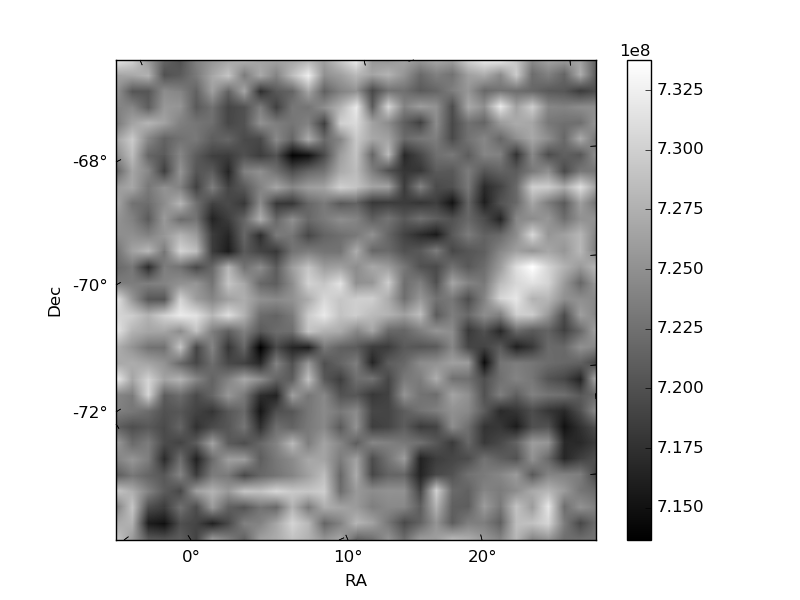
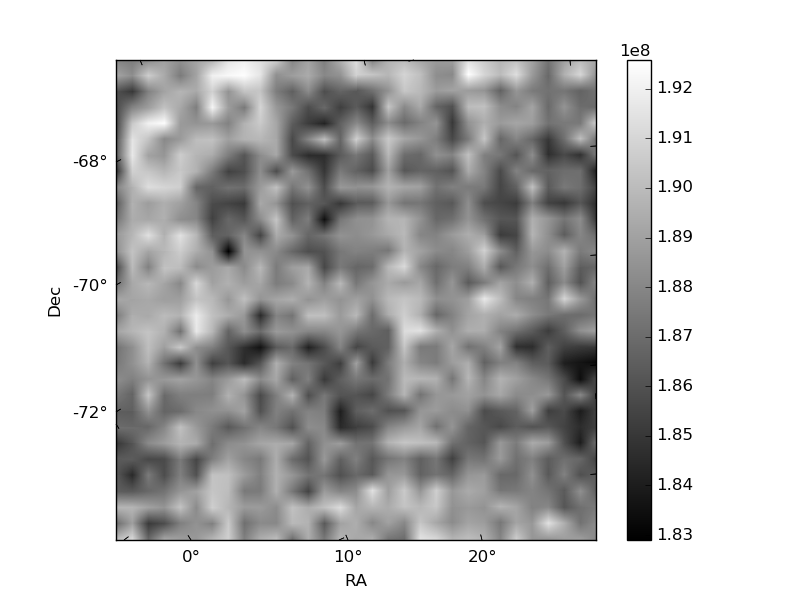
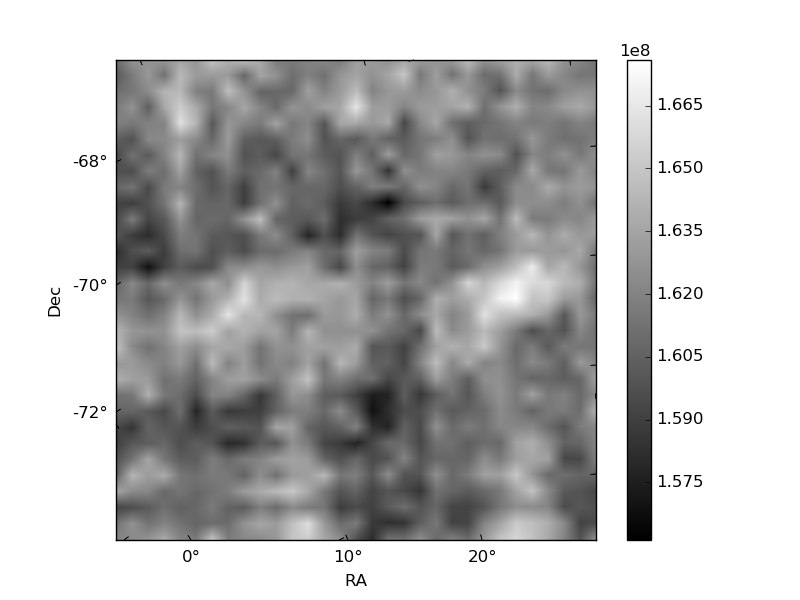
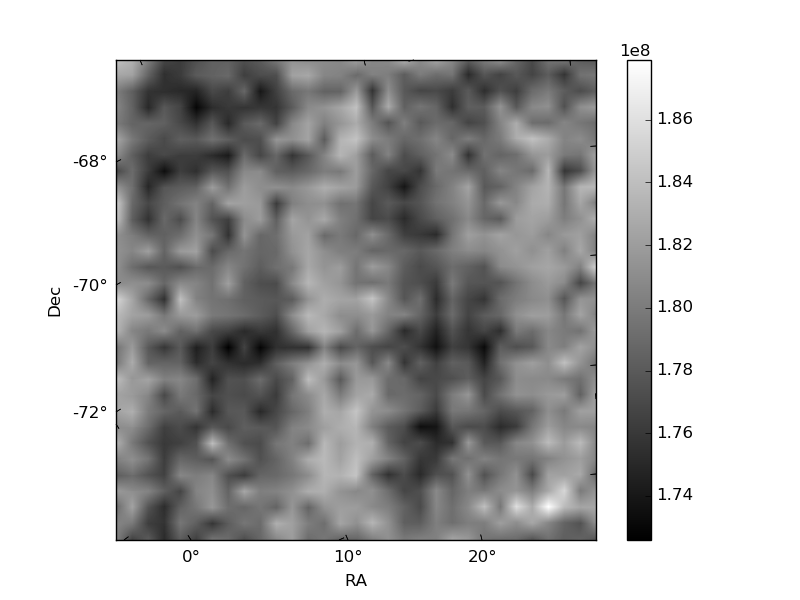
Histogram calculated using DETX and DETY for each event in the final _common_clean file
| Quadrant A | 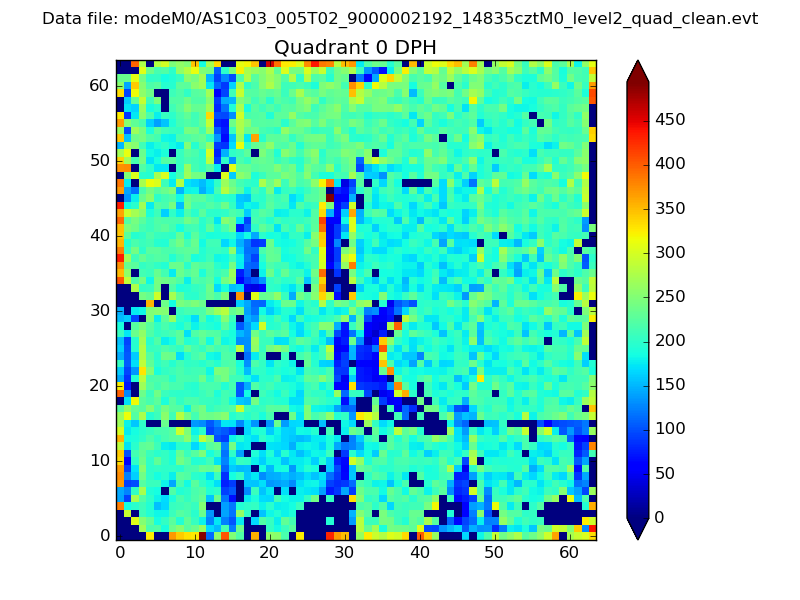 |
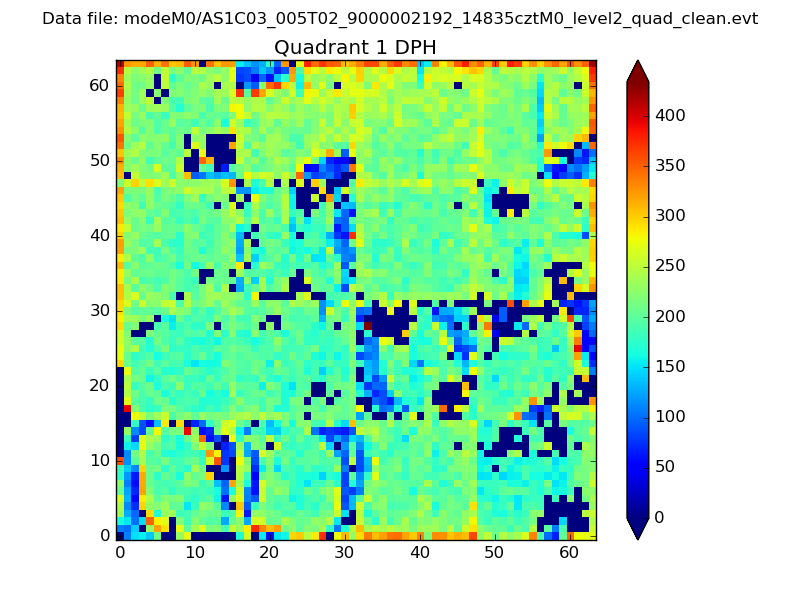 |
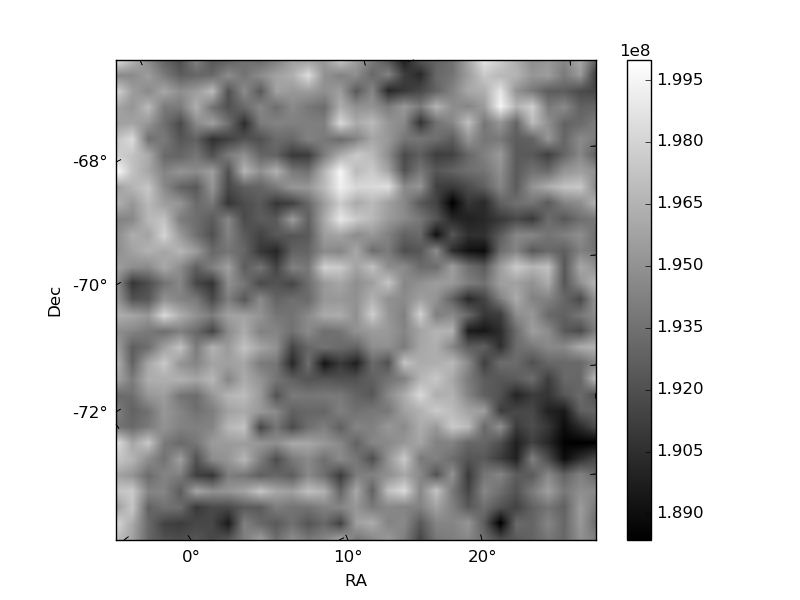
Quadrant B |
|---|---|---|---|
| Quadrant D | 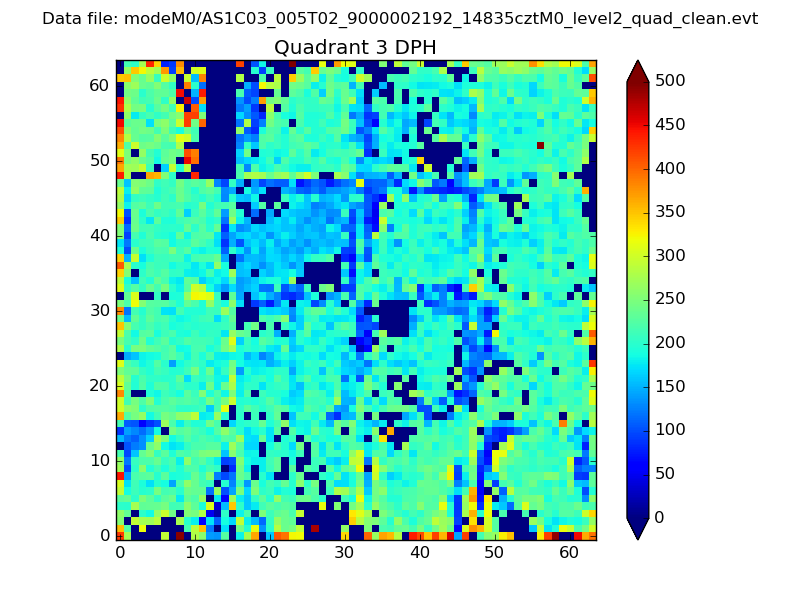 |
 |
Quadrant C |
| Plot type | Count rate plots | Images |
|---|---|---|
| Comparison with Poisson distribution Blue bars denote a histogram of data divided into 1 sec bins. Red curve is a Poisson curve with rate = median count rate of data. |
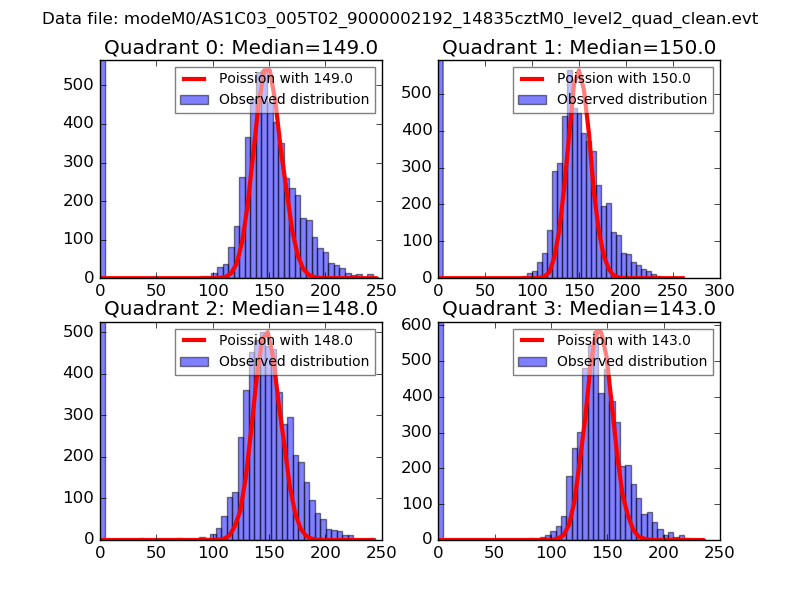 |
 |
| Quadrant-wise count rates Data is divided into 100 sec bins |
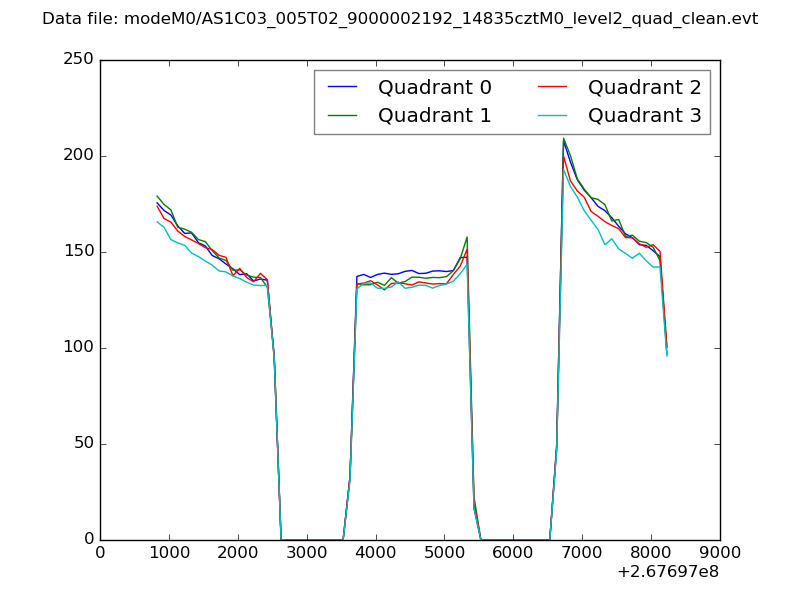 |
|
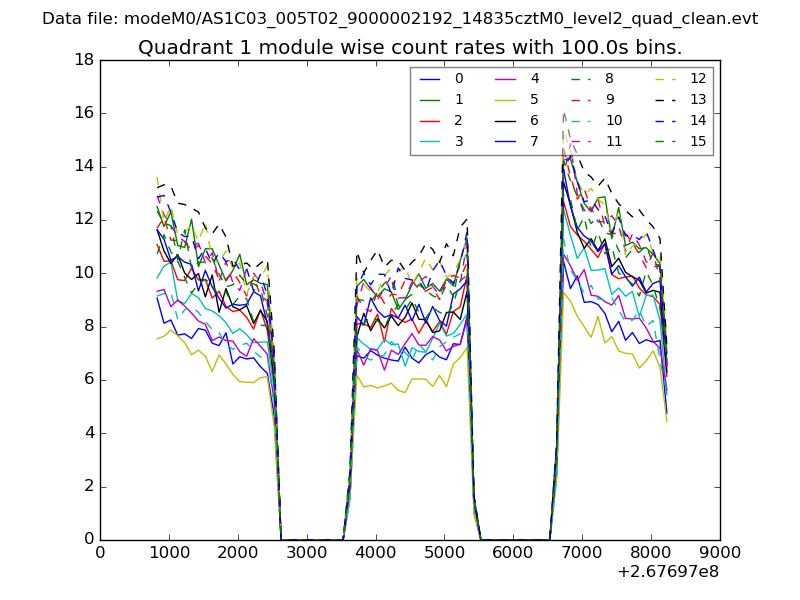
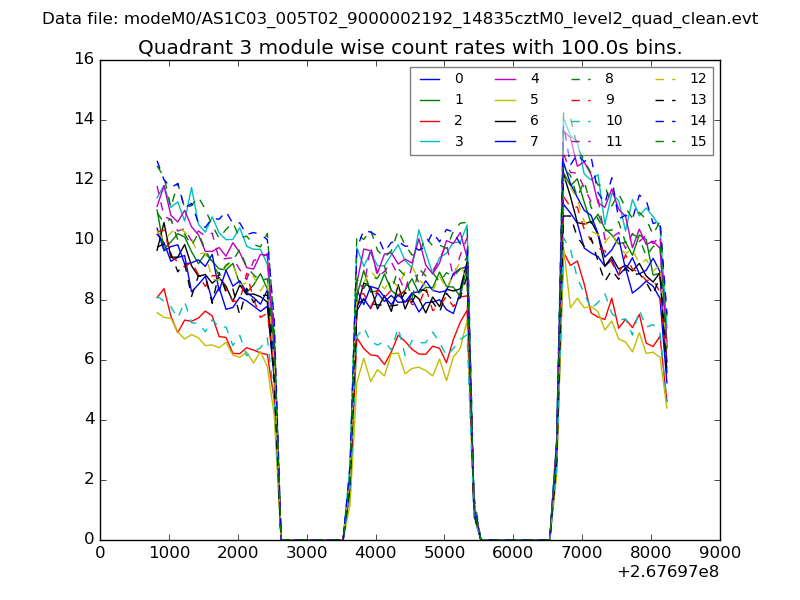
| Module-wise count rates for Quadrant A Data is divided into 100 sec bins |
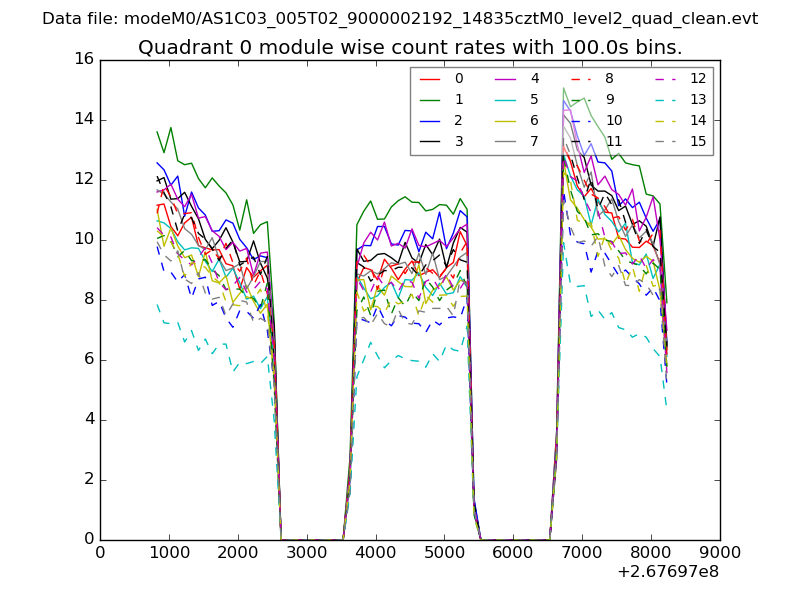 |
 |
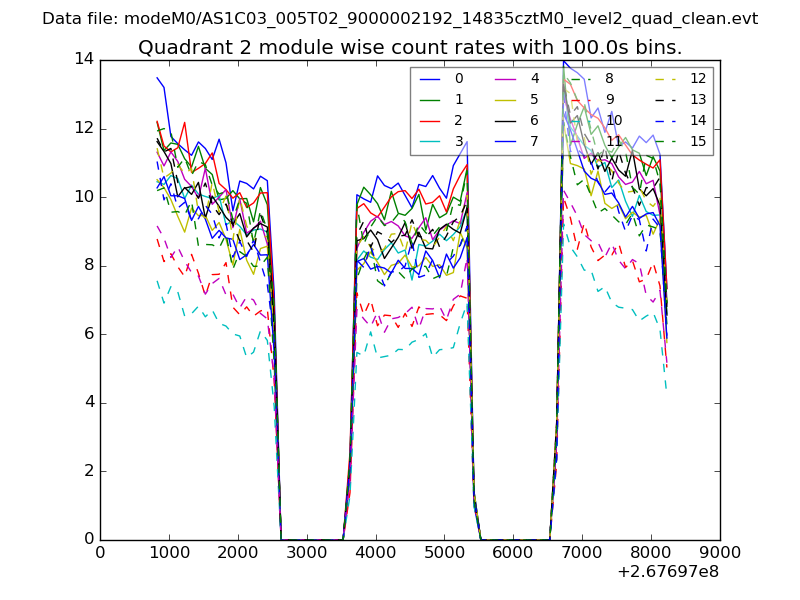
| Module-wise count rates for Quadrant B Data is divided into 100 sec bins |
 |
 |
| Module-wise count rates for Quadrant C Data is divided into 100 sec bins |
 |
 |
| Module-wise count rates for Quadrant D Data is divided into 100 sec bins |
 |
 |
| Parameter | Plot |
|---|---|
| CZT HV Monitor | 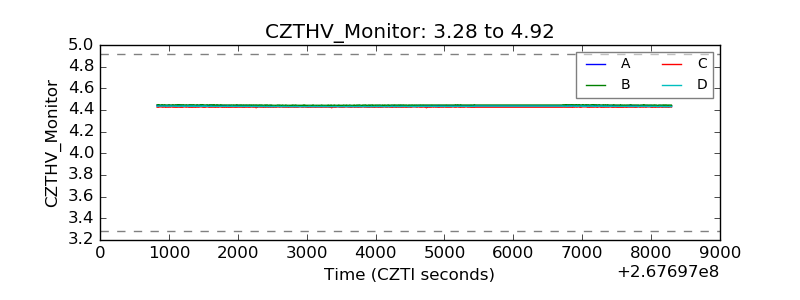 |
| D_VDD | 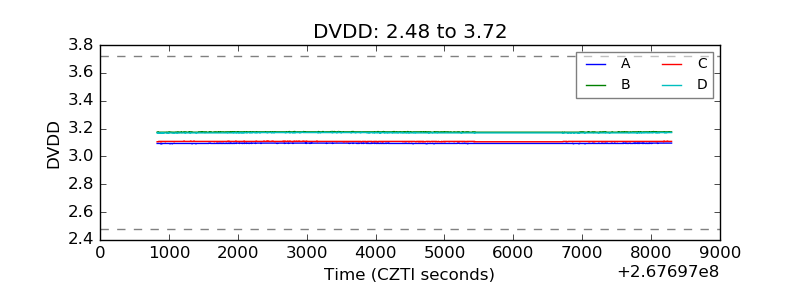 |
| Temperature 1 | 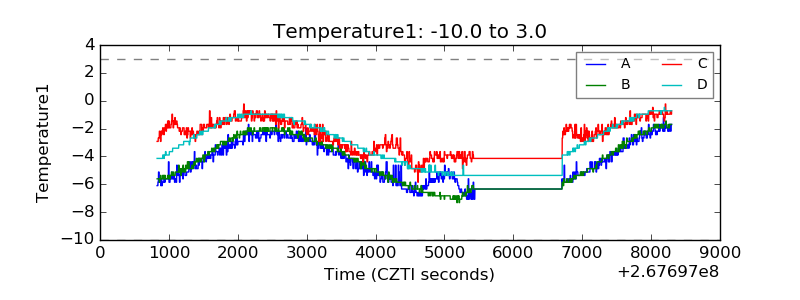 |
| Veto HV Monitor | 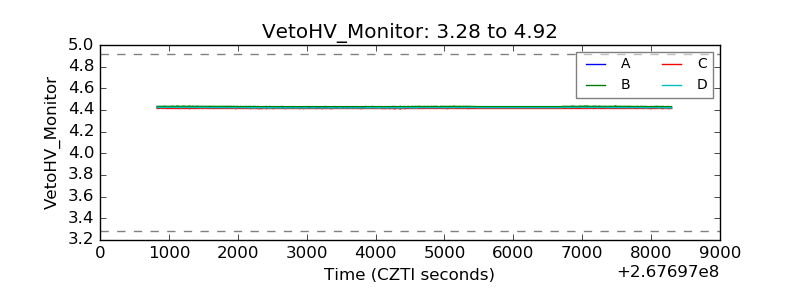 |
| Veto LLD | 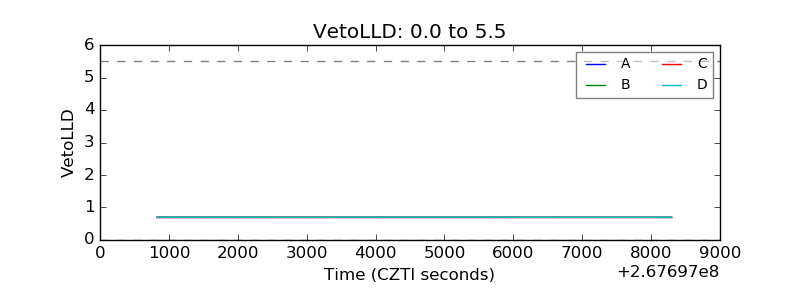 |
| Alpha Counter | 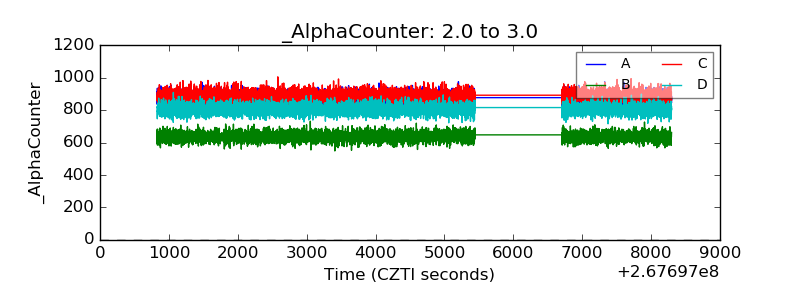 |
| _CPM_Rate | 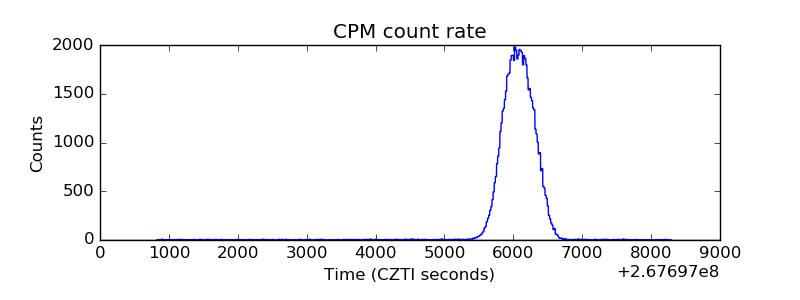 |
| CZT Counter | 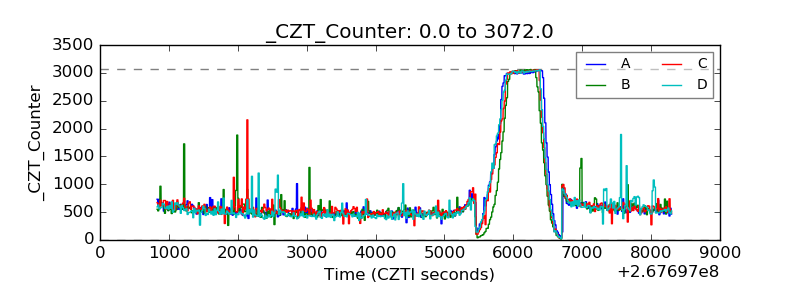 |
| +2.5 Volts monitor |  |
| +5 Volts monitor |  |
| _ROLL_ROT | 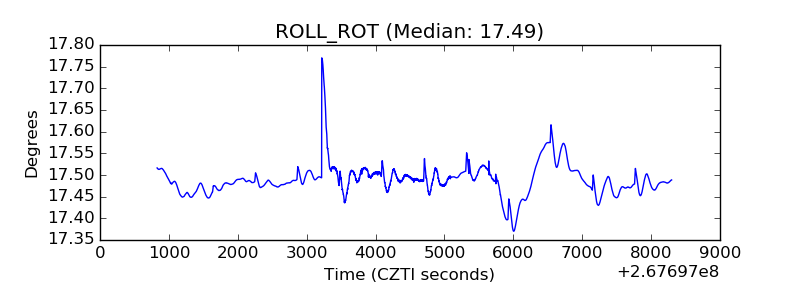 |
| _Roll_DEC | 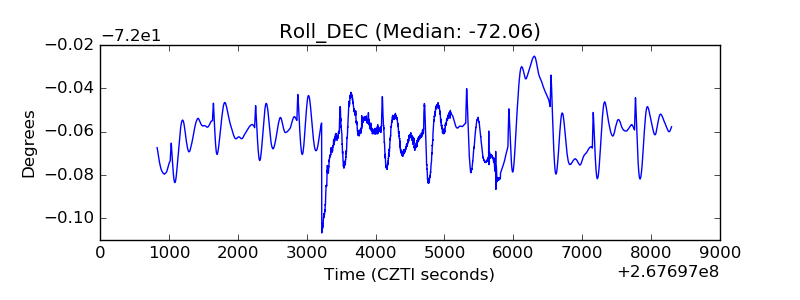 |
| _Roll_RA | 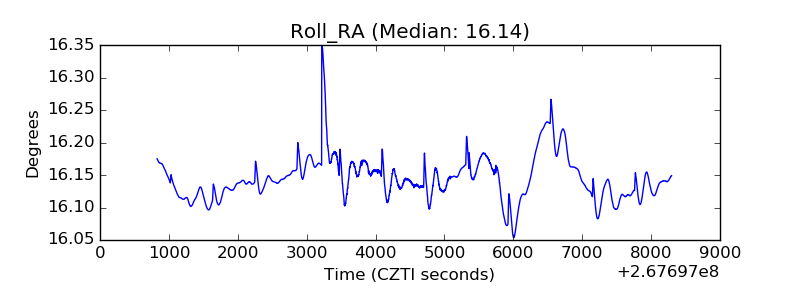 |
| Veto Counter | 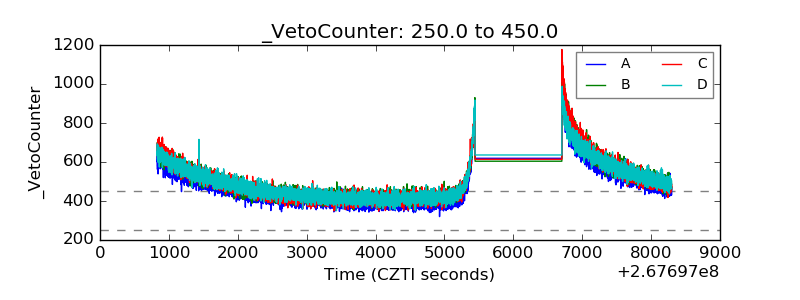 |