| Param | Original file | Final file |
|---|---|---|
| Filename | modeM0/AS1C03_005T02_9000002192_14836cztM0_level2.evt | modeM0/AS1C03_005T02_9000002192_14836cztM0_level2_quad_clean.evt |
| Size (bytes) | 472,798,080 | 111,810,240 |
| Size | 450.9 MB | 106.6 MB |
| Events in quadrant A | 3,235,529 | 751,955 |
| Events in quadrant B | 3,481,311 | 750,002 |
| Events in quadrant C | 3,350,231 | 736,028 |
| Events in quadrant D | 3,828,658 | 713,497 |
| Mode M0 | |||
|---|---|---|---|
| Quadrant | BADHDUFLAG | Total packets | Discarded packets |
| A | 0 | 13355 | 2 |
| B | 0 | 14216 | 1 |
| C | 0 | 13697 | 1 |
| D | 0 | 15332 | 1 |
| Mode SS | |||
|---|---|---|---|
| Quadrant | BADHDUFLAG | Total packets | Discarded packets |
| A | 0 | 128 | 0 |
| B | 0 | 128 | 0 |
| C | 0 | 128 | 0 |
| D | 0 | 128 | 0 |
| Mode M9 | |||
|---|---|---|---|
| Quadrant | BADHDUFLAG | Total packets | Discarded packets |
| A | 0 | 13 | 0 |
| B | 0 | 13 | 0 |
| C | 0 | 13 | 0 |
| D | 0 | 13 | 0 |
| Quadrant | Total seconds | Saturated seconds | Saturation percentage |
|---|---|---|---|
| A | 6226 | 63 | 1.011886% |
| B | 6226 | 84 | 1.349181% |
| C | 6226 | 34 | 0.546097% |
| D | 6226 | 98 | 1.574044% |
Noise dominated data is calculated using 1-second bins in cleaned event files. If a bin has >2000 counts, and if more than 50% of those come from <1% of pixels, then it is considered to be noise-dominated and hence unusable.
| Quadrant | # 1 sec bins | Bins with >0 counts | Bins with >2000 counts | High rate bins dominated by noise | Noise dominated (total time) | Noise dominated (detector-on time) | Marked lightcurve |
|---|---|---|---|---|---|---|---|
| A | 7567 | 6228 | 2 | 2 | 0.03% | 0.03% | 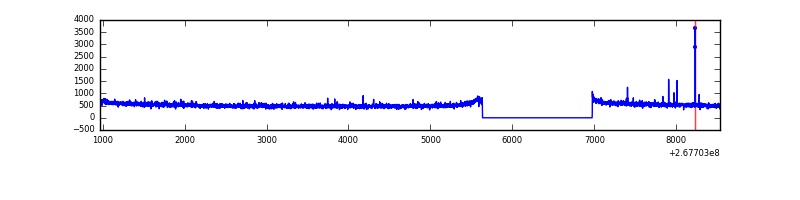 |
| B | 7567 | 6228 | 16 | 16 | 0.21% | 0.26% | 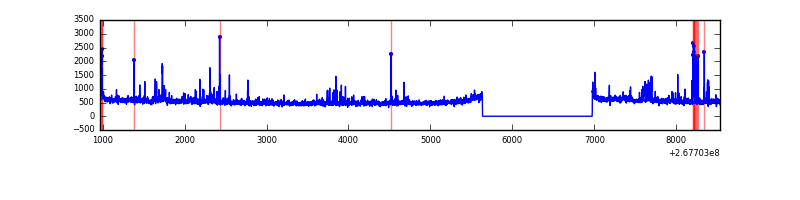 |
| C | 7567 | 6228 | 0 | 0 | 0.00% | 0.00% | 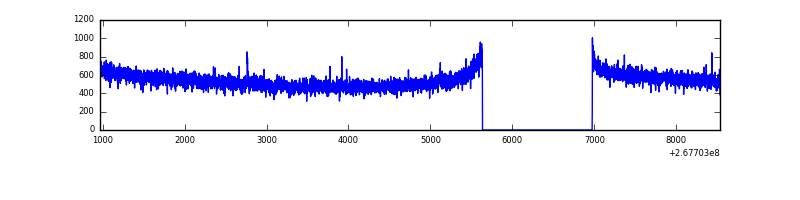 |
| D | 7567 | 6228 | 32 | 32 | 0.42% | 0.51% | 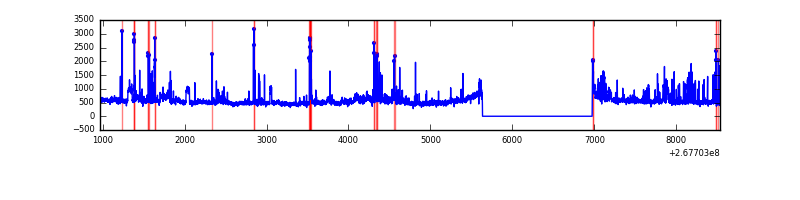 |
Top three noisy pixels from each quadrant. If the there are fewer than three noisy pixels in the level2.evt file, extra rows are filled as -1
| Pixel properties | Quadrant properties | ||||||
|---|---|---|---|---|---|---|---|
| Quadrant | DetID | PixID | Counts | Sigma | Mean | Median | Sigma |
| A | 12 | 189 | 37459 | 224.56 | 823 | 806 | 163.2 |
| A | 9 | 143 | 24599 | 145.77 | 823 | 806 | 163.2 |
| A | 0 | 226 | 7434 | 40.61 | 823 | 806 | 163.2 |
| B | 3 | 64 | 103790 | 695.46 | 806 | 789 | 148.1 |
| B | 0 | 229 | 47975 | 318.6 | 806 | 789 | 148.1 |
| B | 0 | 189 | 47179 | 313.22 | 806 | 789 | 148.1 |
| C | 3 | 233 | 283557 | 1588.72 | 784 | 791 | 178.0 |
| C | 13 | 61 | 5728 | 27.74 | 784 | 791 | 178.0 |
| C | 8 | 128 | 4883 | 22.99 | 784 | 791 | 178.0 |
| D | 13 | 104 | 315464 | 1519.27 | 790 | 774 | 207.1 |
| D | 12 | 110 | 239338 | 1151.75 | 790 | 774 | 207.1 |
| D | 13 | 249 | 96005 | 459.76 | 790 | 774 | 207.1 |
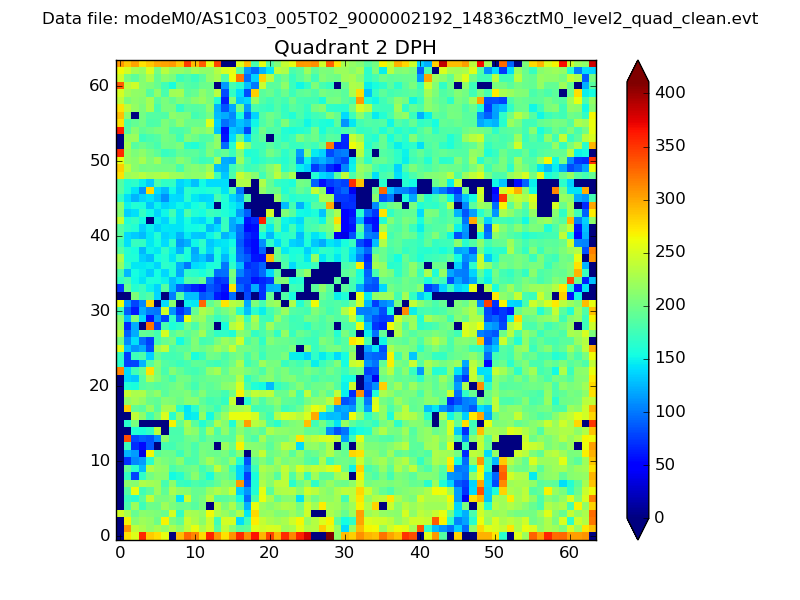
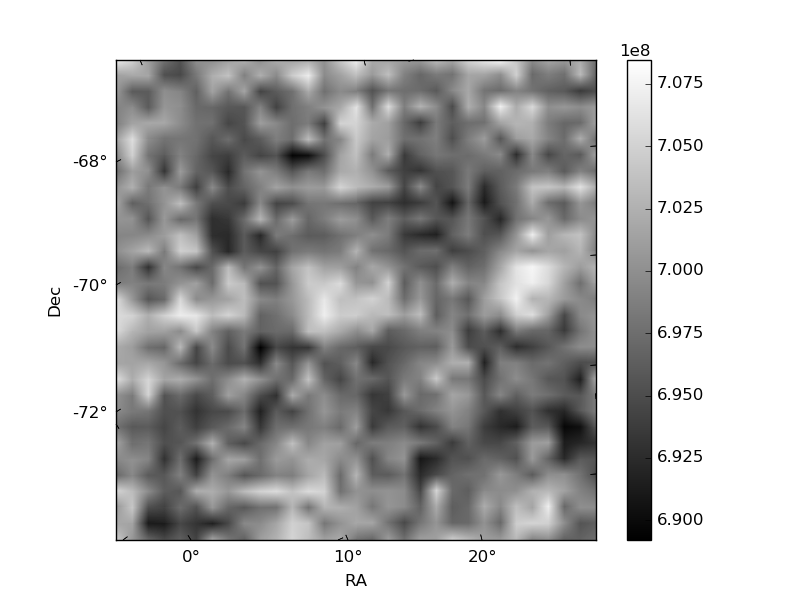
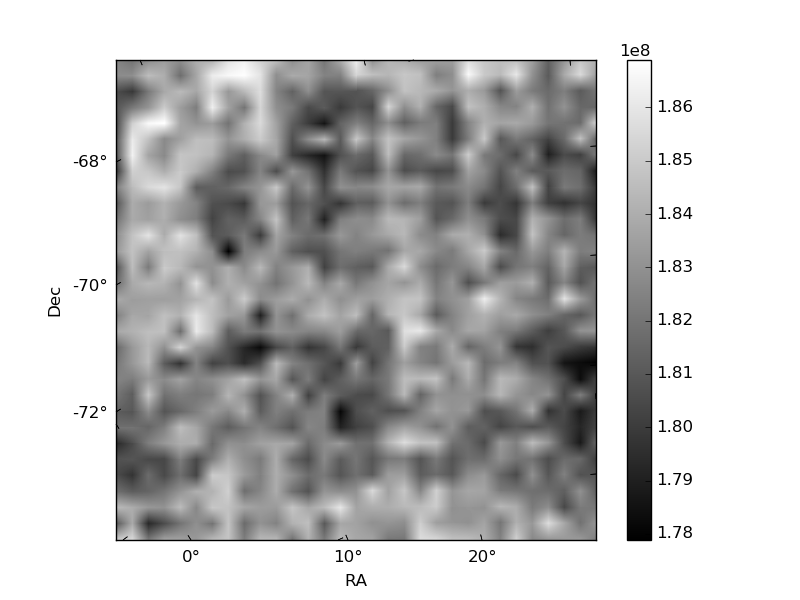
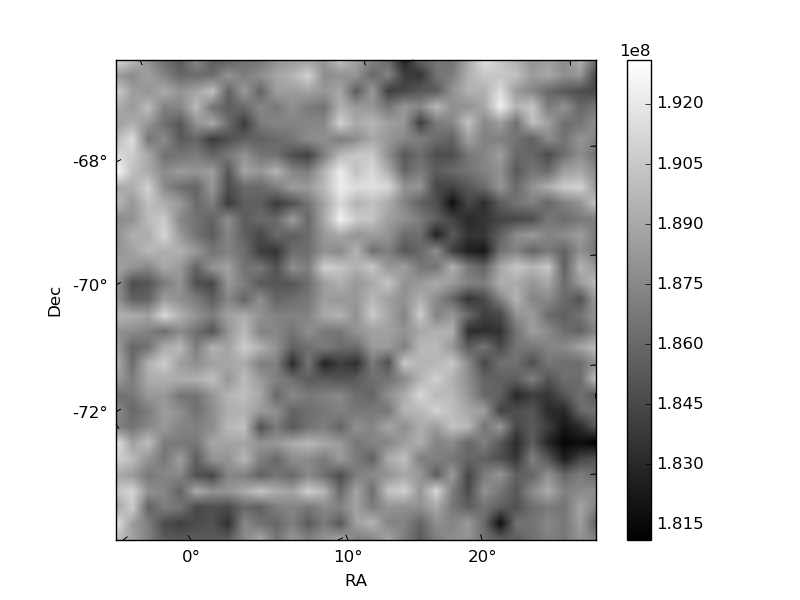
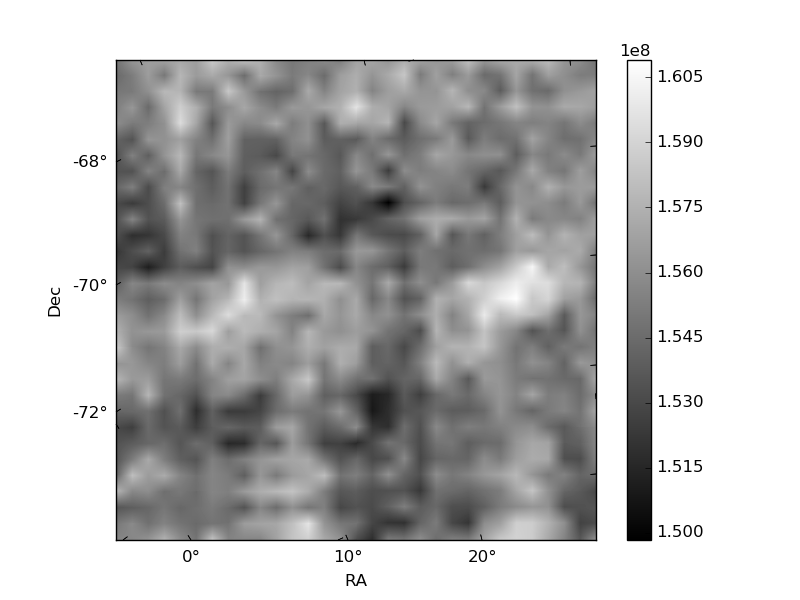
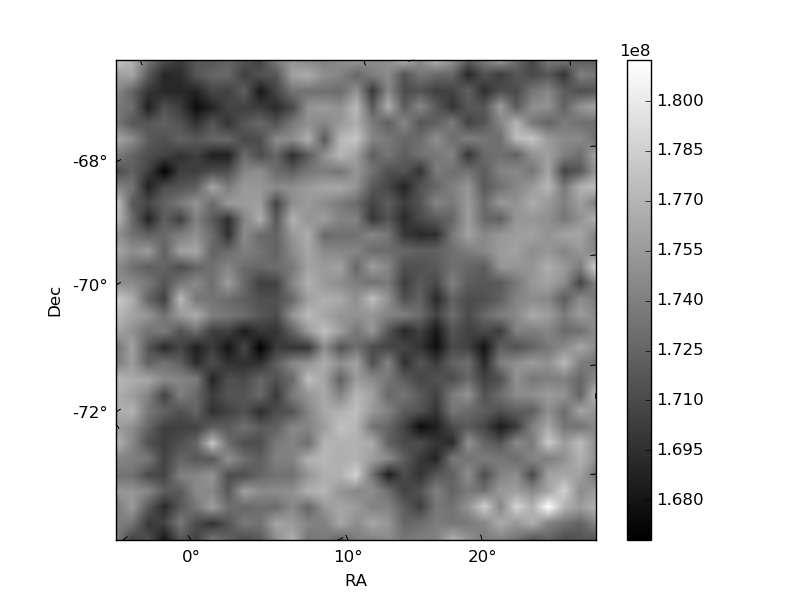
Histogram calculated using DETX and DETY for each event in the final _common_clean file
| Quadrant A | 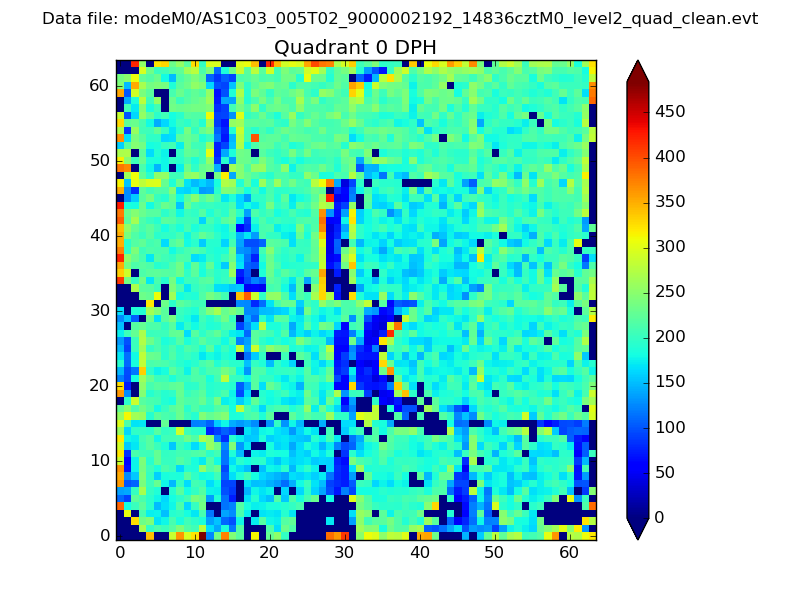 |
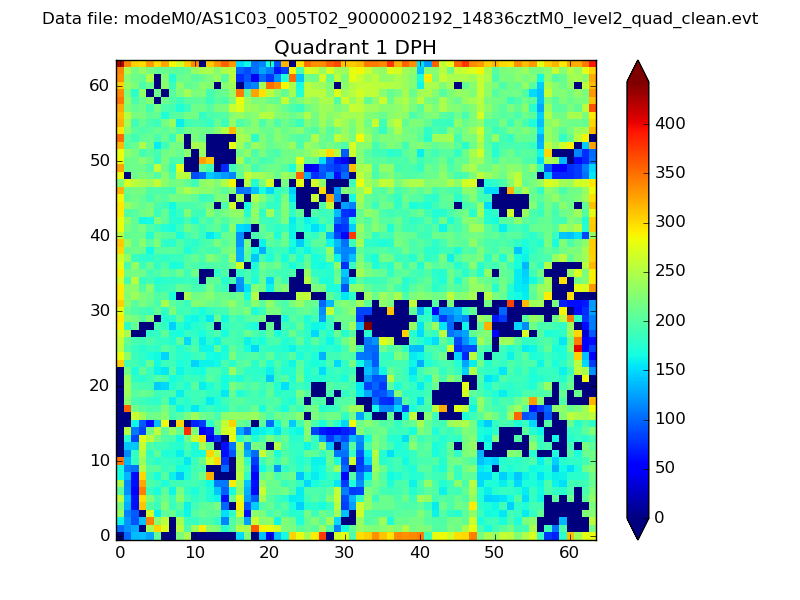 |
Quadrant B |
|---|---|---|---|
| Quadrant D | 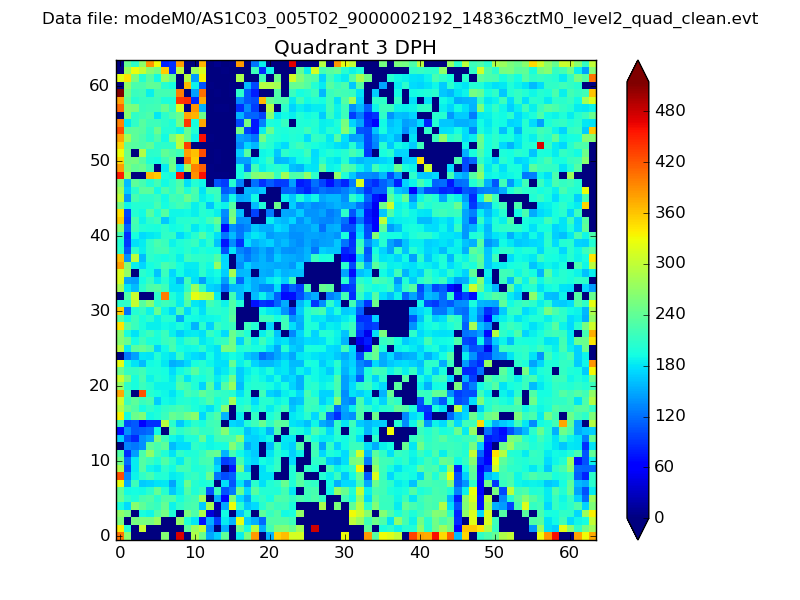 |
 |
Quadrant C |
| Plot type | Count rate plots | Images |
|---|---|---|
| Comparison with Poisson distribution Blue bars denote a histogram of data divided into 1 sec bins. Red curve is a Poisson curve with rate = median count rate of data. |
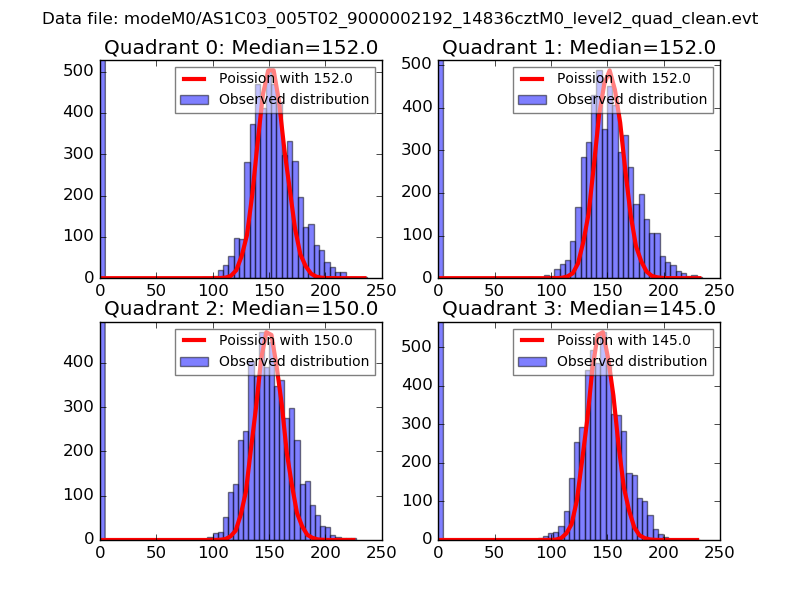 |
 |
| Quadrant-wise count rates Data is divided into 100 sec bins |
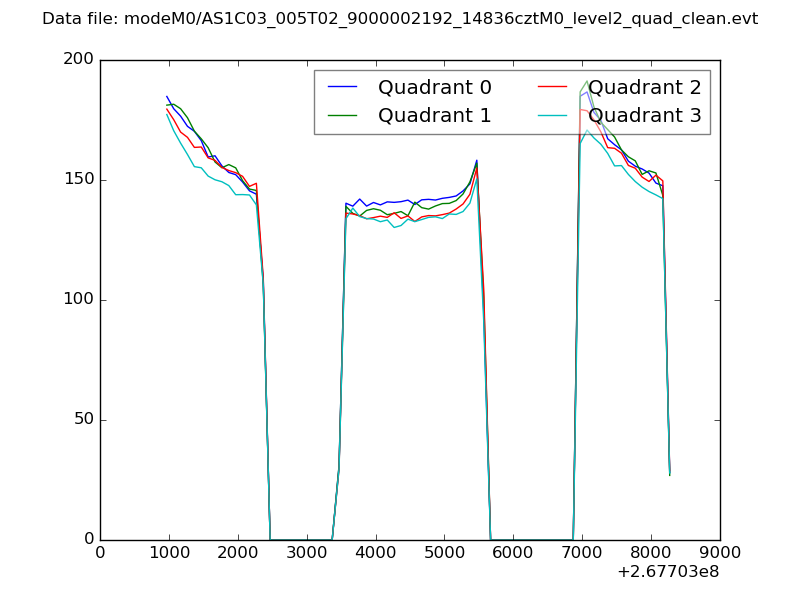 |
|
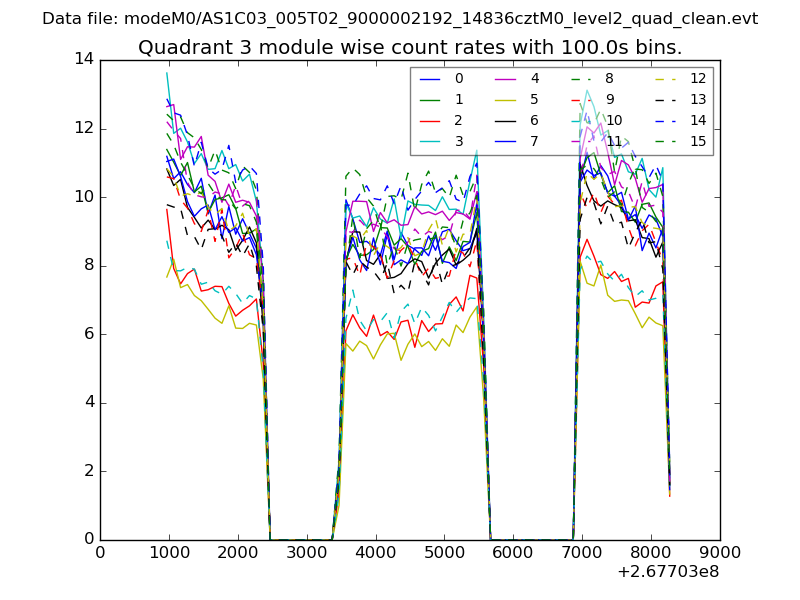
| Module-wise count rates for Quadrant A Data is divided into 100 sec bins |
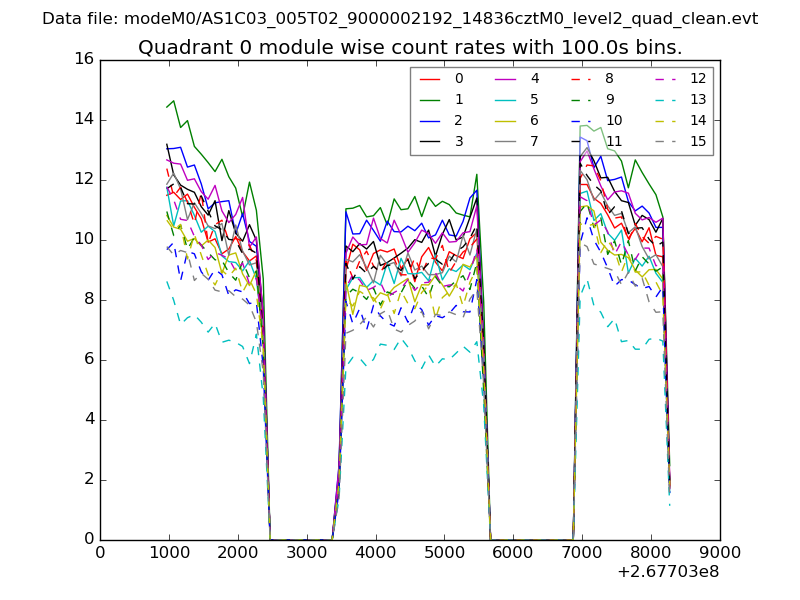 |
 |
| Module-wise count rates for Quadrant B Data is divided into 100 sec bins |
 |
 |
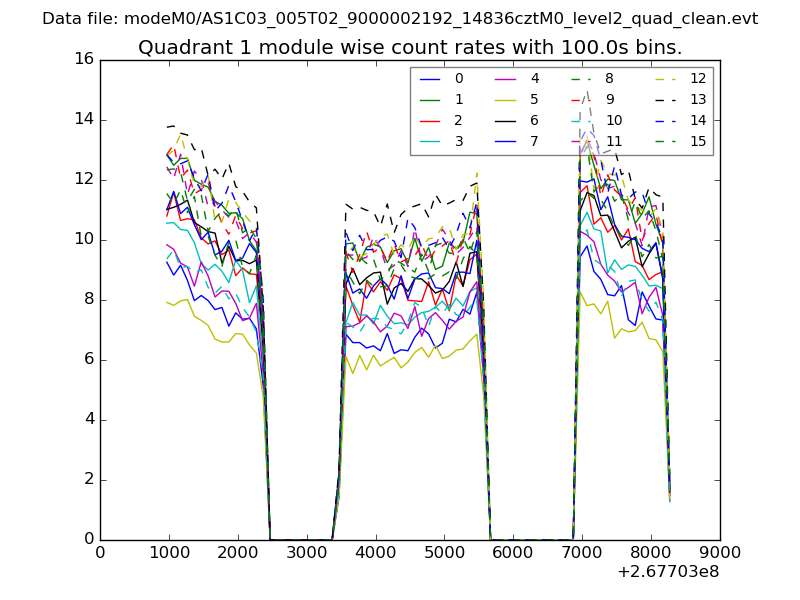
| Module-wise count rates for Quadrant C Data is divided into 100 sec bins |
 |
 |
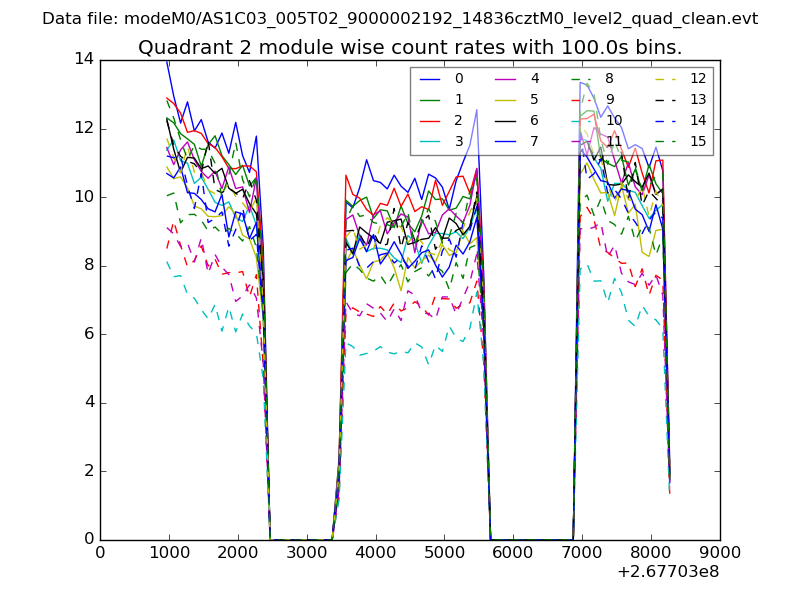
| Module-wise count rates for Quadrant D Data is divided into 100 sec bins |
 |
 |
| Parameter | Plot |
|---|---|
| CZT HV Monitor | 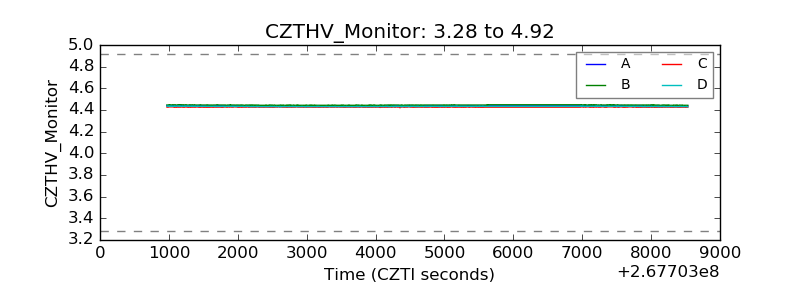 |
| D_VDD | 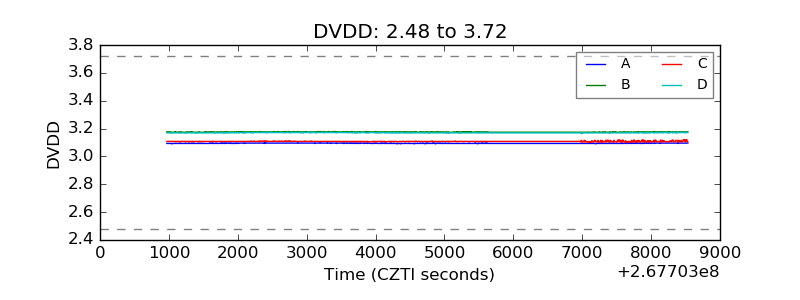 |
| Temperature 1 | 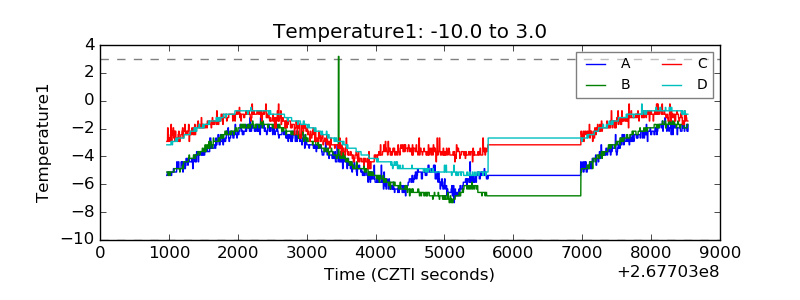 |
| Veto HV Monitor | 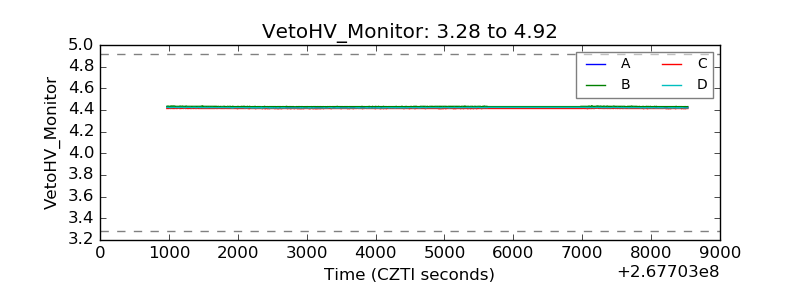 |
| Veto LLD | 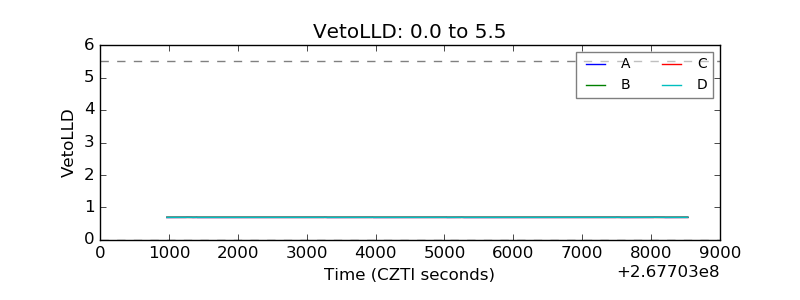 |
| Alpha Counter | 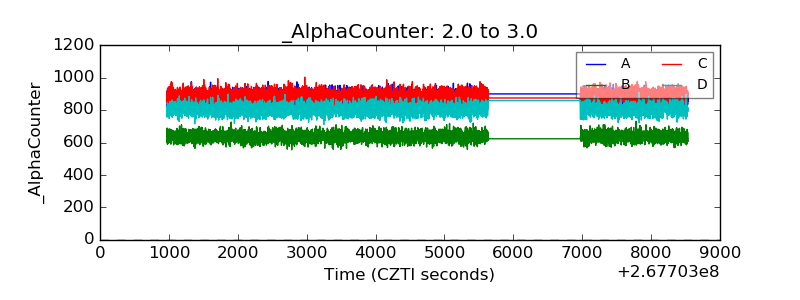 |
| _CPM_Rate | 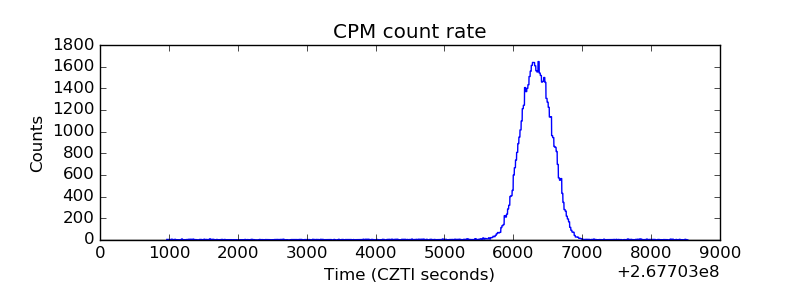 |
| CZT Counter | 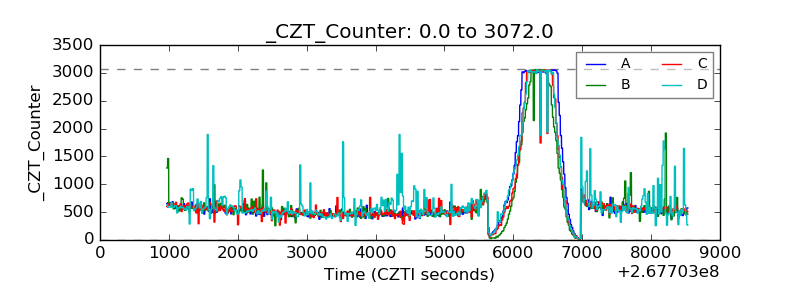 |
| +2.5 Volts monitor |  |
| +5 Volts monitor |  |
| _ROLL_ROT | 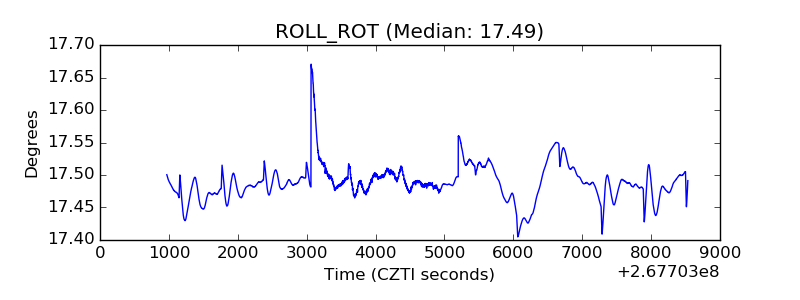 |
| _Roll_DEC | 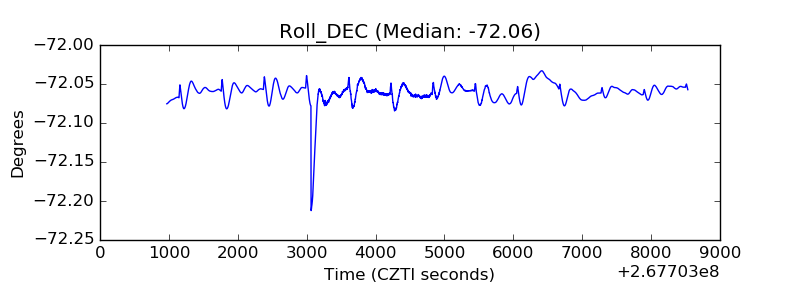 |
| _Roll_RA | 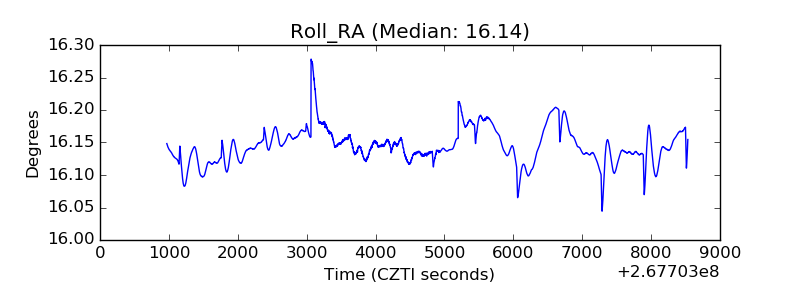 |
| Veto Counter | 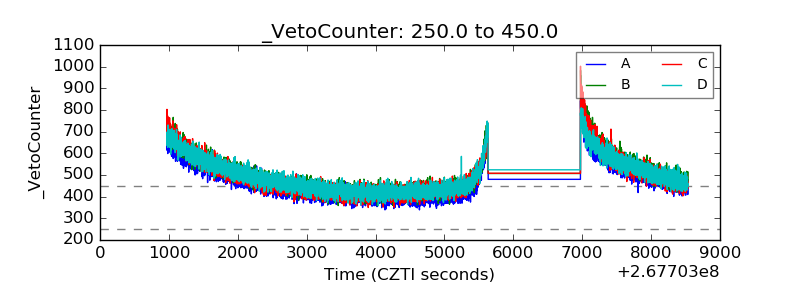 |