| Param | Original file | Final file |
|---|---|---|
| Filename | modeM0/AS1C03_005T02_9000002192_14838cztM0_level2.evt | modeM0/AS1C03_005T02_9000002192_14838cztM0_level2_quad_clean.evt |
| Size (bytes) | 449,631,360 | 92,957,760 |
| Size | 428.8 MB | 88.7 MB |
| Events in quadrant A | 3,176,353 | 603,391 |
| Events in quadrant B | 3,437,658 | 597,893 |
| Events in quadrant C | 3,247,440 | 590,246 |
| Events in quadrant D | 3,323,417 | 579,901 |
| Mode M0 | |||
|---|---|---|---|
| Quadrant | BADHDUFLAG | Total packets | Discarded packets |
| A | 0 | 13433 | 2 |
| B | 0 | 14171 | 1 |
| C | 0 | 13290 | 1 |
| D | 0 | 14192 | 1 |
| Mode SS | |||
|---|---|---|---|
| Quadrant | BADHDUFLAG | Total packets | Discarded packets |
| A | 0 | 128 | 0 |
| B | 0 | 128 | 0 |
| C | 0 | 128 | 0 |
| D | 0 | 128 | 0 |
| Mode M9 | |||
|---|---|---|---|
| Quadrant | BADHDUFLAG | Total packets | Discarded packets |
| A | 0 | 11 | 0 |
| B | 0 | 11 | 0 |
| C | 0 | 11 | 0 |
| D | 0 | 11 | 0 |
| Quadrant | Total seconds | Saturated seconds | Saturation percentage |
|---|---|---|---|
| A | 6364 | 93 | 1.461345% |
| B | 6364 | 120 | 1.885607% |
| C | 6364 | 66 | 1.037084% |
| D | 6364 | 170 | 2.671276% |
Noise dominated data is calculated using 1-second bins in cleaned event files. If a bin has >2000 counts, and if more than 50% of those come from <1% of pixels, then it is considered to be noise-dominated and hence unusable.
| Quadrant | # 1 sec bins | Bins with >0 counts | Bins with >2000 counts | High rate bins dominated by noise | Noise dominated (total time) | Noise dominated (detector-on time) | Marked lightcurve |
|---|---|---|---|---|---|---|---|
| A | 7420 | 6366 | 2 | 2 | 0.03% | 0.03% | 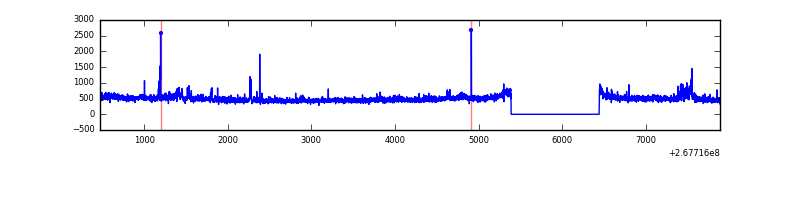 |
| B | 7420 | 6366 | 18 | 18 | 0.24% | 0.28% | 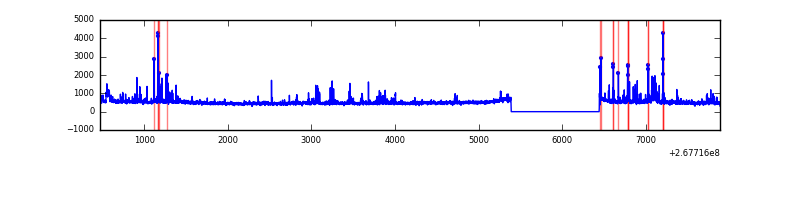 |
| C | 7420 | 6366 | 0 | 0 | 0.00% | 0.00% | 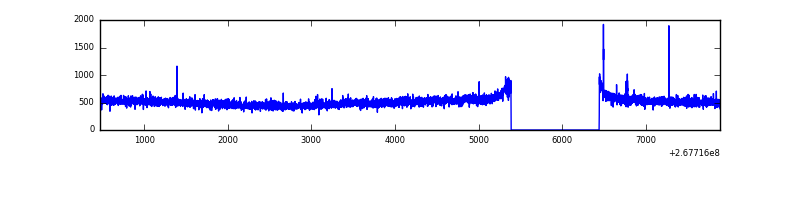 |
| D | 7420 | 6366 | 97 | 97 | 1.31% | 1.52% | 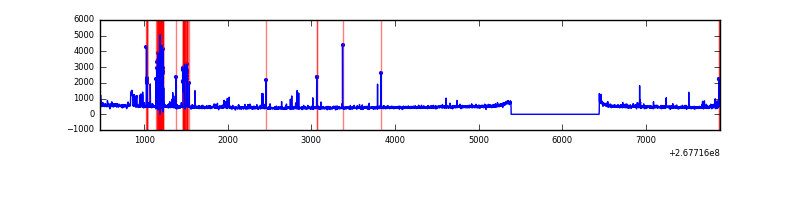 |
Top three noisy pixels from each quadrant. If the there are fewer than three noisy pixels in the level2.evt file, extra rows are filled as -1
| Pixel properties | Quadrant properties | ||||||
|---|---|---|---|---|---|---|---|
| Quadrant | DetID | PixID | Counts | Sigma | Mean | Median | Sigma |
| A | 12 | 189 | 98075 | 625.27 | 782 | 766 | 155.6 |
| A | 13 | 248 | 54806 | 347.24 | 782 | 766 | 155.6 |
| A | 9 | 143 | 13020 | 78.74 | 782 | 766 | 155.6 |
| B | 3 | 64 | 140448 | 975.84 | 772 | 753 | 143.2 |
| B | 0 | 229 | 79767 | 551.95 | 772 | 753 | 143.2 |
| B | 0 | 189 | 47669 | 327.73 | 772 | 753 | 143.2 |
| C | 3 | 233 | 309221 | 1802.63 | 751 | 756 | 171.1 |
| C | 9 | 54 | 7819 | 41.28 | 751 | 756 | 171.1 |
| C | 13 | 61 | 5527 | 27.88 | 751 | 756 | 171.1 |
| D | 7 | 254 | 317479 | 1622.2 | 746 | 730 | 195.3 |
| D | 13 | 104 | 71561 | 362.75 | 746 | 730 | 195.3 |
| D | 2 | 120 | 28093 | 140.14 | 746 | 730 | 195.3 |
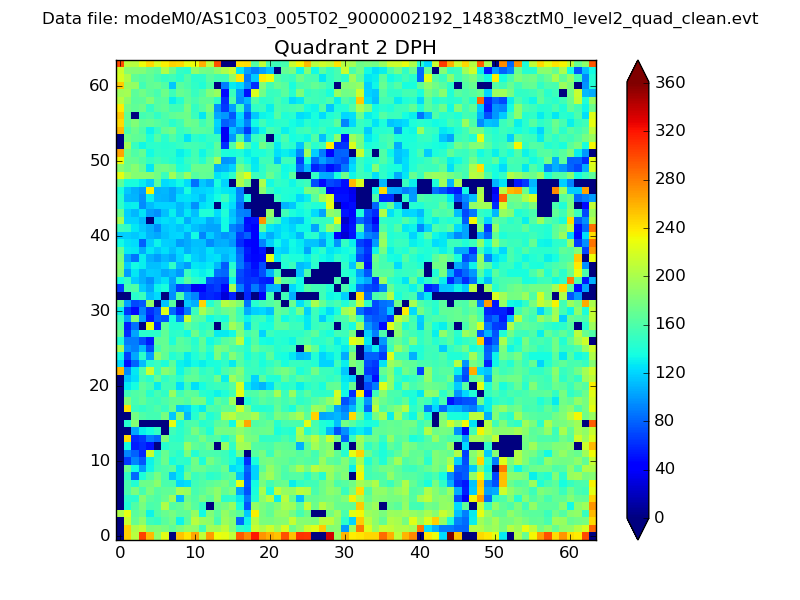
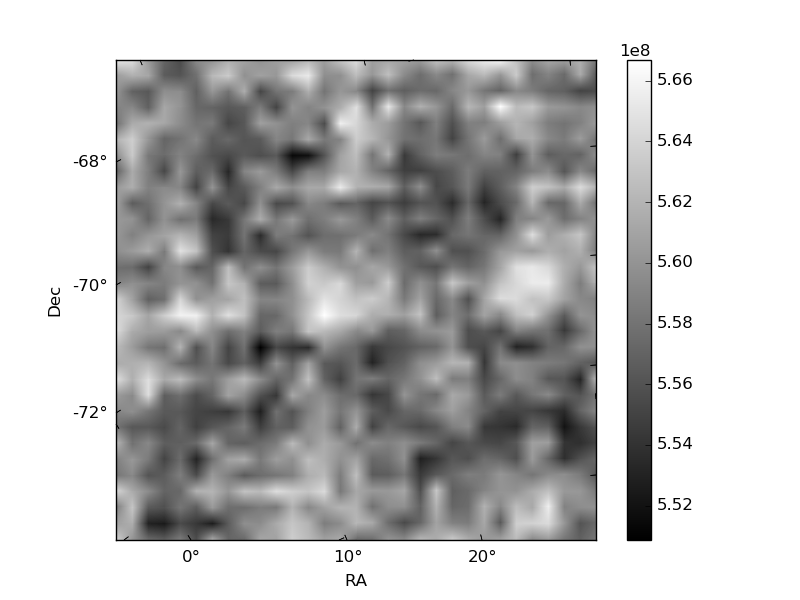
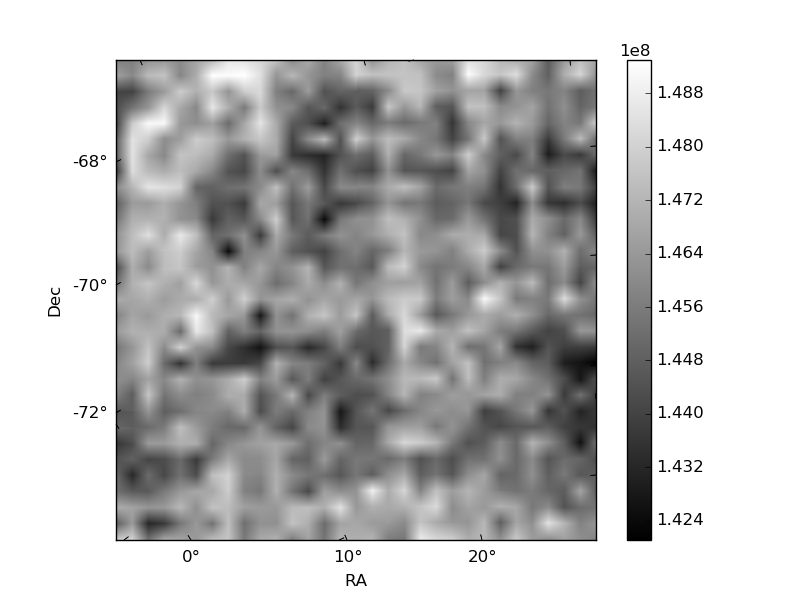
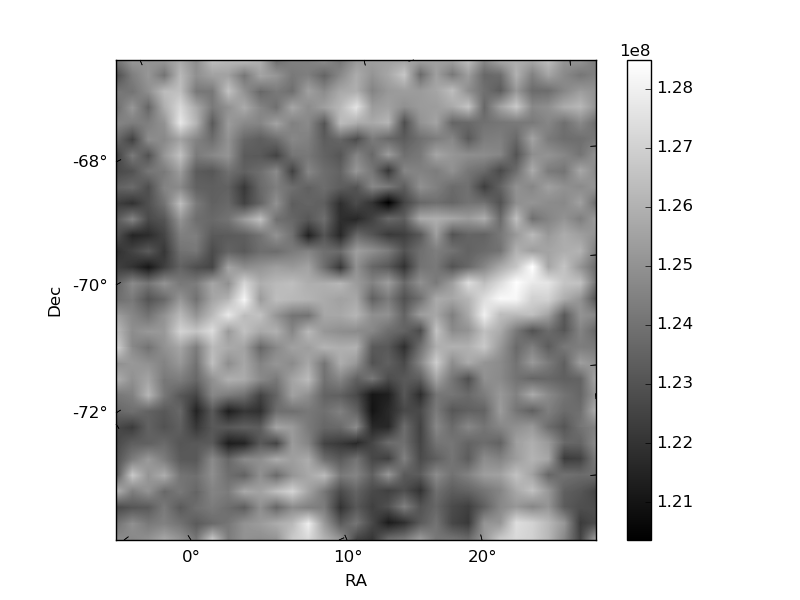
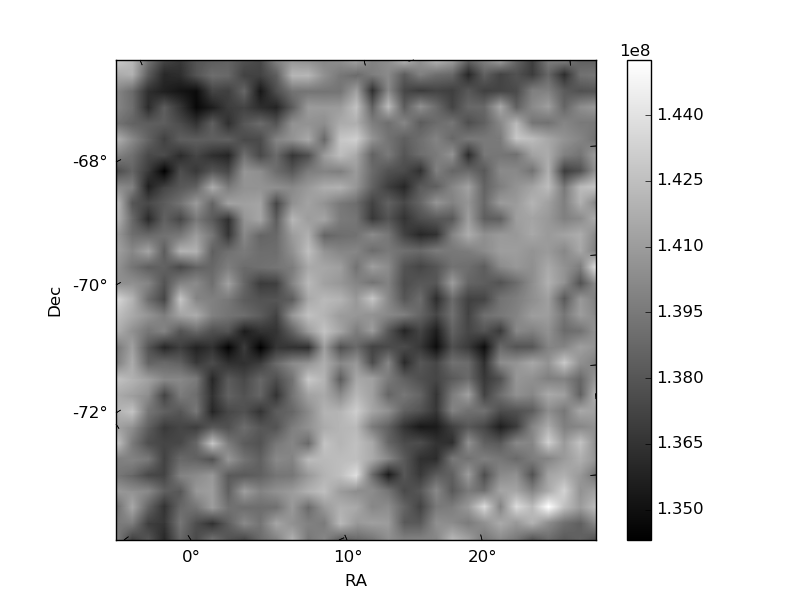
Histogram calculated using DETX and DETY for each event in the final _common_clean file
| Quadrant A | 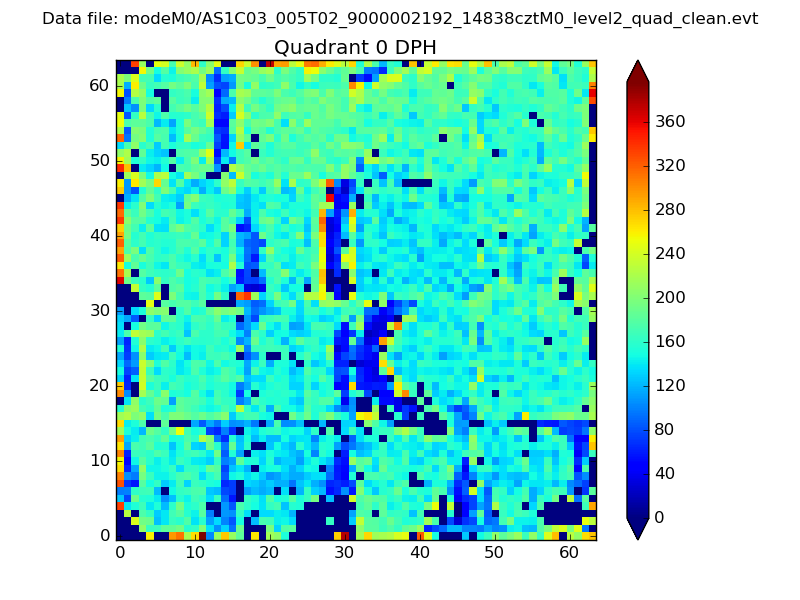 |
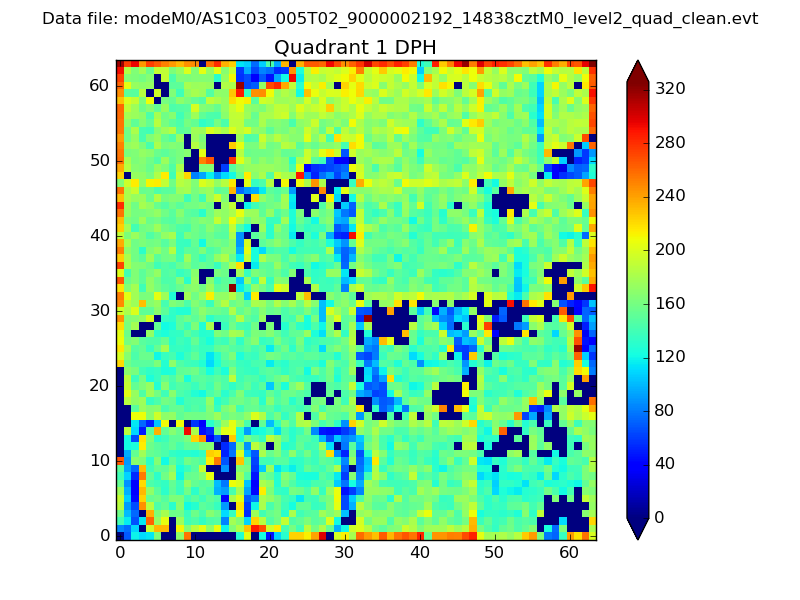 |
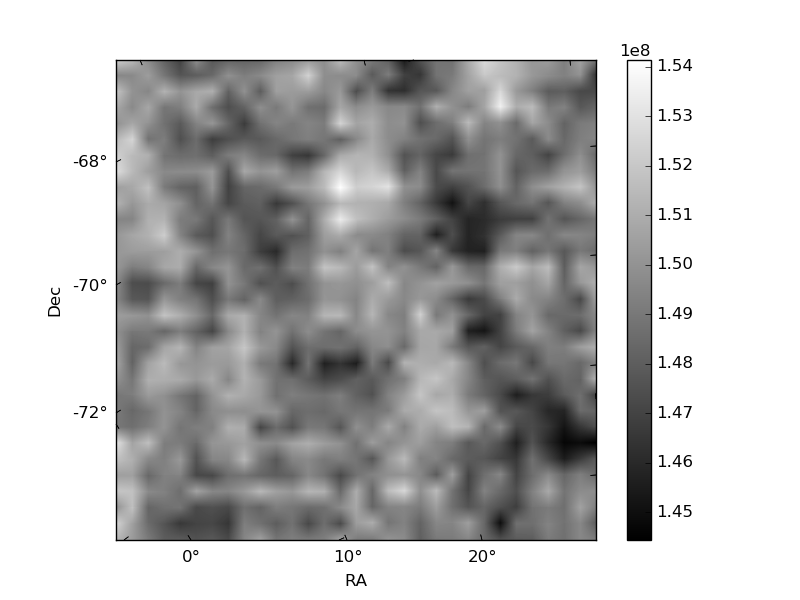
Quadrant B |
|---|---|---|---|
| Quadrant D | 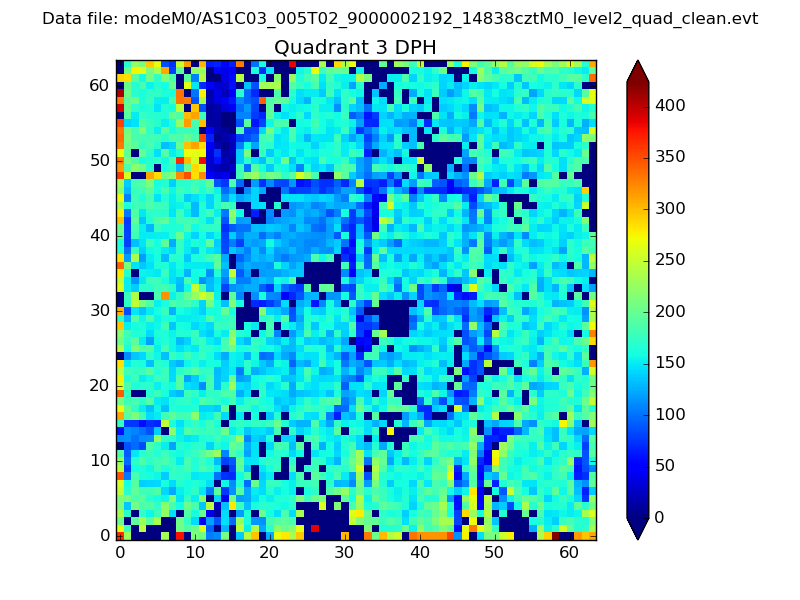 |
 |
Quadrant C |
| Plot type | Count rate plots | Images |
|---|---|---|
| Comparison with Poisson distribution Blue bars denote a histogram of data divided into 1 sec bins. Red curve is a Poisson curve with rate = median count rate of data. |
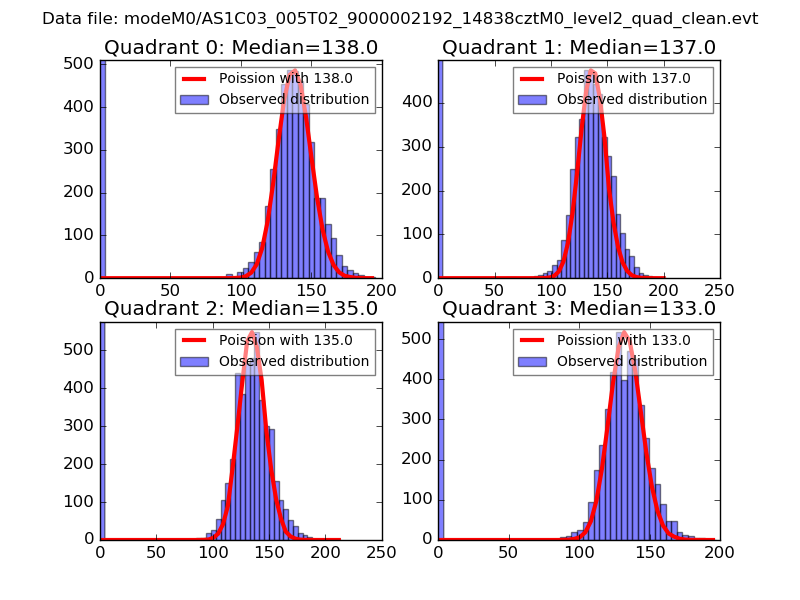 |
 |
| Quadrant-wise count rates Data is divided into 100 sec bins |
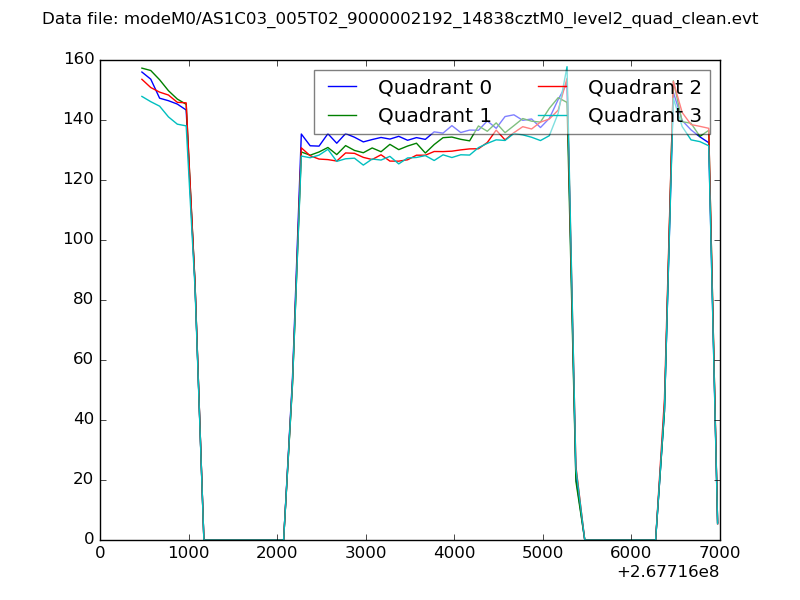 |
|
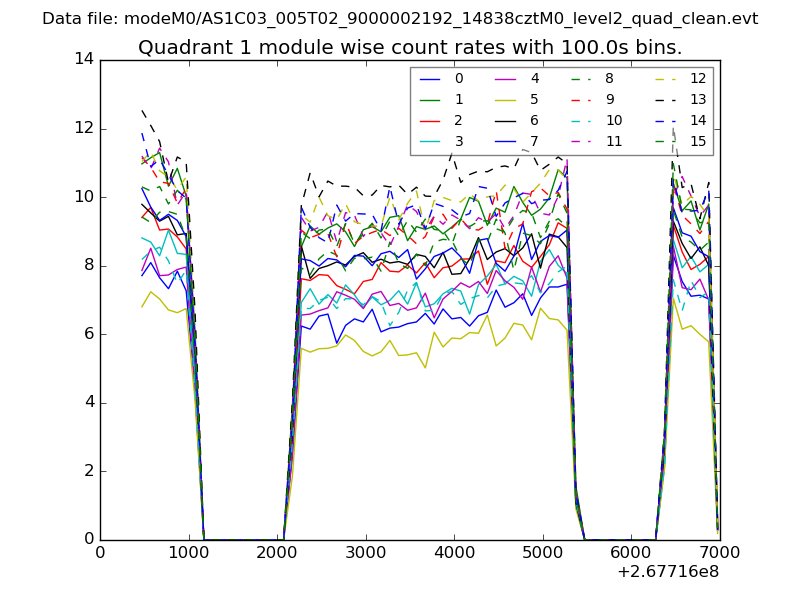
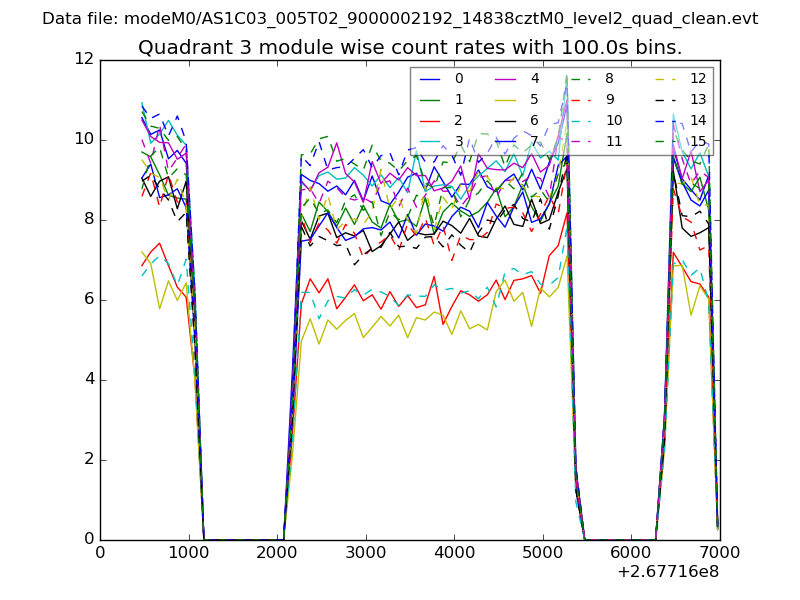
| Module-wise count rates for Quadrant A Data is divided into 100 sec bins |
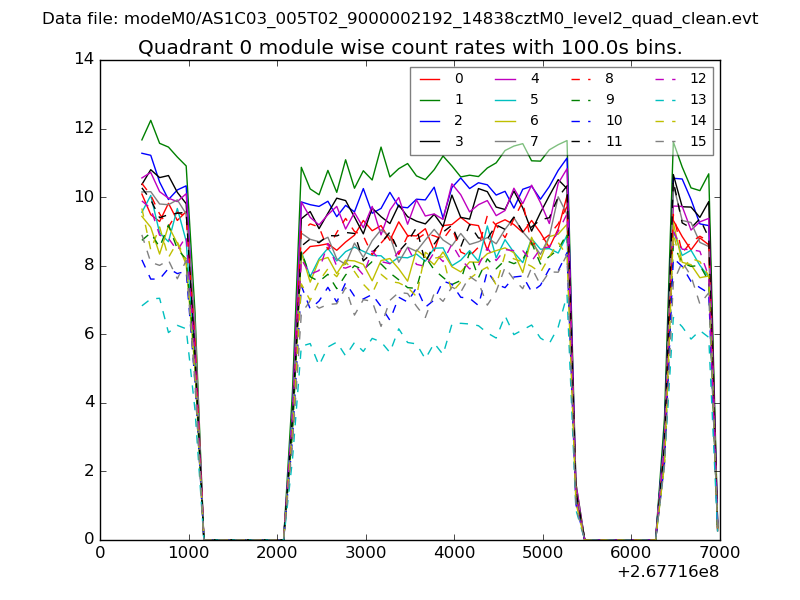 |
 |
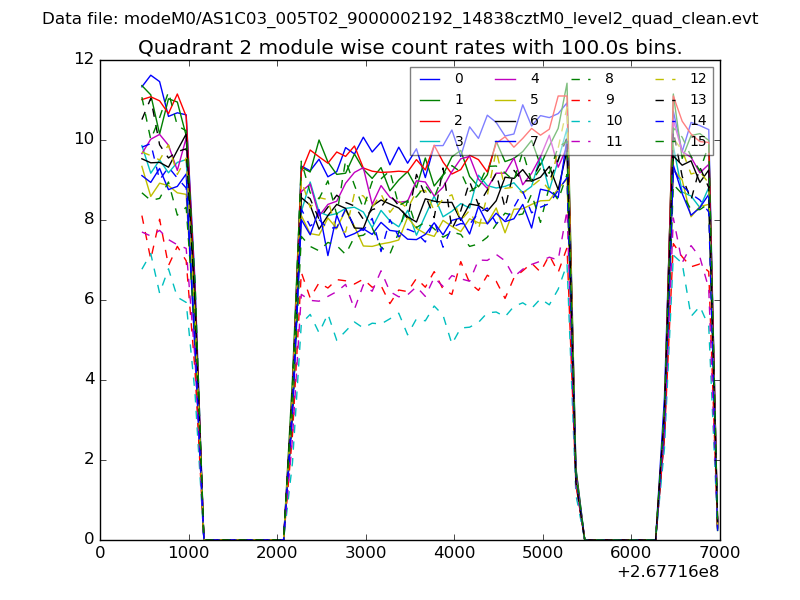
| Module-wise count rates for Quadrant B Data is divided into 100 sec bins |
 |
 |
| Module-wise count rates for Quadrant C Data is divided into 100 sec bins |
 |
 |
| Module-wise count rates for Quadrant D Data is divided into 100 sec bins |
 |
 |
| Parameter | Plot |
|---|---|
| CZT HV Monitor | 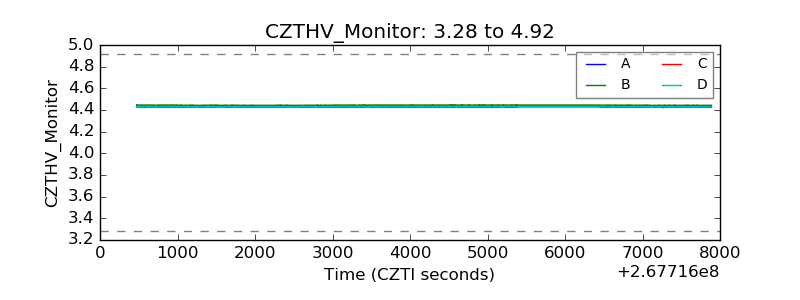 |
| D_VDD | 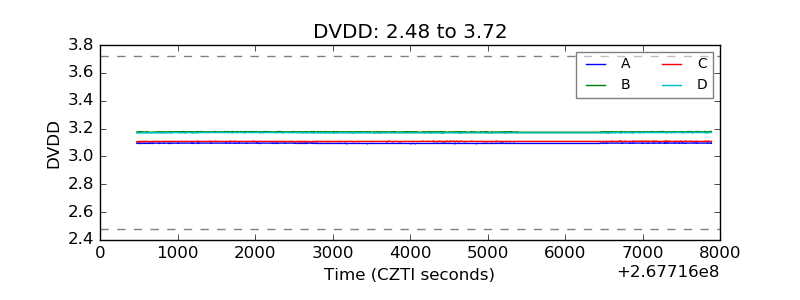 |
| Temperature 1 | 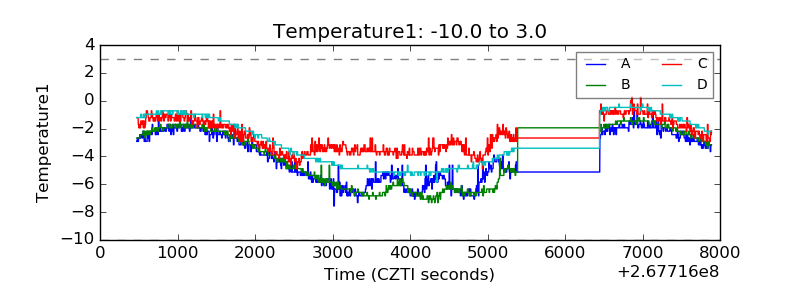 |
| Veto HV Monitor | 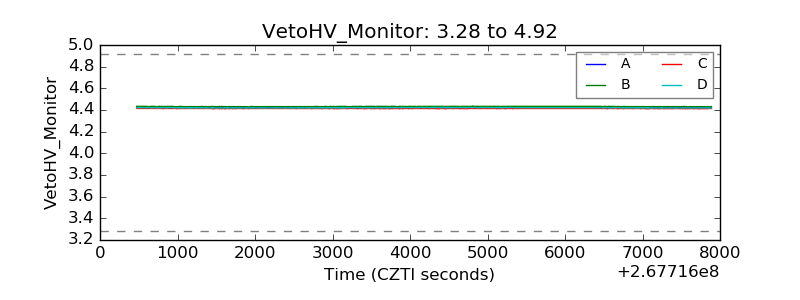 |
| Veto LLD | 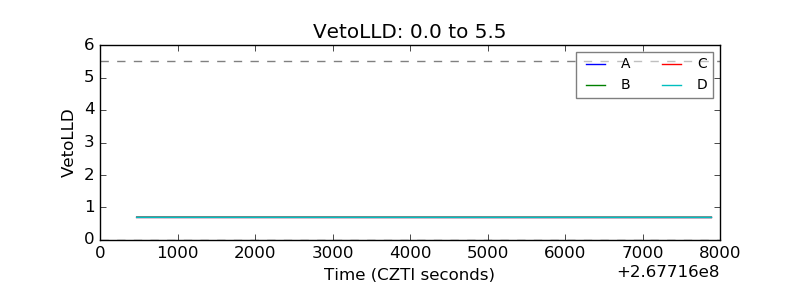 |
| Alpha Counter | 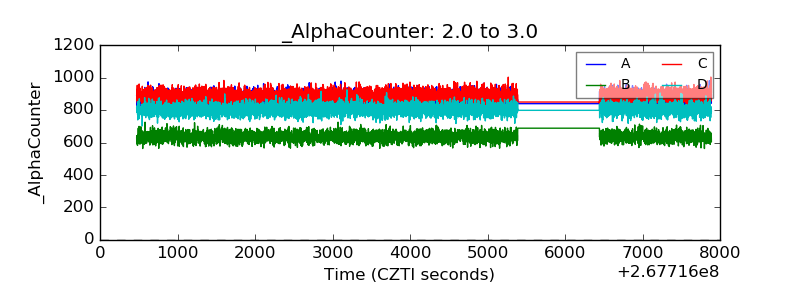 |
| _CPM_Rate | 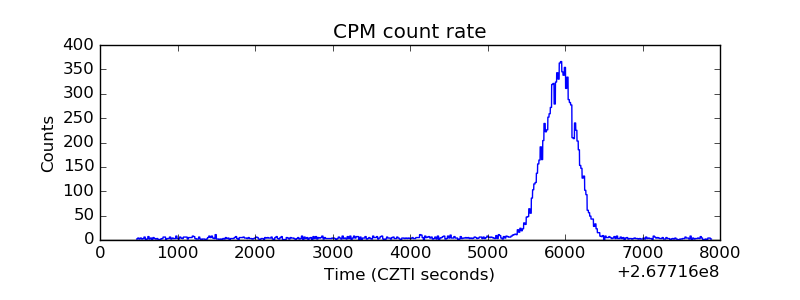 |
| CZT Counter | 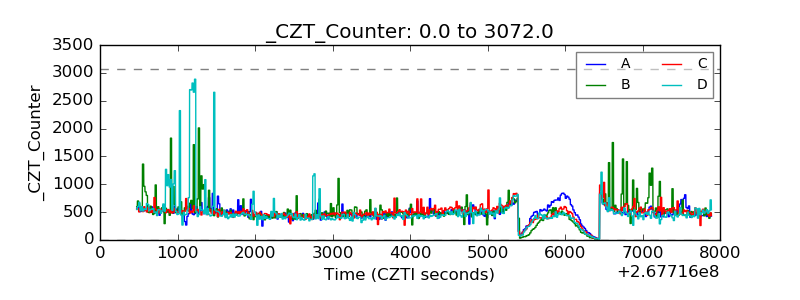 |
| +2.5 Volts monitor |  |
| +5 Volts monitor |  |
| _ROLL_ROT | 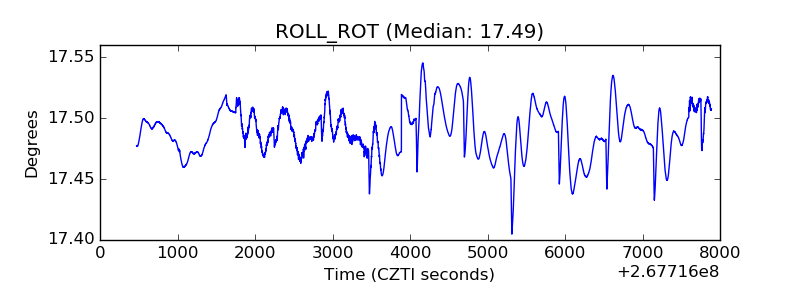 |
| _Roll_DEC | 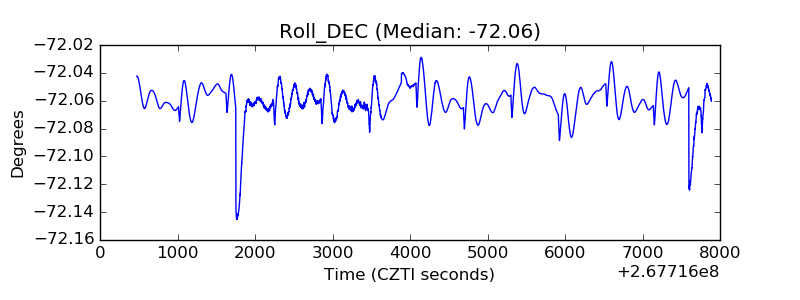 |
| _Roll_RA | 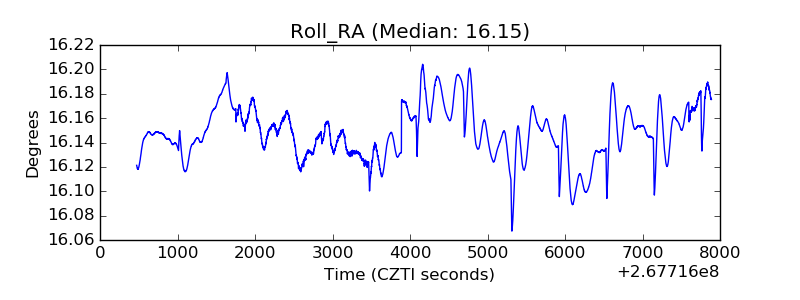 |
| Veto Counter | 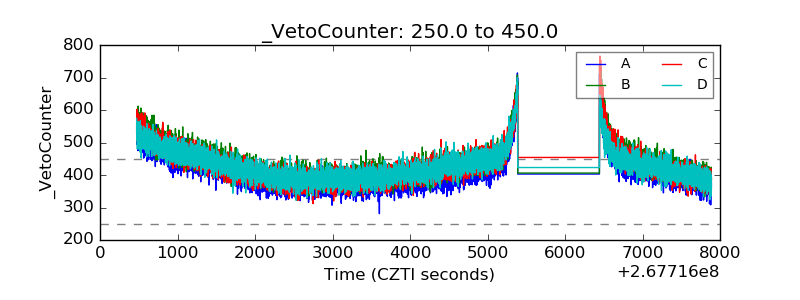 |