| Param | Original file | Final file |
|---|---|---|
| Filename | modeM0/AS1C03_005T02_9000002192_14839cztM0_level2.evt | modeM0/AS1C03_005T02_9000002192_14839cztM0_level2_quad_clean.evt |
| Size (bytes) | 456,027,840 | 91,828,800 |
| Size | 434.9 MB | 87.6 MB |
| Events in quadrant A | 3,181,980 | 588,894 |
| Events in quadrant B | 3,562,598 | 582,454 |
| Events in quadrant C | 3,369,236 | 578,650 |
| Events in quadrant D | 3,242,104 | 564,419 |
| Mode M0 | |||
|---|---|---|---|
| Quadrant | BADHDUFLAG | Total packets | Discarded packets |
| A | 0 | 13883 | 2 |
| B | 0 | 14872 | 1 |
| C | 0 | 13929 | 1 |
| D | 0 | 14158 | 1 |
| Mode SS | |||
|---|---|---|---|
| Quadrant | BADHDUFLAG | Total packets | Discarded packets |
| A | 0 | 136 | 0 |
| B | 0 | 136 | 0 |
| C | 0 | 136 | 0 |
| D | 0 | 136 | 0 |
| Mode M9 | |||
|---|---|---|---|
| Quadrant | BADHDUFLAG | Total packets | Discarded packets |
| A | 0 | 7 | 0 |
| B | 0 | 7 | 0 |
| C | 0 | 7 | 0 |
| D | 0 | 7 | 0 |
| Quadrant | Total seconds | Saturated seconds | Saturation percentage |
|---|---|---|---|
| A | 6692 | 71 | 1.060968% |
| B | 6692 | 120 | 1.793186% |
| C | 6692 | 41 | 0.612672% |
| D | 6692 | 51 | 0.762104% |
Noise dominated data is calculated using 1-second bins in cleaned event files. If a bin has >2000 counts, and if more than 50% of those come from <1% of pixels, then it is considered to be noise-dominated and hence unusable.
| Quadrant | # 1 sec bins | Bins with >0 counts | Bins with >2000 counts | High rate bins dominated by noise | Noise dominated (total time) | Noise dominated (detector-on time) | Marked lightcurve |
|---|---|---|---|---|---|---|---|
| A | 7378 | 6694 | 0 | 0 | 0.00% | 0.00% | 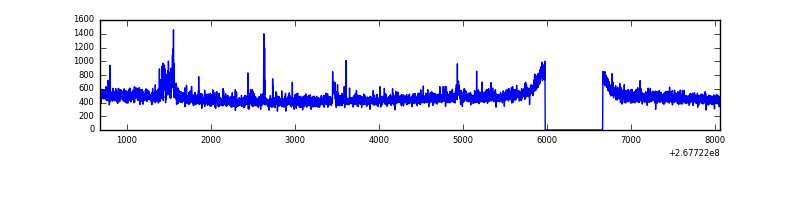 |
| B | 7378 | 6694 | 26 | 26 | 0.35% | 0.39% | 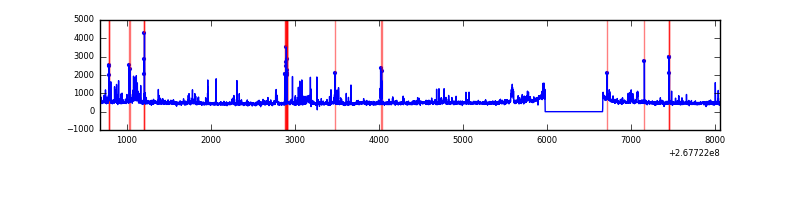 |
| C | 7378 | 6694 | 0 | 0 | 0.00% | 0.00% | 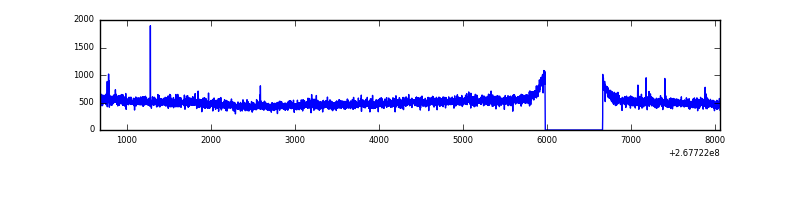 |
| D | 7378 | 6694 | 6 | 6 | 0.08% | 0.09% | 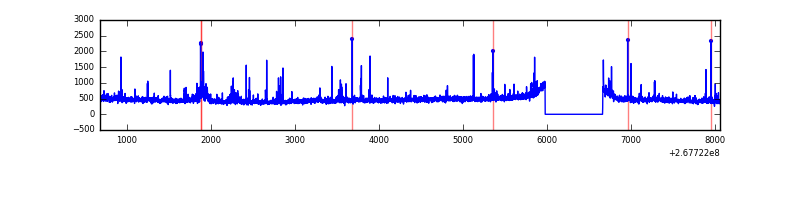 |
Top three noisy pixels from each quadrant. If the there are fewer than three noisy pixels in the level2.evt file, extra rows are filled as -1
| Pixel properties | Quadrant properties | ||||||
|---|---|---|---|---|---|---|---|
| Quadrant | DetID | PixID | Counts | Sigma | Mean | Median | Sigma |
| A | 12 | 189 | 42926 | 260.36 | 801 | 787 | 161.9 |
| A | 13 | 248 | 40153 | 243.22 | 801 | 787 | 161.9 |
| A | 9 | 143 | 8955 | 50.47 | 801 | 787 | 161.9 |
| B | 3 | 64 | 168756 | 1126.95 | 791 | 770 | 149.1 |
| B | 0 | 189 | 73342 | 486.86 | 791 | 770 | 149.1 |
| B | 0 | 229 | 72492 | 481.15 | 791 | 770 | 149.1 |
| C | 3 | 233 | 345250 | 1970.49 | 770 | 775 | 174.8 |
| C | 15 | 176 | 10053 | 53.07 | 770 | 775 | 174.8 |
| C | 7 | 247 | 6770 | 34.29 | 770 | 775 | 174.8 |
| D | 7 | 254 | 159026 | 835.12 | 779 | 759 | 189.5 |
| D | 7 | 38 | 36858 | 190.48 | 779 | 759 | 189.5 |
| D | 2 | 234 | 25308 | 129.54 | 779 | 759 | 189.5 |
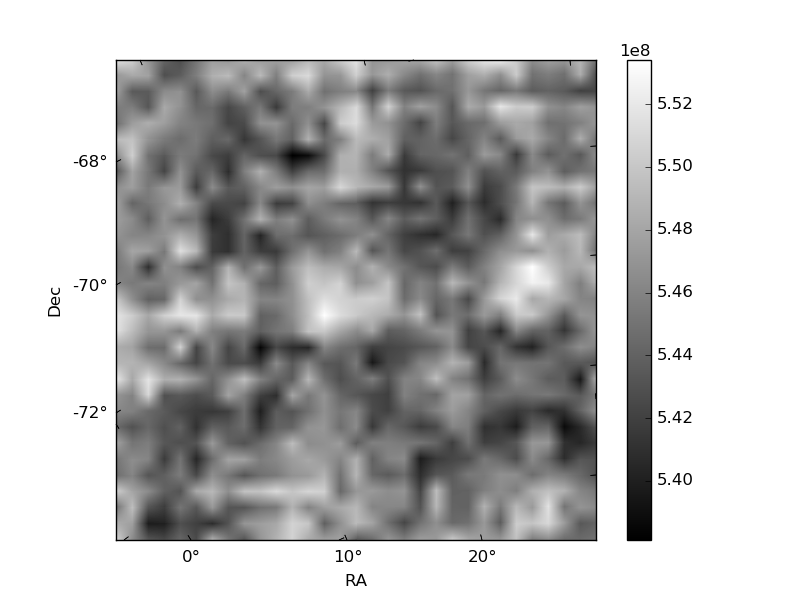
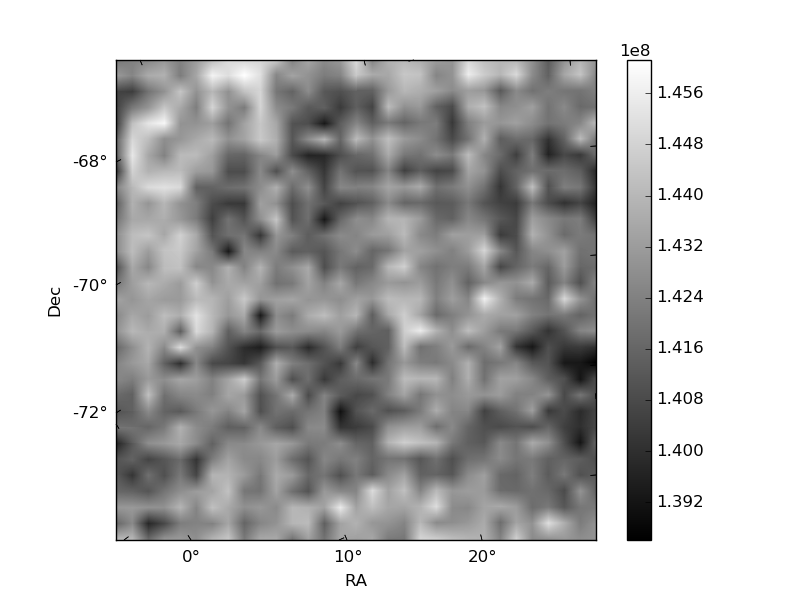
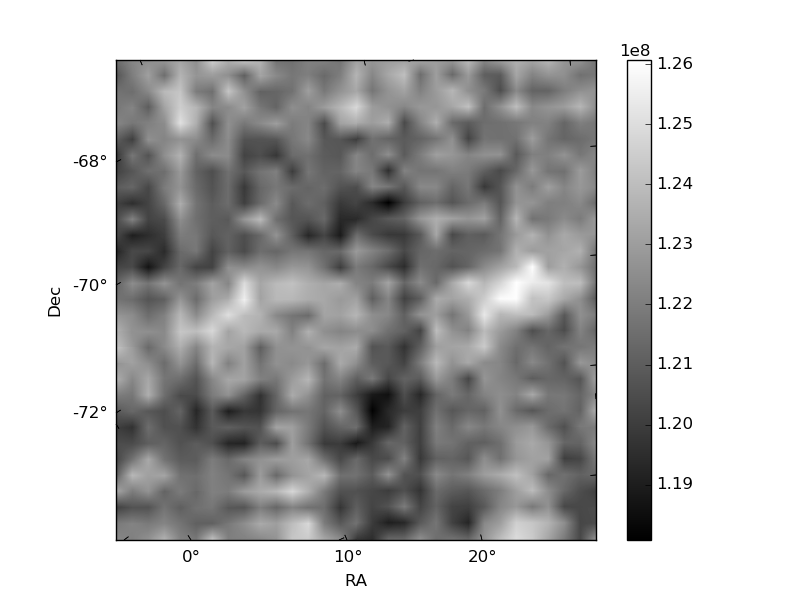
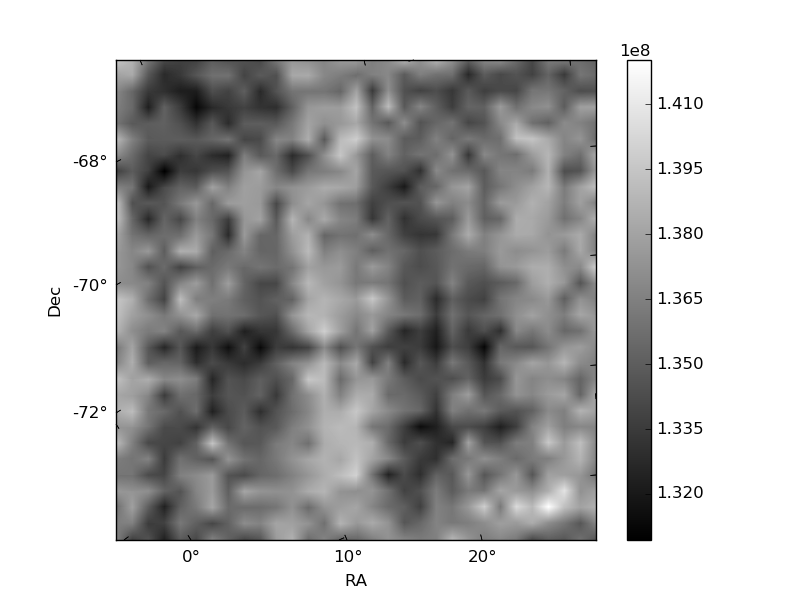
Histogram calculated using DETX and DETY for each event in the final _common_clean file
| Quadrant A | 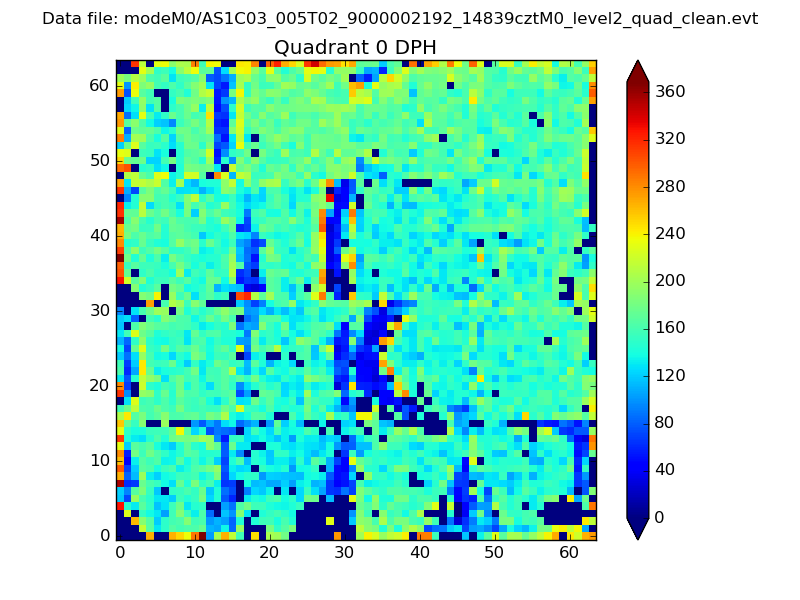 |
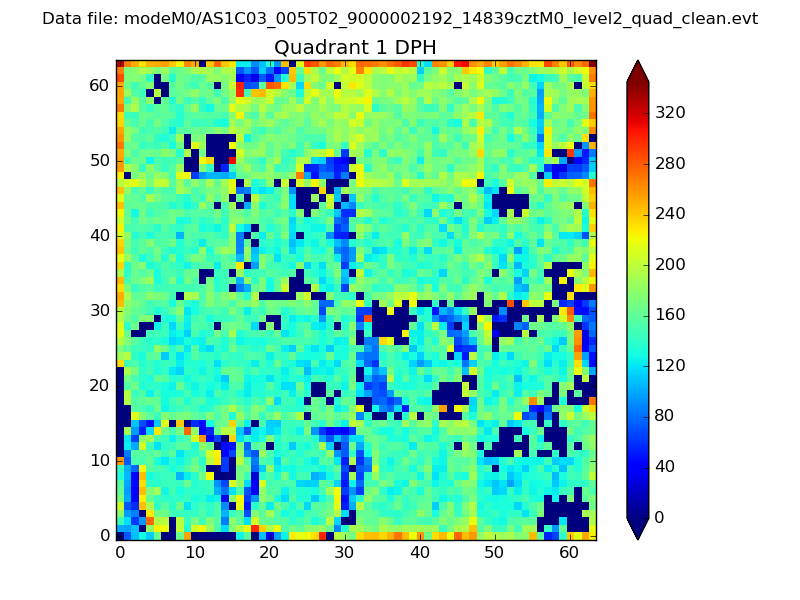 |
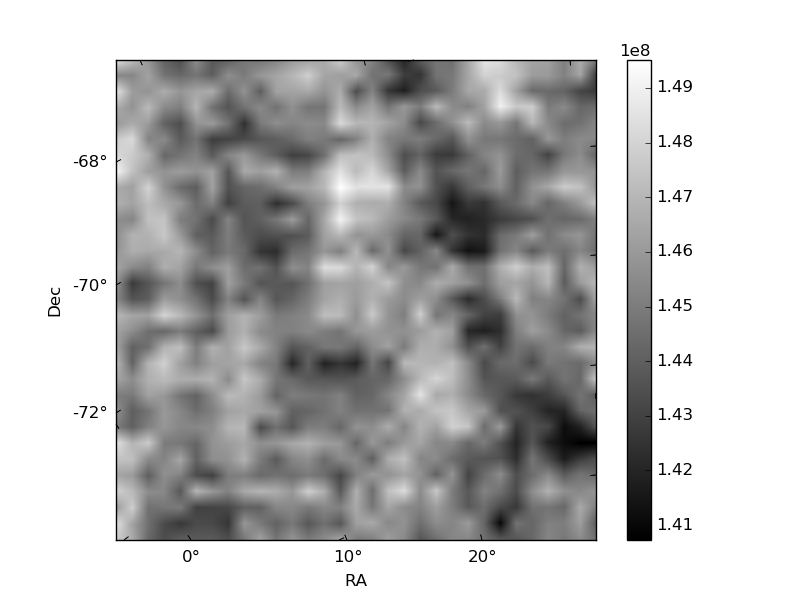
Quadrant B |
|---|---|---|---|
| Quadrant D | 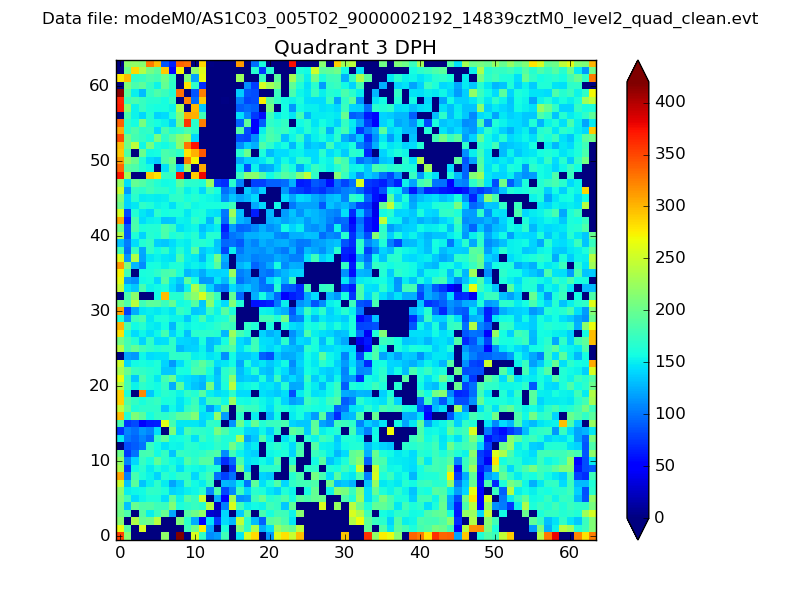 |
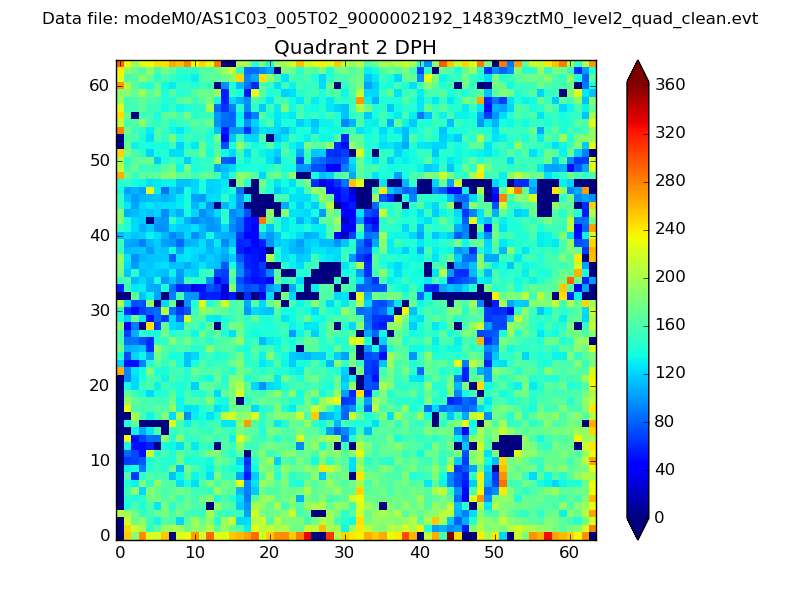 |
Quadrant C |
| Plot type | Count rate plots | Images |
|---|---|---|
| Comparison with Poisson distribution Blue bars denote a histogram of data divided into 1 sec bins. Red curve is a Poisson curve with rate = median count rate of data. |
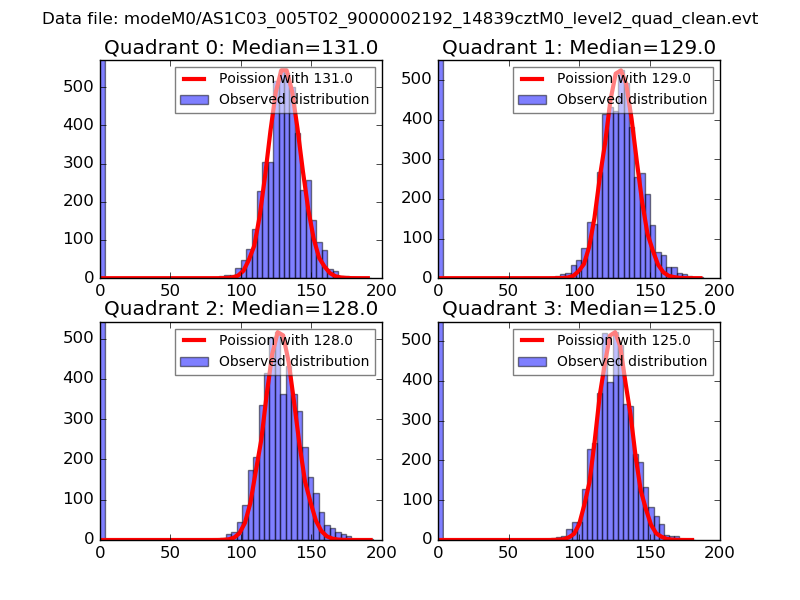 |
 |
| Quadrant-wise count rates Data is divided into 100 sec bins |
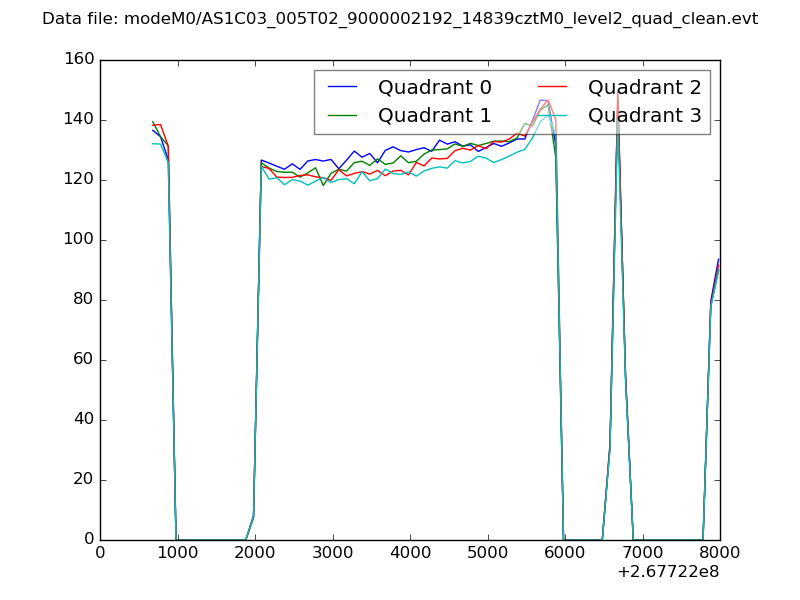 |
|
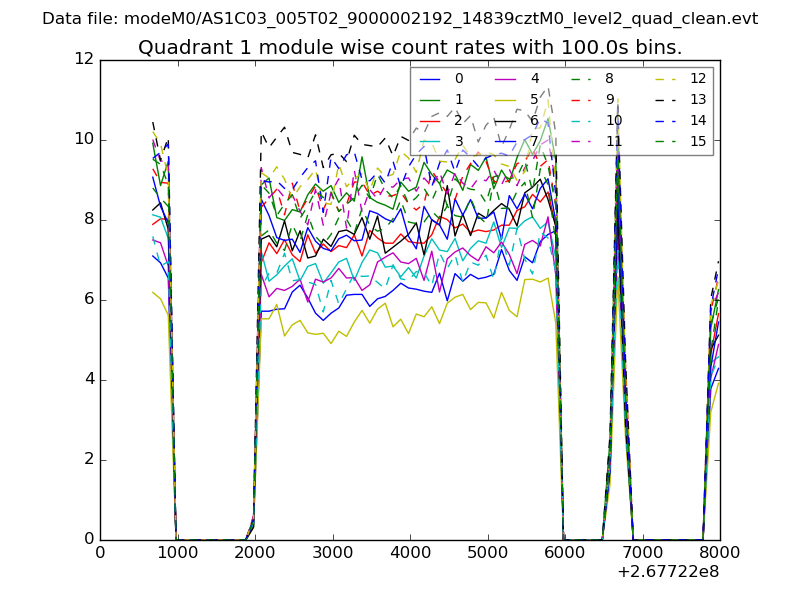
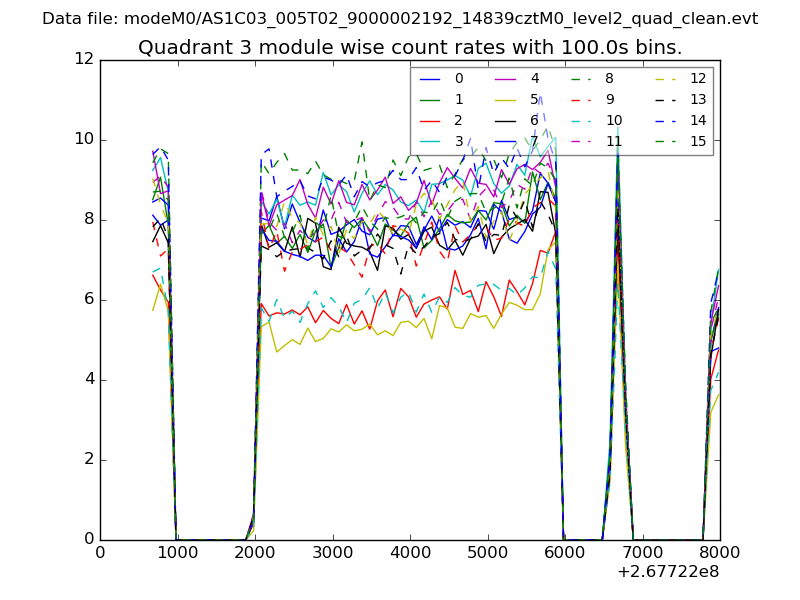
| Module-wise count rates for Quadrant A Data is divided into 100 sec bins |
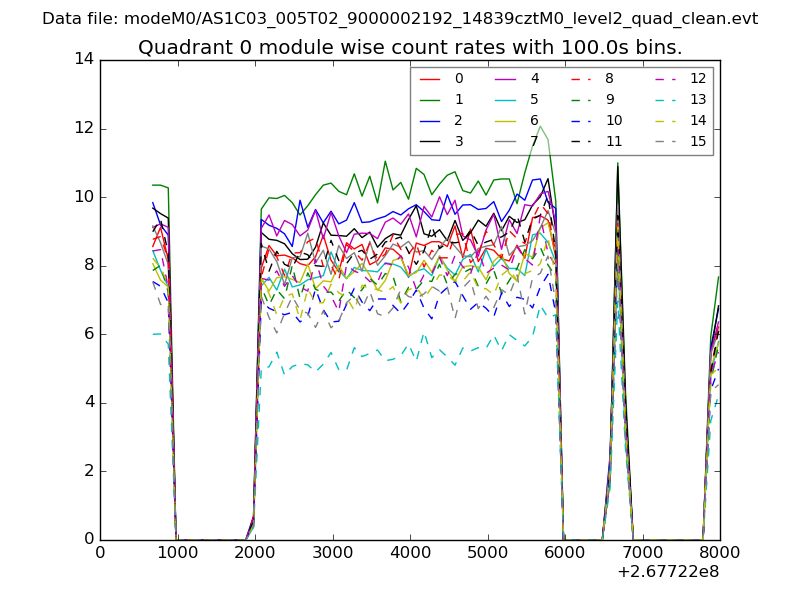 |
 |
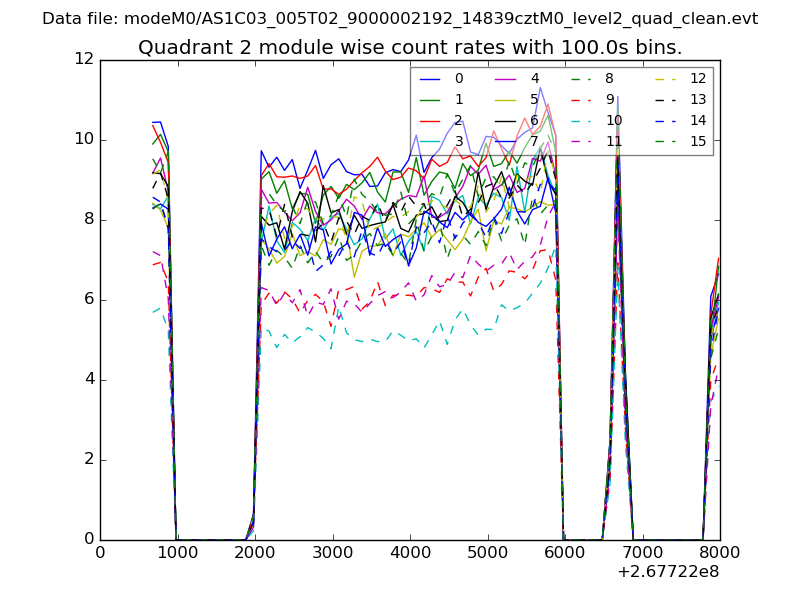
| Module-wise count rates for Quadrant B Data is divided into 100 sec bins |
 |
 |
| Module-wise count rates for Quadrant C Data is divided into 100 sec bins |
 |
 |
| Module-wise count rates for Quadrant D Data is divided into 100 sec bins |
 |
 |
| Parameter | Plot |
|---|---|
| CZT HV Monitor | 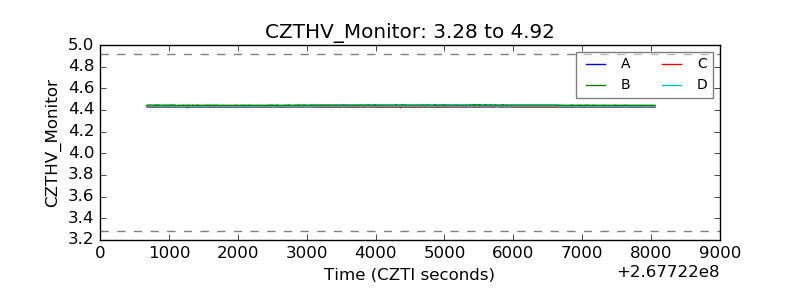 |
| D_VDD | 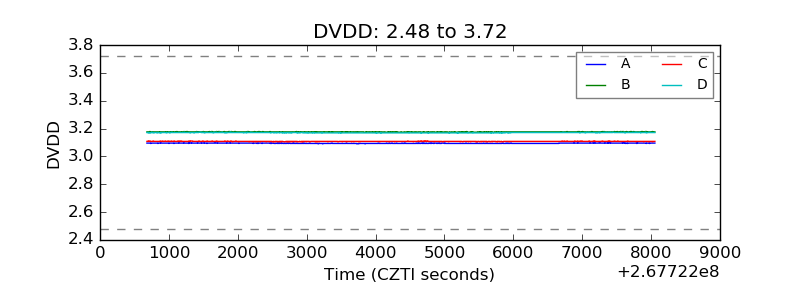 |
| Temperature 1 | 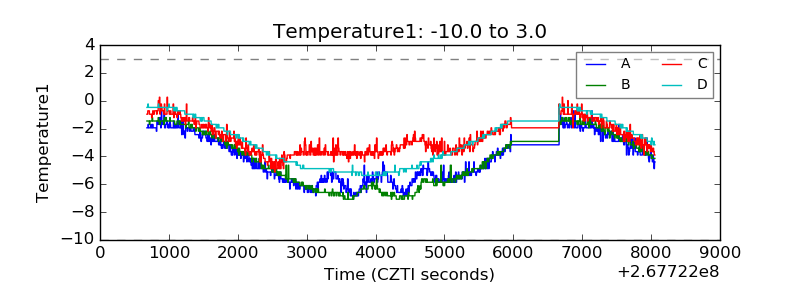 |
| Veto HV Monitor |  |
| Veto LLD | 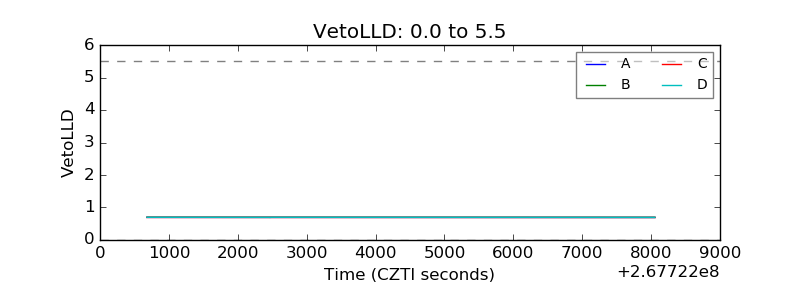 |
| Alpha Counter | 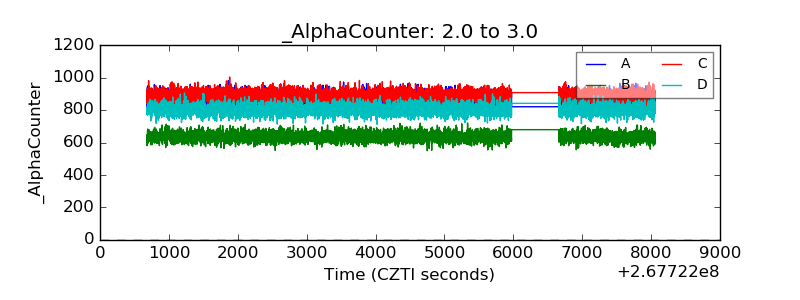 |
| _CPM_Rate | 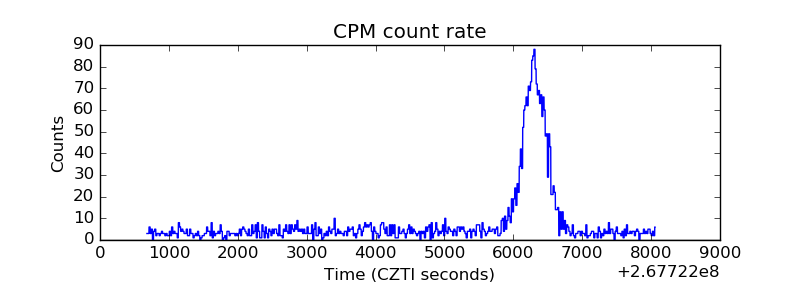 |
| CZT Counter | 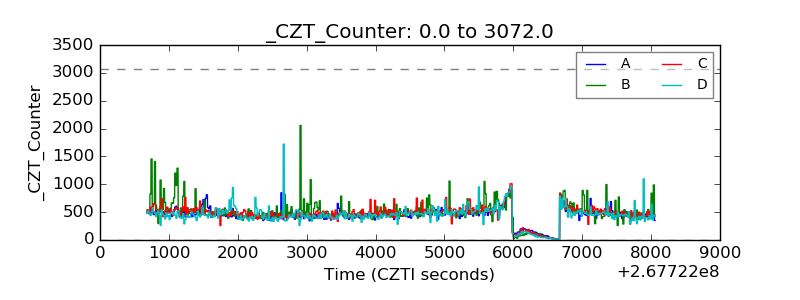 |
| +2.5 Volts monitor |  |
| +5 Volts monitor |  |
| _ROLL_ROT | 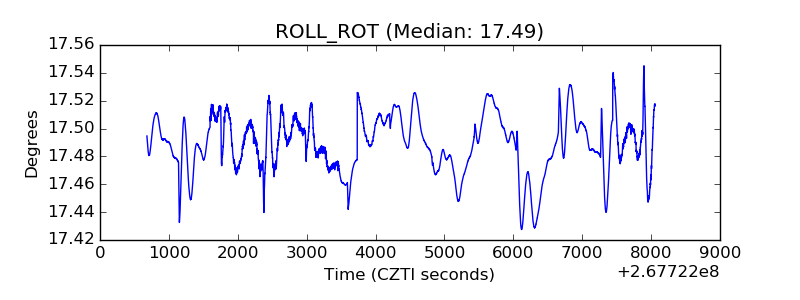 |
| _Roll_DEC |  |
| _Roll_RA | 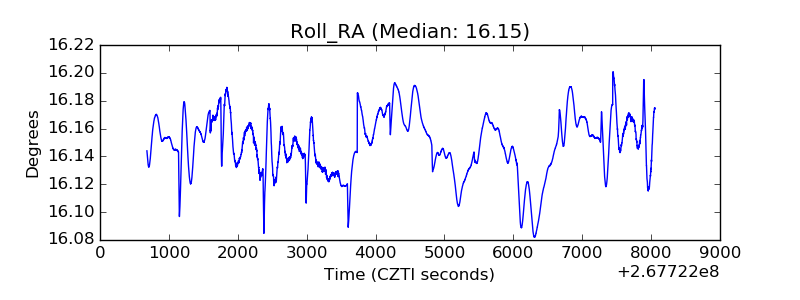 |
| Veto Counter | 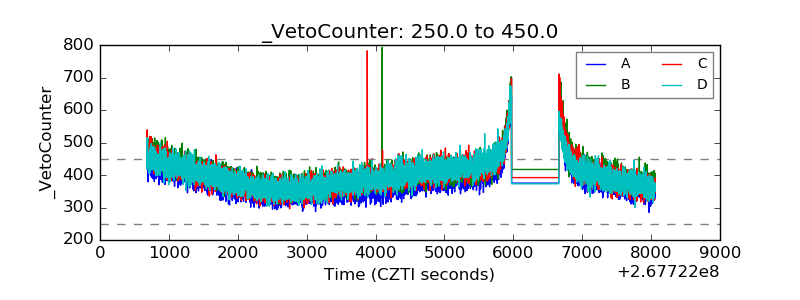 |