| Param | Original file | Final file |
|---|---|---|
| Filename | modeM0/AS1C03_005T02_9000002192_14845cztM0_level2.evt | modeM0/AS1C03_005T02_9000002192_14845cztM0_level2_quad_clean.evt |
| Size (bytes) | 853,453,440 | 189,852,480 |
| Size | 813.9 MB | 181.1 MB |
| Events in quadrant A | 5,842,384 | 1,237,146 |
| Events in quadrant B | 6,251,027 | 1,236,010 |
| Events in quadrant C | 6,321,539 | 1,227,631 |
| Events in quadrant D | 6,590,991 | 1,190,824 |
| Mode M0 | |||
|---|---|---|---|
| Quadrant | BADHDUFLAG | Total packets | Discarded packets |
| A | 0 | 25713 | 4 |
| B | 0 | 26703 | 3 |
| C | 0 | 25730 | 3 |
| D | 0 | 28310 | 3 |
| Mode SS | |||
|---|---|---|---|
| Quadrant | BADHDUFLAG | Total packets | Discarded packets |
| A | 0 | 254 | 0 |
| B | 0 | 254 | 0 |
| C | 0 | 254 | 0 |
| D | 0 | 254 | 0 |
| Mode M9 | |||
|---|---|---|---|
| Quadrant | BADHDUFLAG | Total packets | Discarded packets |
| A | 0 | 18 | 0 |
| B | 0 | 18 | 0 |
| C | 0 | 18 | 0 |
| D | 0 | 18 | 0 |
| Quadrant | Total seconds | Saturated seconds | Saturation percentage |
|---|---|---|---|
| A | 12426 | 38 | 0.305810% |
| B | 12426 | 116 | 0.933526% |
| C | 12426 | 31 | 0.249477% |
| D | 12426 | 222 | 1.786577% |
Noise dominated data is calculated using 1-second bins in cleaned event files. If a bin has >2000 counts, and if more than 50% of those come from <1% of pixels, then it is considered to be noise-dominated and hence unusable.
| Quadrant | # 1 sec bins | Bins with >0 counts | Bins with >2000 counts | High rate bins dominated by noise | Noise dominated (total time) | Noise dominated (detector-on time) | Marked lightcurve |
|---|---|---|---|---|---|---|---|
| A | 14192 | 12430 | 0 | 0 | 0.00% | 0.00% | 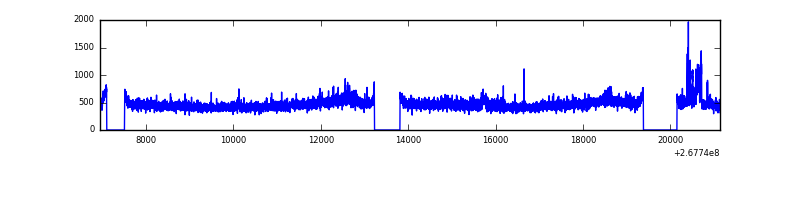 |
| B | 14192 | 12430 | 26 | 26 | 0.18% | 0.21% | 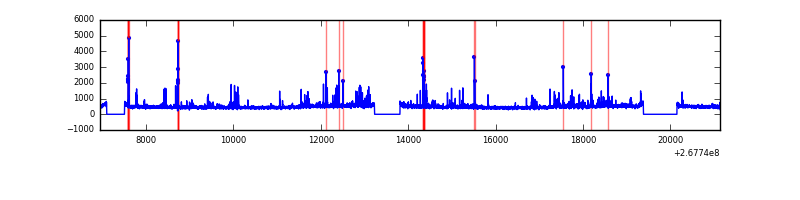 |
| C | 14192 | 12430 | 0 | 0 | 0.00% | 0.00% | 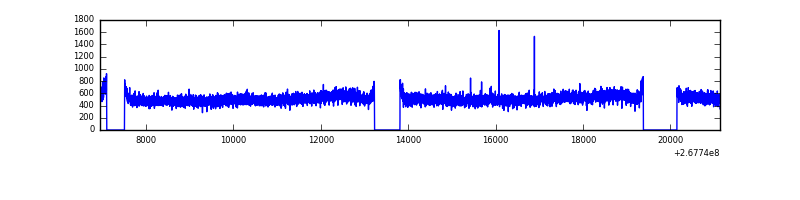 |
| D | 14192 | 12430 | 141 | 141 | 0.99% | 1.13% | 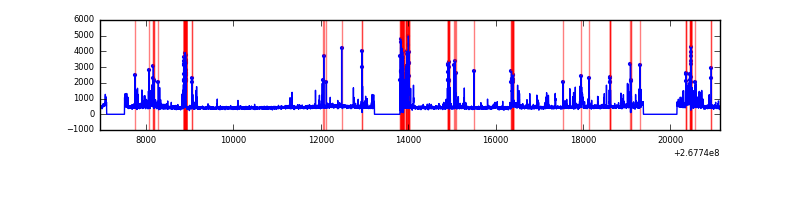 |
Top three noisy pixels from each quadrant. If the there are fewer than three noisy pixels in the level2.evt file, extra rows are filled as -1
| Pixel properties | Quadrant properties | ||||||
|---|---|---|---|---|---|---|---|
| Quadrant | DetID | PixID | Counts | Sigma | Mean | Median | Sigma |
| A | 12 | 189 | 168138 | 570.93 | 1448 | 1414 | 292.0 |
| A | 11 | 29 | 86464 | 291.24 | 1448 | 1414 | 292.0 |
| A | 0 | 226 | 12625 | 38.39 | 1448 | 1414 | 292.0 |
| B | 3 | 64 | 151758 | 545.19 | 1446 | 1409 | 275.8 |
| B | 0 | 189 | 106525 | 381.17 | 1446 | 1409 | 275.8 |
| B | 0 | 229 | 93573 | 334.2 | 1446 | 1409 | 275.8 |
| C | 3 | 233 | 820897 | 2532.45 | 1409 | 1416 | 323.6 |
| C | 13 | 61 | 10132 | 26.94 | 1409 | 1416 | 323.6 |
| C | 9 | 54 | 5951 | 14.01 | 1409 | 1416 | 323.6 |
| D | 7 | 254 | 455757 | 1359.27 | 1399 | 1362 | 334.3 |
| D | 12 | 110 | 329358 | 981.16 | 1399 | 1362 | 334.3 |
| D | 10 | 70 | 161744 | 479.76 | 1399 | 1362 | 334.3 |
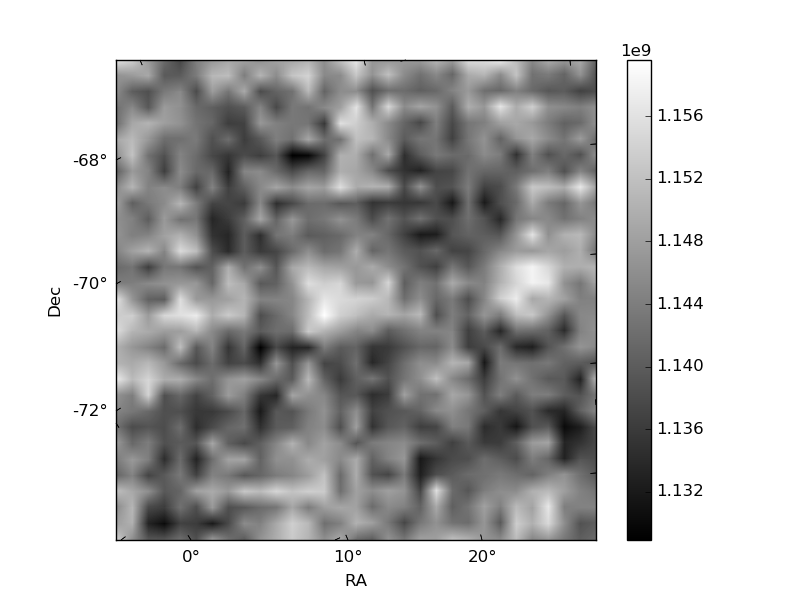
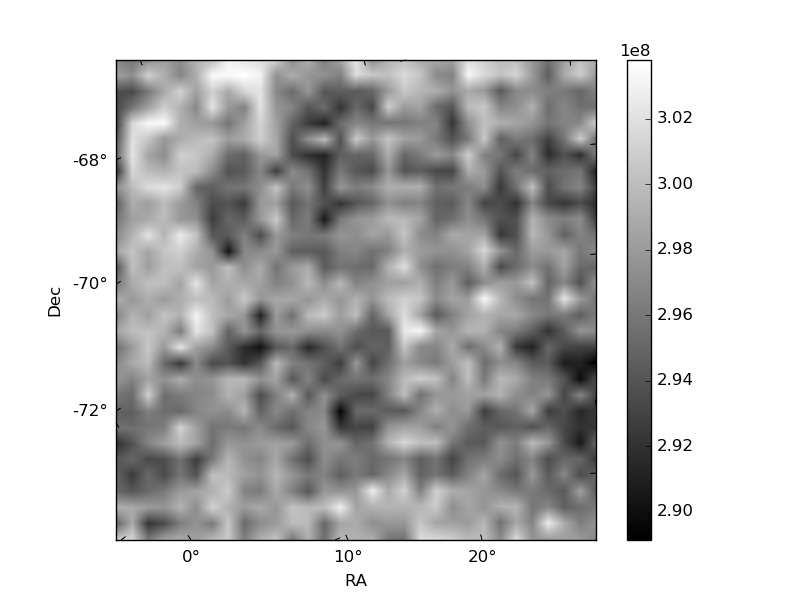
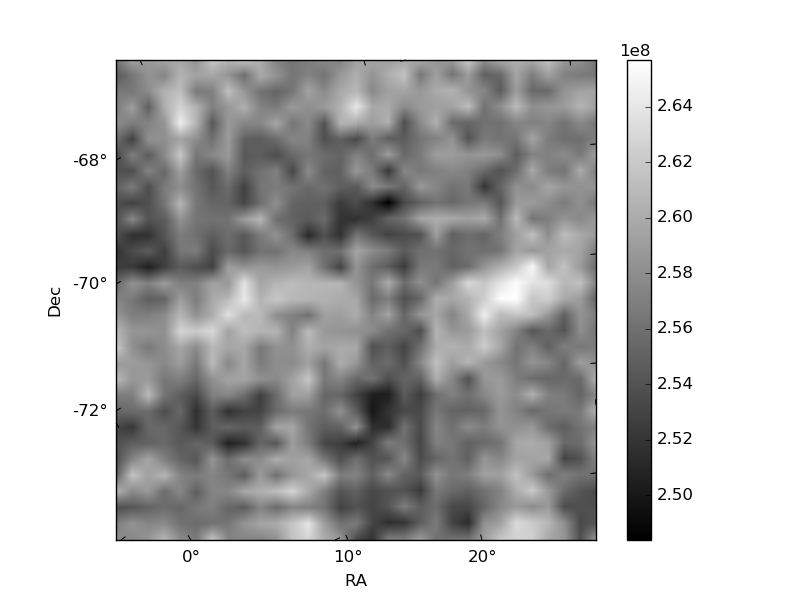
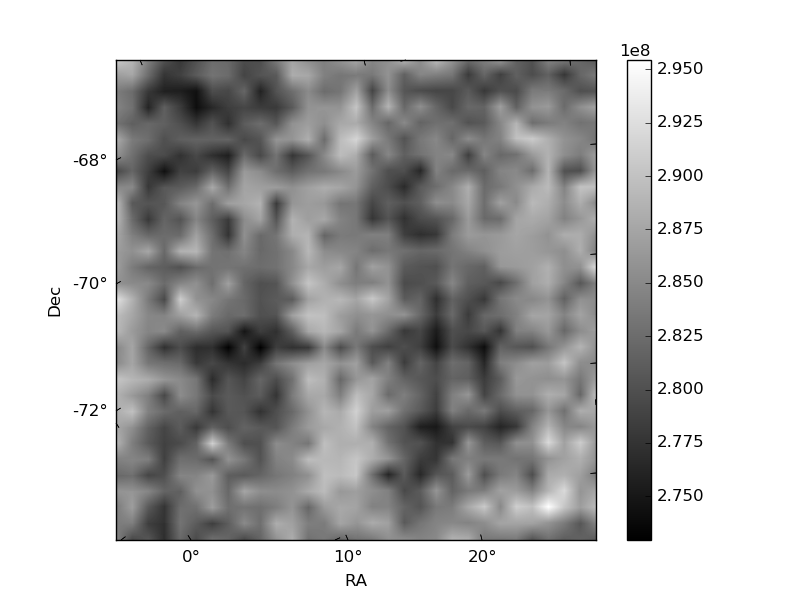
Histogram calculated using DETX and DETY for each event in the final _common_clean file
| Quadrant A | 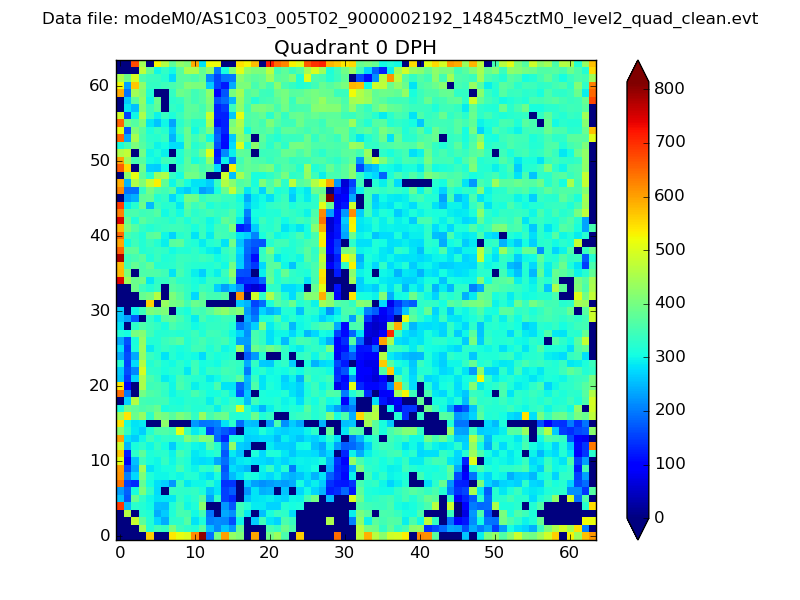 |
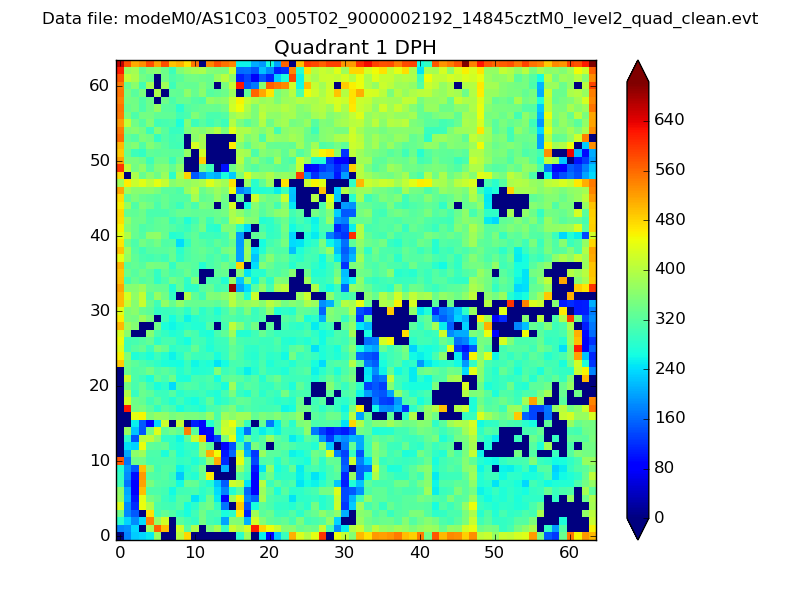 |
Quadrant B |
|---|---|---|---|
| Quadrant D | 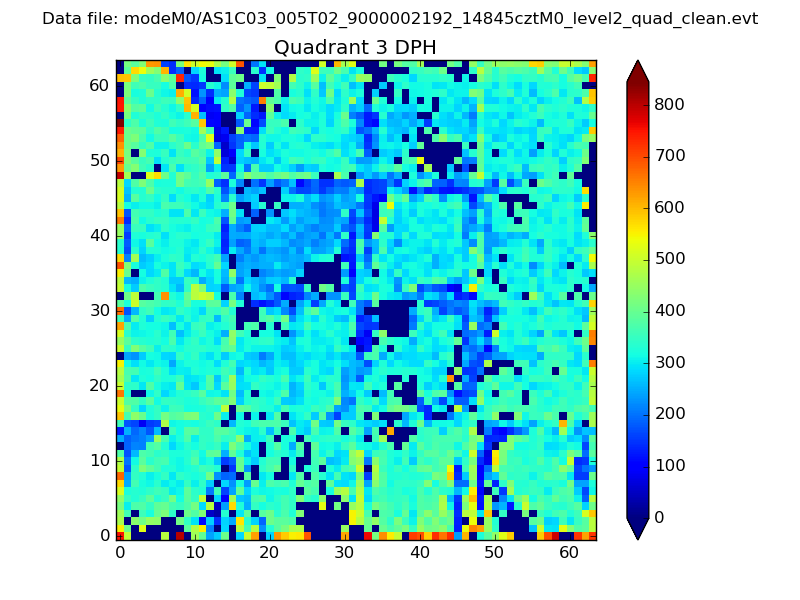 |
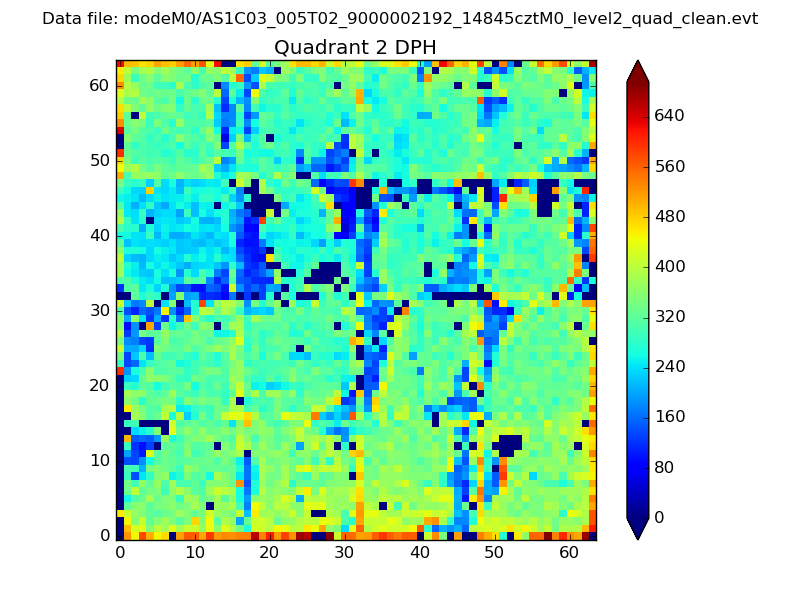 |
Quadrant C |
| Plot type | Count rate plots | Images |
|---|---|---|
| Comparison with Poisson distribution Blue bars denote a histogram of data divided into 1 sec bins. Red curve is a Poisson curve with rate = median count rate of data. |
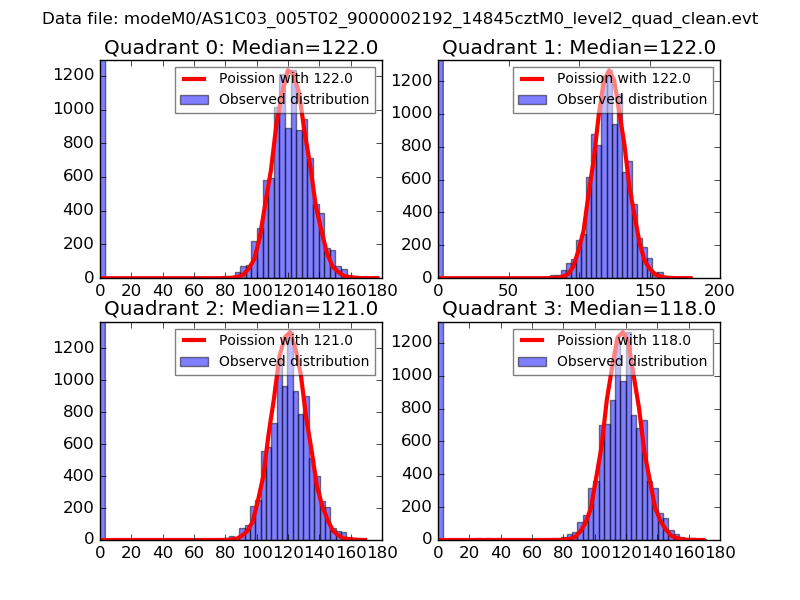 |
 |
| Quadrant-wise count rates Data is divided into 100 sec bins |
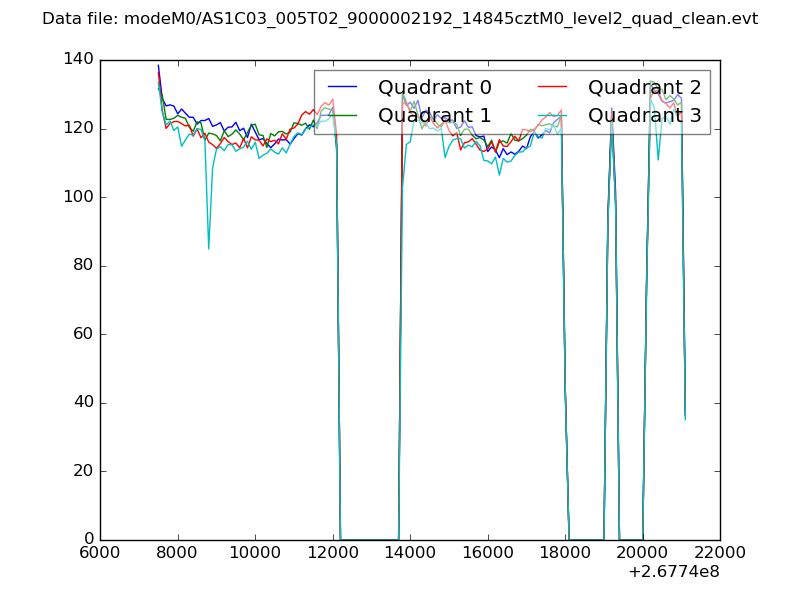 |
|
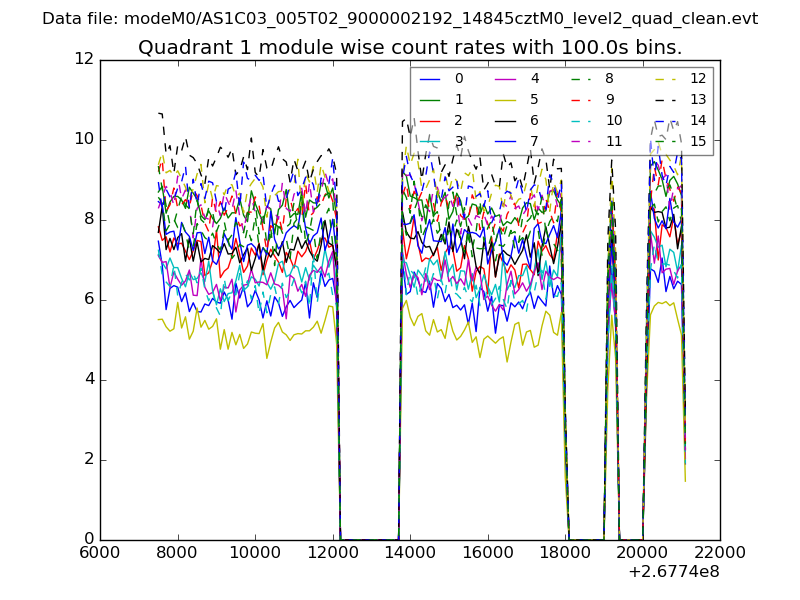
| Module-wise count rates for Quadrant A Data is divided into 100 sec bins |
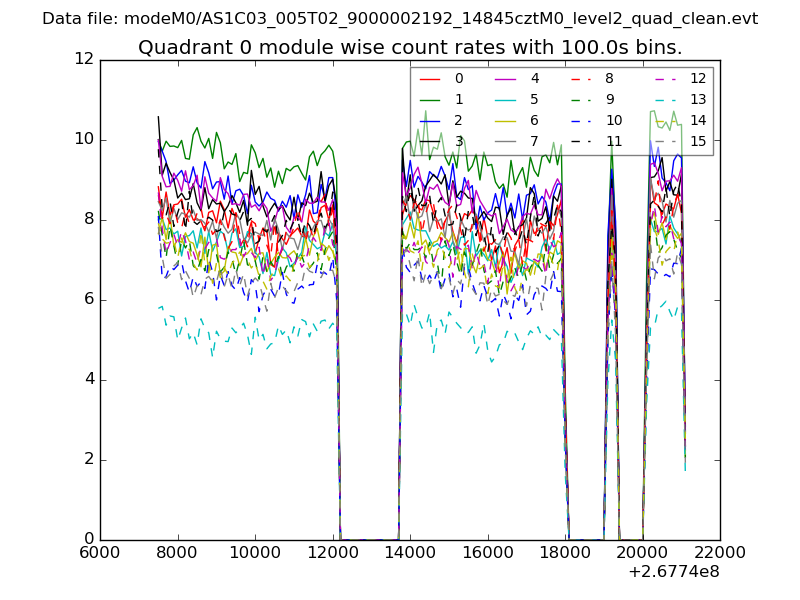 |
 |
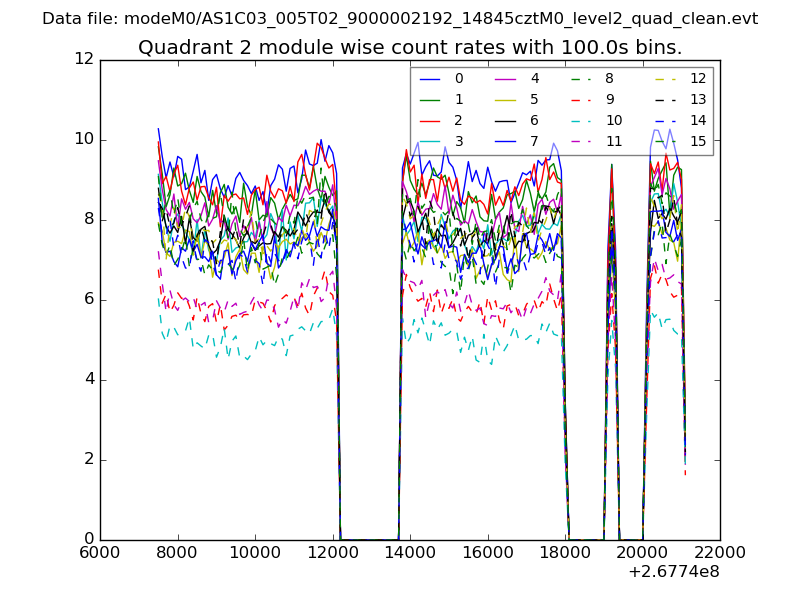
| Module-wise count rates for Quadrant B Data is divided into 100 sec bins |
 |
 |
| Module-wise count rates for Quadrant C Data is divided into 100 sec bins |
 |
 |
| Module-wise count rates for Quadrant D Data is divided into 100 sec bins |
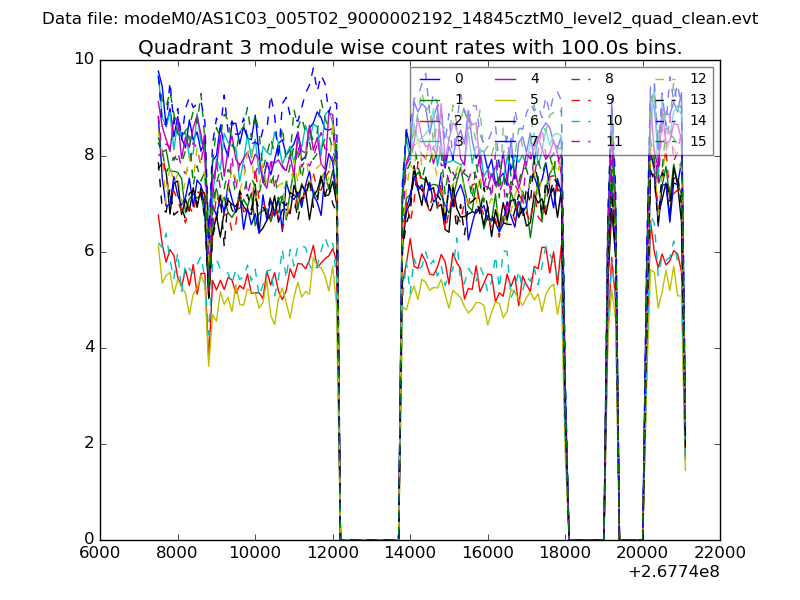 |
 |
| Parameter | Plot |
|---|---|
| CZT HV Monitor | 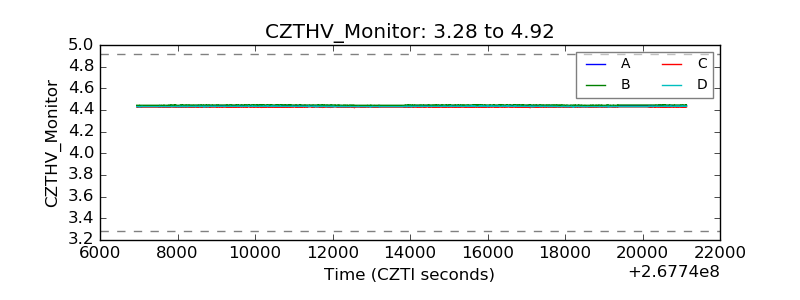 |
| D_VDD | 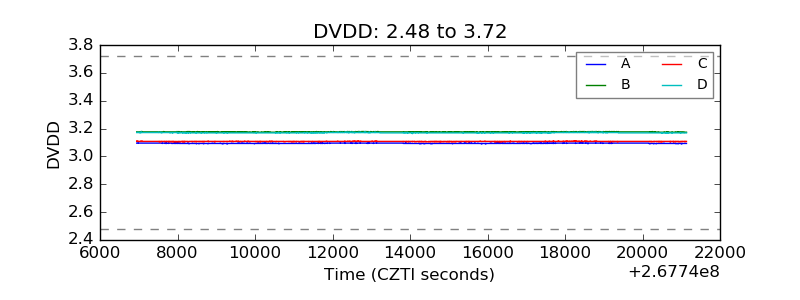 |
| Temperature 1 | 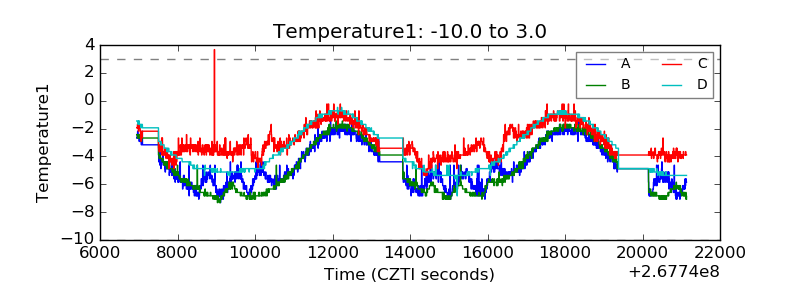 |
| Veto HV Monitor | 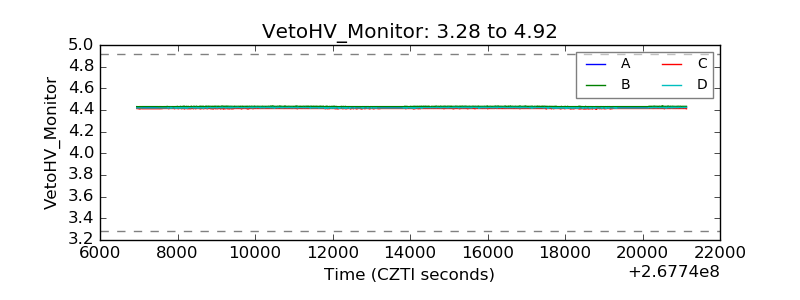 |
| Veto LLD | 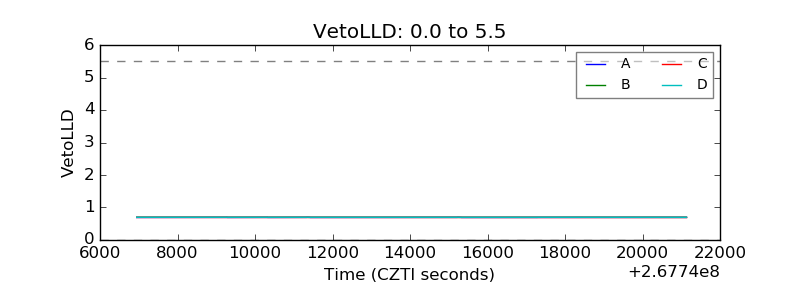 |
| Alpha Counter | 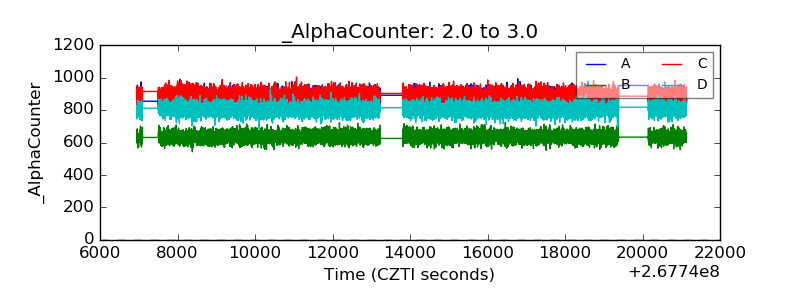 |
| _CPM_Rate | 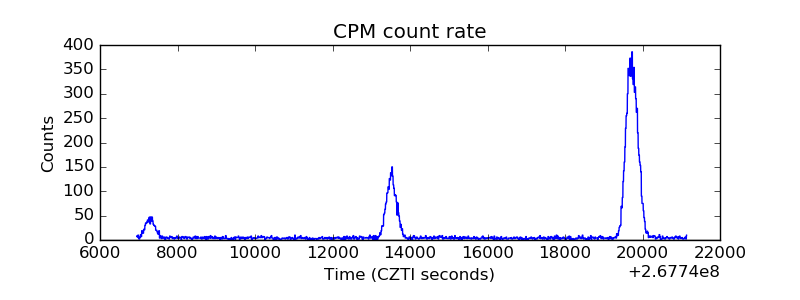 |
| CZT Counter | 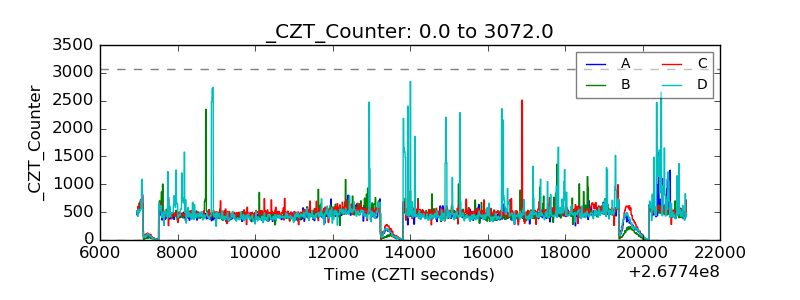 |
| +2.5 Volts monitor |  |
| +5 Volts monitor | 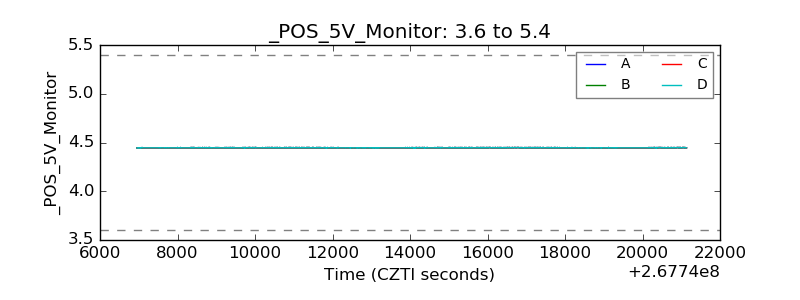 |
| _ROLL_ROT | 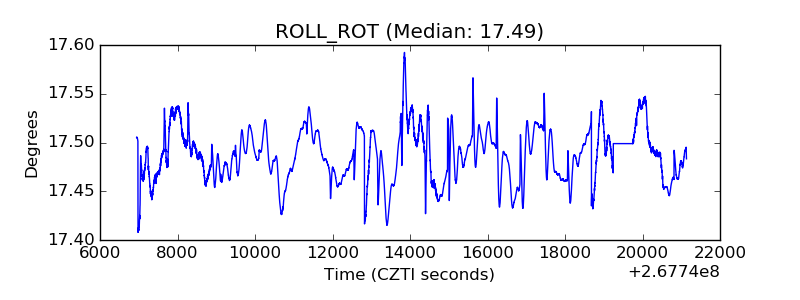 |
| _Roll_DEC | 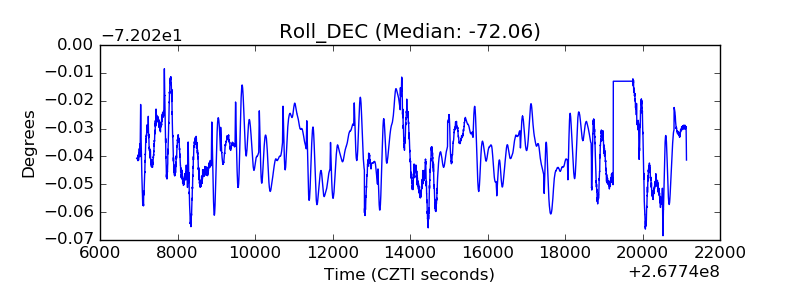 |
| _Roll_RA | 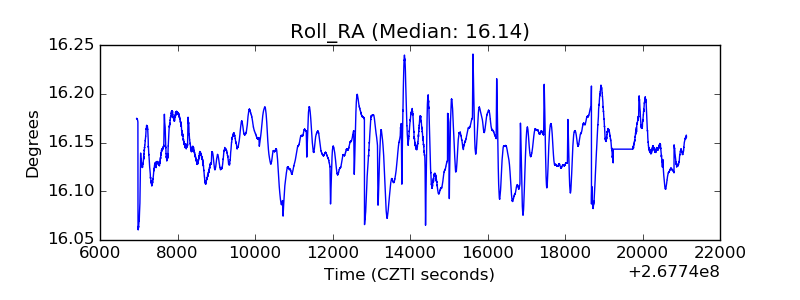 |
| Veto Counter | 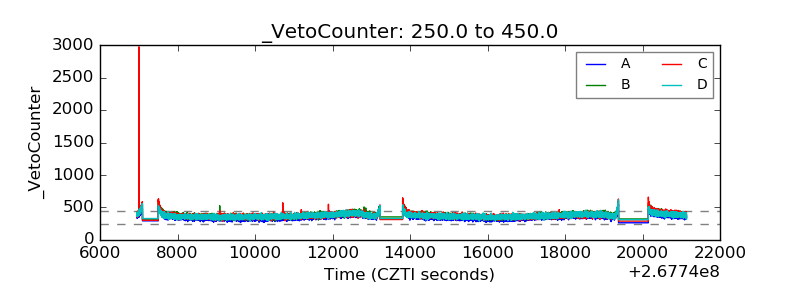 |