| Param | Original file | Final file |
|---|---|---|
| Filename | modeM0/AS1G08_028T01_9000002190cztM0_level2.fits | modeM0/AS1G08_028T01_9000002190cztM0_level2_quad_clean.evt |
| Size (bytes) | 230,267,520 | 200,272,320 |
| Size | 219.6 MB | 191.0 MB |
| Events in quadrant A | 1,414,974 | 1,166,038 |
| Events in quadrant B | 1,347,908 | 1,155,931 |
| Events in quadrant C | 1,363,060 | 1,081,493 |
| Events in quadrant D | 1,207,750 | 1,020,356 |
| Mode SS | |||
|---|---|---|---|
| Quadrant | BADHDUFLAG | Total packets | Discarded packets |
| A | 0 | 482 | 0 |
| B | 0 | 482 | 0 |
| C | 0 | 482 | 0 |
| D | 0 | 482 | 0 |
| Mode M9 | |||
|---|---|---|---|
| Quadrant | BADHDUFLAG | Total packets | Discarded packets |
| A | 0 | 36 | 0 |
| B | 0 | 36 | 0 |
| C | 0 | 36 | 0 |
| D | 0 | 36 | 0 |
| Mode M0 | |||
|---|---|---|---|
| Quadrant | BADHDUFLAG | Total packets | Discarded packets |
| A | 0 | 49372 | 0 |
| B | 0 | 50156 | 0 |
| C | 0 | 49661 | 0 |
| D | 0 | 49240 | 0 |
| Quadrant | Total seconds | Saturated seconds | Saturation percentage |
|---|---|---|---|
| A | 23852 | 160 | 0.670803% |
| B | 23852 | 251 | 1.052323% |
| C | 23852 | 107 | 0.448600% |
| D | 23852 | 138 | 0.578568% |
Noise dominated data is calculated using 1-second bins in cleaned event files. If a bin has >2000 counts, and if more than 50% of those come from <1% of pixels, then it is considered to be noise-dominated and hence unusable.
| Quadrant | # 1 sec bins | Bins with >0 counts | Bins with >2000 counts | High rate bins dominated by noise | Noise dominated (total time) | Noise dominated (detector-on time) | Marked lightcurve |
|---|---|---|---|---|---|---|---|
| A | 27322 | 23852 | 0 | 0 | 0.00% | 0.00% |  |
| B | 27322 | 23852 | 0 | 0 | 0.00% | 0.00% |  |
| C | 27322 | 23852 | 0 | 0 | 0.00% | 0.00% |  |
| D | 27322 | 23852 | 0 | 0 | 0.00% | 0.00% |  |
Top three noisy pixels from each quadrant. If the there are fewer than three noisy pixels in the level2.evt file, extra rows are filled as -1
| Pixel properties | Quadrant properties | ||||||
|---|---|---|---|---|---|---|---|
| Quadrant | DetID | PixID | Counts | Sigma | Mean | Median | Sigma |
| A | 14 | 188 | 1399 | 11.4 | 367 | 344 | 92.5 |
| A | 0 | 29 | 1354 | 10.91 | 367 | 344 | 92.5 |
| A | 14 | 204 | 1190 | 9.14 | 367 | 344 | 92.5 |
| B | 2 | 9 | 1089 | 10.19 | 355 | 337 | 73.8 |
| B | 5 | 255 | 903 | 7.67 | 355 | 337 | 73.8 |
| B | 3 | 17 | 901 | 7.64 | 355 | 337 | 73.8 |
| C | 1 | 80 | 969 | 6.8 | 359 | 333 | 93.5 |
| C | 1 | 81 | 959 | 6.69 | 359 | 333 | 93.5 |
| C | 12 | 241 | 955 | 6.65 | 359 | 333 | 93.5 |
| D | 6 | 231 | 909 | 6.36 | 343 | 312 | 93.9 |
| D | 3 | 14 | 890 | 6.15 | 343 | 312 | 93.9 |
| D | 1 | 31 | 863 | 5.87 | 343 | 312 | 93.9 |
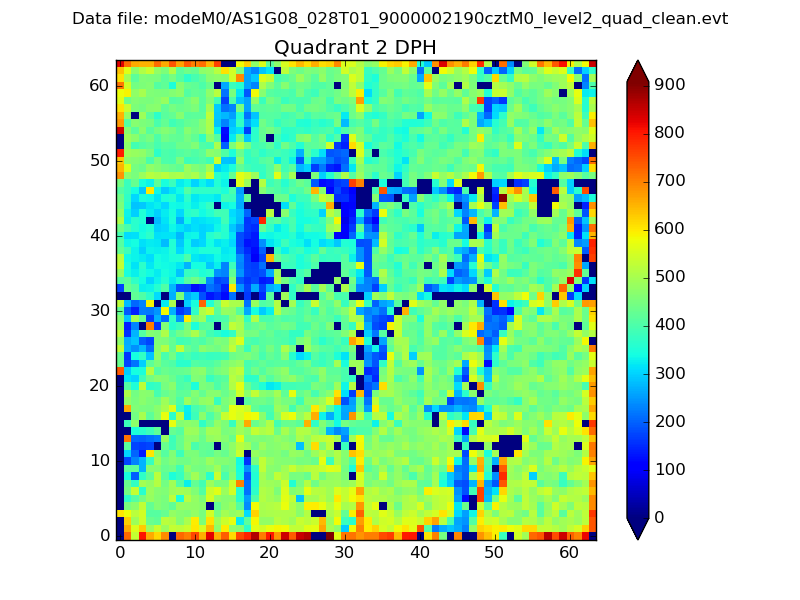
Histogram calculated using DETX and DETY for each event in the final _common_clean file
| Quadrant A |  |
 |
Quadrant B |
|---|---|---|---|
| Quadrant D | 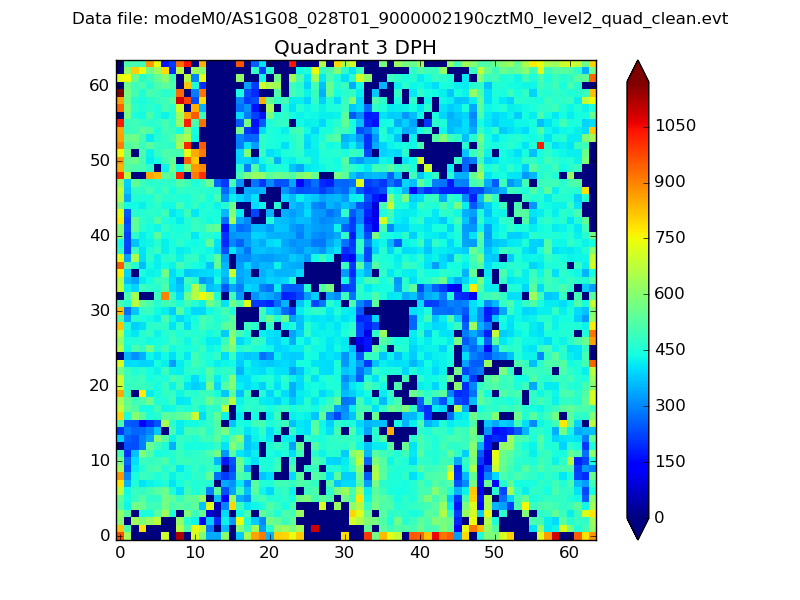 |
 |
Quadrant C |
| Plot type | Count rate plots | Images |
|---|---|---|
| Comparison with Poisson distribution Blue bars denote a histogram of data divided into 1 sec bins. Red curve is a Poisson curve with rate = median count rate of data. |
 |
 |
| Quadrant-wise count rates Data is divided into 100 sec bins |
 |
|
| Module-wise count rates for Quadrant A Data is divided into 100 sec bins |
 |
 |
| Module-wise count rates for Quadrant B Data is divided into 100 sec bins |
 |
 |
| Module-wise count rates for Quadrant C Data is divided into 100 sec bins |
 |
 |
| Module-wise count rates for Quadrant D Data is divided into 100 sec bins |
 |
 |
| Parameter | Plot |
|---|---|
| CZT HV Monitor |  |
| D_VDD |  |
| Temperature 1 |  |
| Veto HV Monitor |  |
| Veto LLD |  |
| Alpha Counter |  |
| _CPM_Rate |  |
| CZT Counter |  |
| +2.5 Volts monitor |  |
| +5 Volts monitor |  |
| _ROLL_ROT |  |
| _Roll_DEC |  |
| _Roll_RA |  |
| Veto Counter |  |