| Param | Original file | Final file |
|---|---|---|
| Filename | modeM0/AS1G08_028T01_9000002190_14829cztM0_level2.evt | modeM0/AS1G08_028T01_9000002190_14829cztM0_level2_quad_clean.evt |
| Size (bytes) | 398,206,080 | 79,286,400 |
| Size | 379.8 MB | 75.6 MB |
| Events in quadrant A | 2,926,713 | 501,915 |
| Events in quadrant B | 2,953,993 | 500,907 |
| Events in quadrant C | 3,033,141 | 489,772 |
| Events in quadrant D | 2,728,656 | 480,202 |
| Mode SS | |||
|---|---|---|---|
| Quadrant | BADHDUFLAG | Total packets | Discarded packets |
| A | 0 | 124 | 0 |
| B | 0 | 124 | 0 |
| C | 0 | 124 | 0 |
| D | 0 | 124 | 0 |
| Mode M9 | |||
|---|---|---|---|
| Quadrant | BADHDUFLAG | Total packets | Discarded packets |
| A | 0 | 6 | 0 |
| B | 0 | 6 | 0 |
| C | 0 | 6 | 0 |
| D | 0 | 6 | 0 |
| Mode M0 | |||
|---|---|---|---|
| Quadrant | BADHDUFLAG | Total packets | Discarded packets |
| A | 0 | 12698 | 2 |
| B | 0 | 12801 | 1 |
| C | 0 | 12824 | 1 |
| D | 0 | 12541 | 1 |
| Quadrant | Total seconds | Saturated seconds | Saturation percentage |
|---|---|---|---|
| A | 6133 | 34 | 0.554378% |
| B | 6133 | 55 | 0.896788% |
| C | 6133 | 27 | 0.440241% |
| D | 6133 | 27 | 0.440241% |
Noise dominated data is calculated using 1-second bins in cleaned event files. If a bin has >2000 counts, and if more than 50% of those come from <1% of pixels, then it is considered to be noise-dominated and hence unusable.
| Quadrant | # 1 sec bins | Bins with >0 counts | Bins with >2000 counts | High rate bins dominated by noise | Noise dominated (total time) | Noise dominated (detector-on time) | Marked lightcurve |
|---|---|---|---|---|---|---|---|
| A | 6744 | 6135 | 0 | 0 | 0.00% | 0.00% | 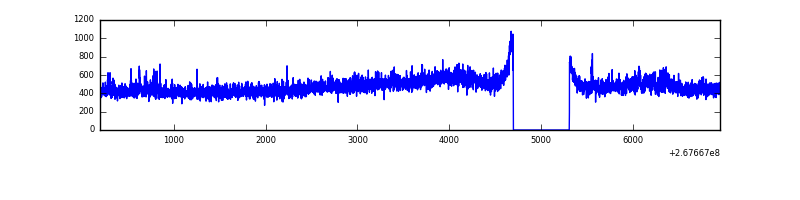 |
| B | 6744 | 6135 | 3 | 3 | 0.04% | 0.05% | 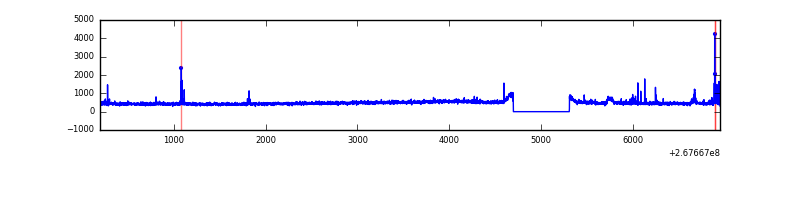 |
| C | 6744 | 6135 | 0 | 0 | 0.00% | 0.00% | 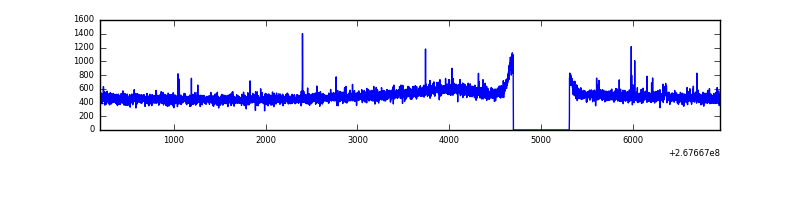 |
| D | 6744 | 6135 | 0 | 0 | 0.00% | 0.00% | 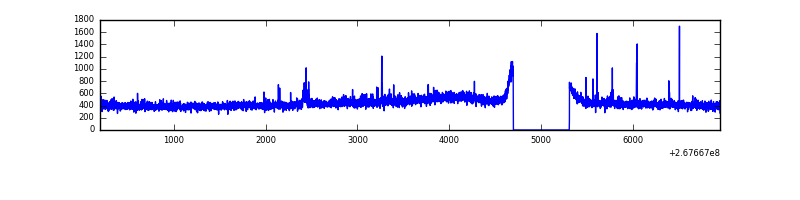 |
Top three noisy pixels from each quadrant. If the there are fewer than three noisy pixels in the level2.evt file, extra rows are filled as -1
| Pixel properties | Quadrant properties | ||||||
|---|---|---|---|---|---|---|---|
| Quadrant | DetID | PixID | Counts | Sigma | Mean | Median | Sigma |
| A | 12 | 189 | 99352 | 654.53 | 734 | 719 | 150.7 |
| A | 0 | 226 | 6271 | 36.84 | 734 | 719 | 150.7 |
| A | 4 | 2 | 5293 | 30.35 | 734 | 719 | 150.7 |
| B | 3 | 64 | 38169 | 263.13 | 728 | 710 | 142.4 |
| B | 0 | 219 | 21518 | 146.17 | 728 | 710 | 142.4 |
| B | 12 | 111 | 17286 | 116.44 | 728 | 710 | 142.4 |
| C | 3 | 233 | 252856 | 1524.99 | 707 | 713 | 165.3 |
| C | 6 | 96 | 20661 | 120.65 | 707 | 713 | 165.3 |
| C | 13 | 61 | 5005 | 25.96 | 707 | 713 | 165.3 |
| D | 2 | 234 | 22259 | 123.71 | 710 | 688 | 174.4 |
| D | 7 | 254 | 19375 | 107.17 | 710 | 688 | 174.4 |
| D | 13 | 249 | 17864 | 98.5 | 710 | 688 | 174.4 |
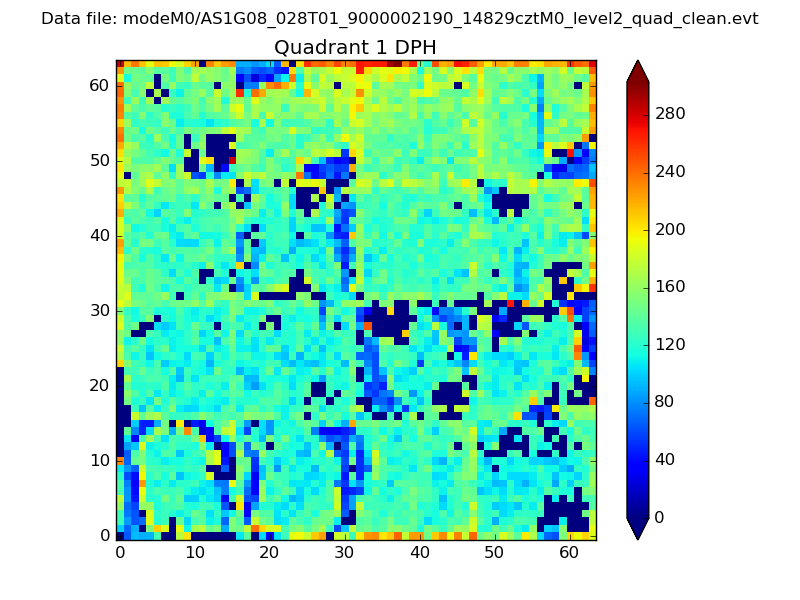
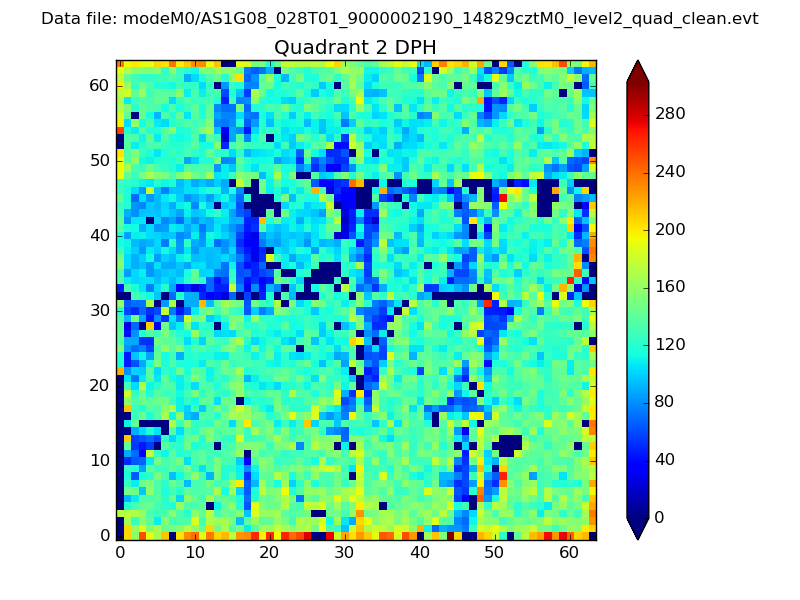
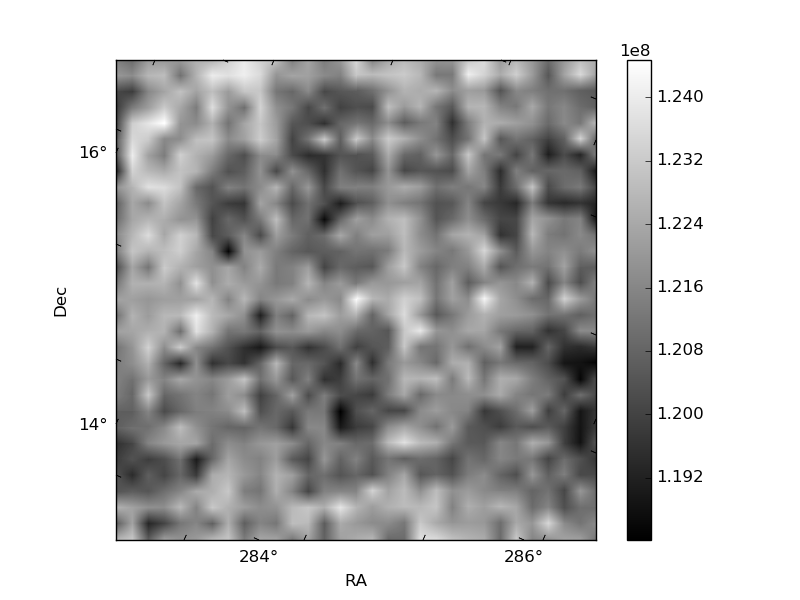
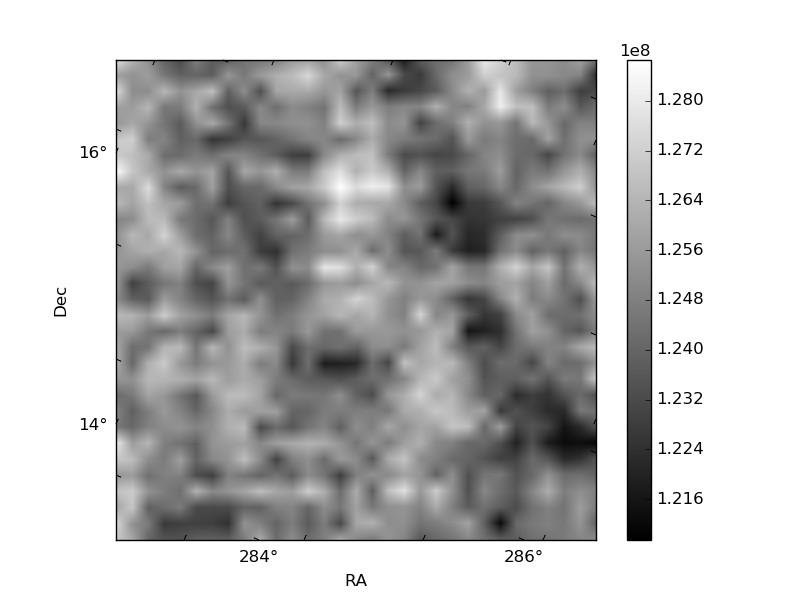
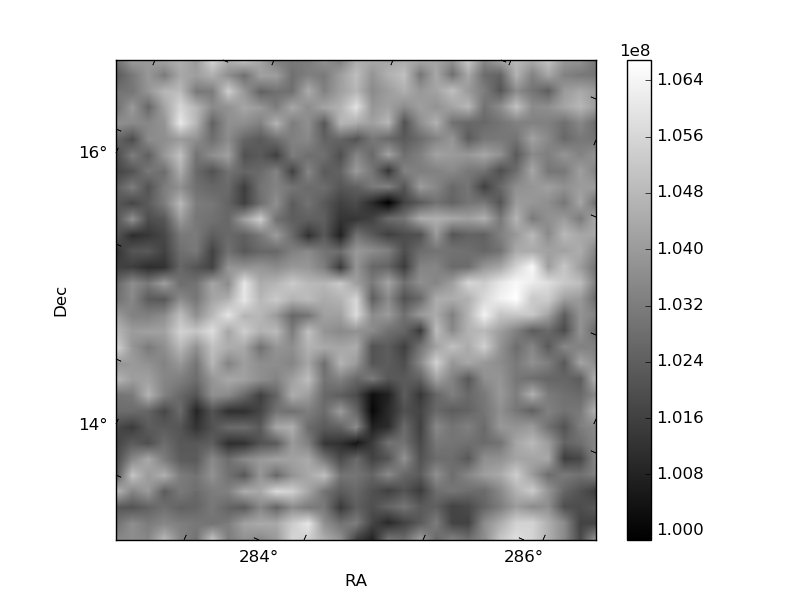
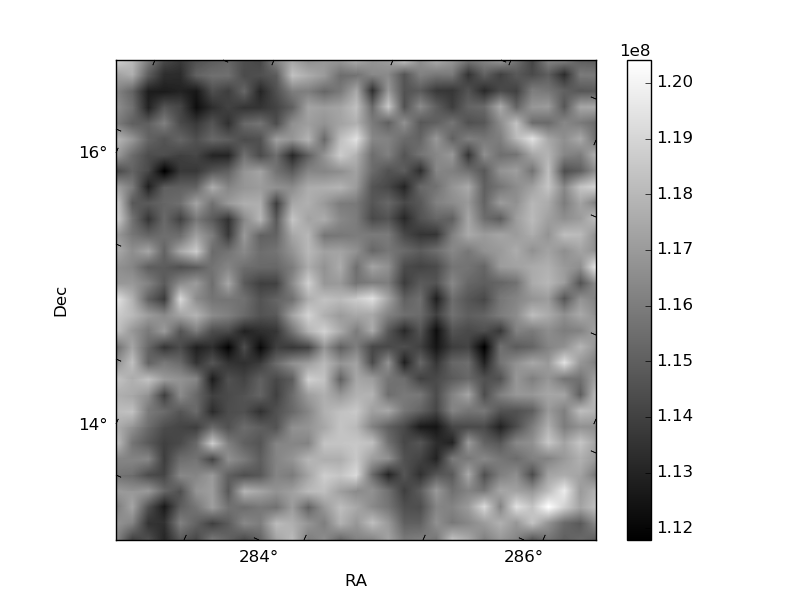
Histogram calculated using DETX and DETY for each event in the final _common_clean file
| Quadrant A |  |
 |
Quadrant B |
|---|---|---|---|
| Quadrant D |  |
 |
Quadrant C |
| Plot type | Count rate plots | Images |
|---|---|---|
| Comparison with Poisson distribution Blue bars denote a histogram of data divided into 1 sec bins. Red curve is a Poisson curve with rate = median count rate of data. |
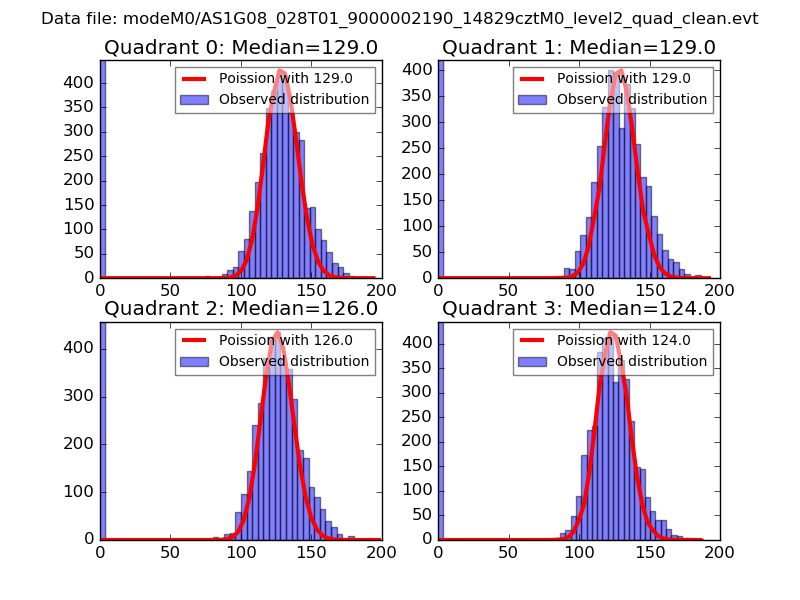 |
 |
| Quadrant-wise count rates Data is divided into 100 sec bins |
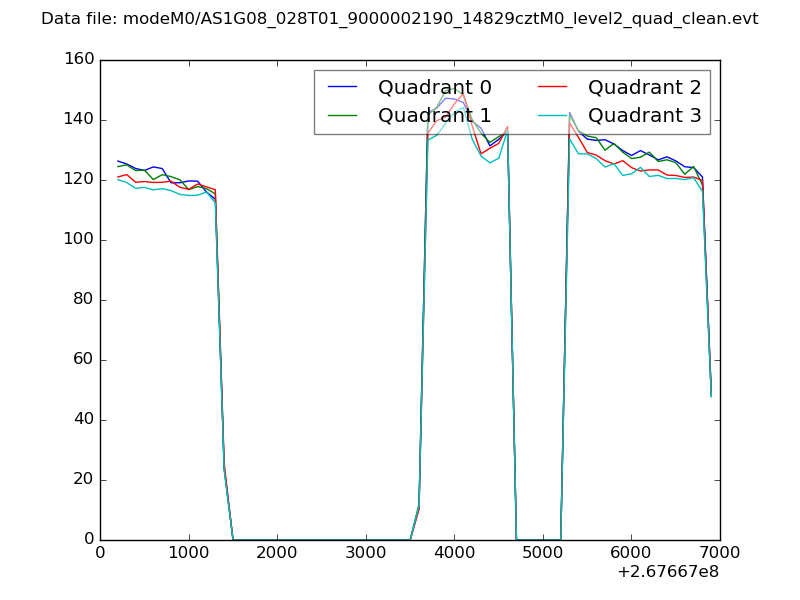 |
|
| Module-wise count rates for Quadrant A Data is divided into 100 sec bins |
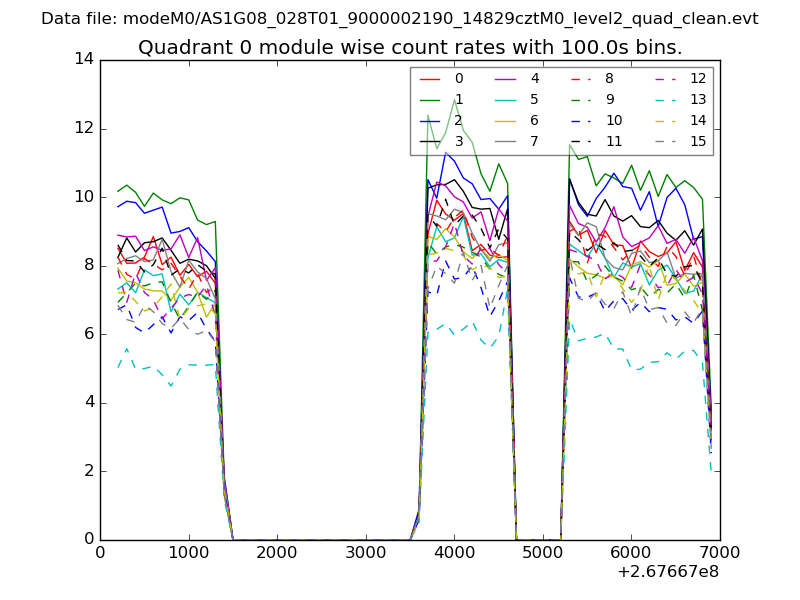 |
 |
| Module-wise count rates for Quadrant B Data is divided into 100 sec bins |
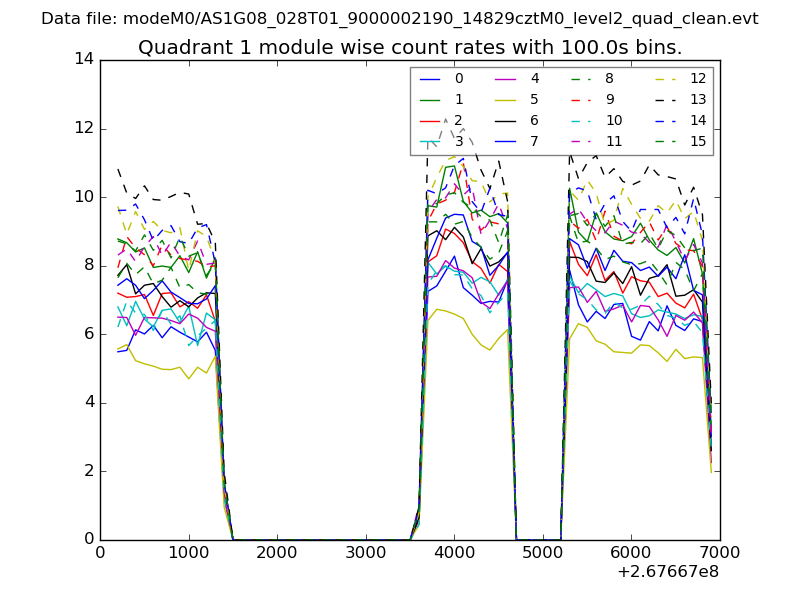 |
 |
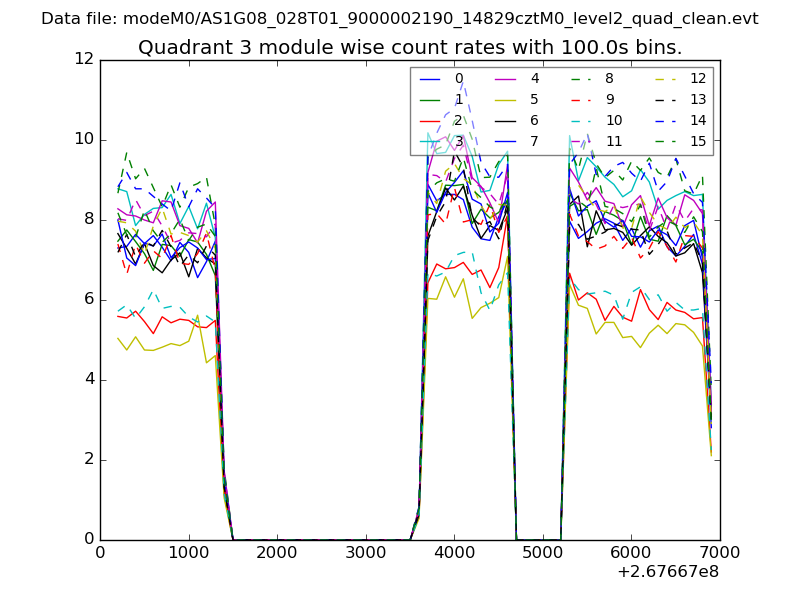
| Module-wise count rates for Quadrant C Data is divided into 100 sec bins |
 |
 |
| Module-wise count rates for Quadrant D Data is divided into 100 sec bins |
 |
 |
| Parameter | Plot |
|---|---|
| CZT HV Monitor |  |
| D_VDD | 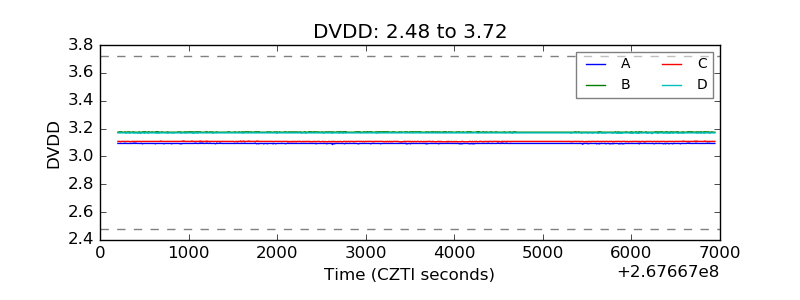 |
| Temperature 1 |  |
| Veto HV Monitor | 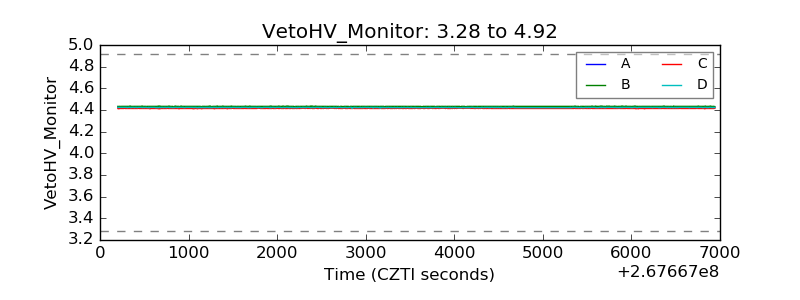 |
| Veto LLD | 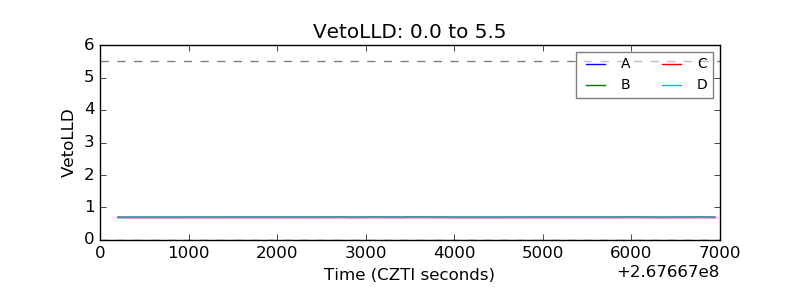 |
| Alpha Counter | 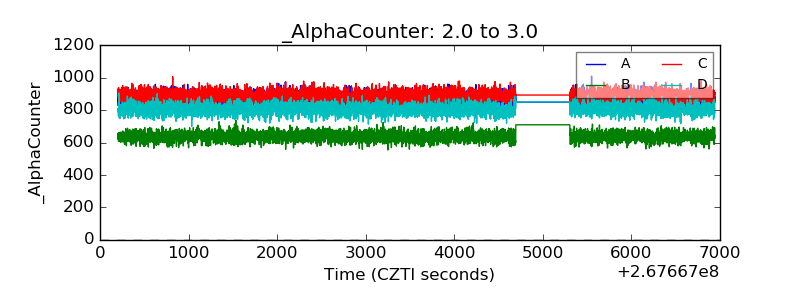 |
| _CPM_Rate | 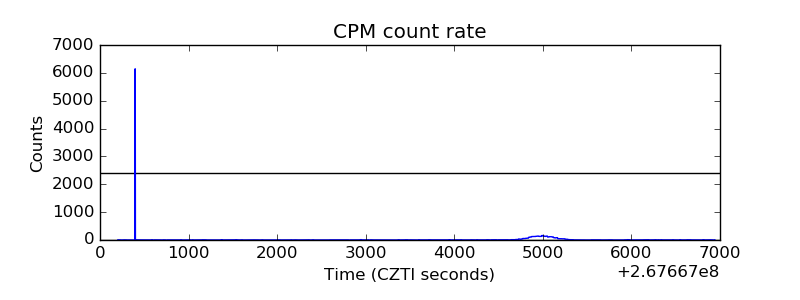 |
| CZT Counter | 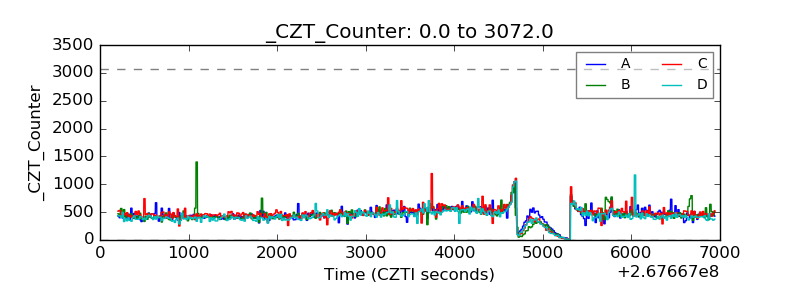 |
| +2.5 Volts monitor |  |
| +5 Volts monitor |  |
| _ROLL_ROT | 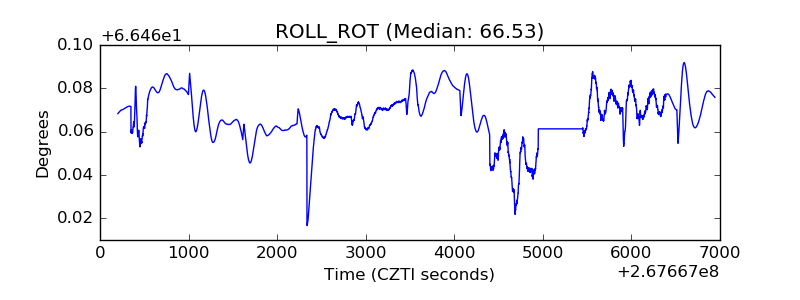 |
| _Roll_DEC | 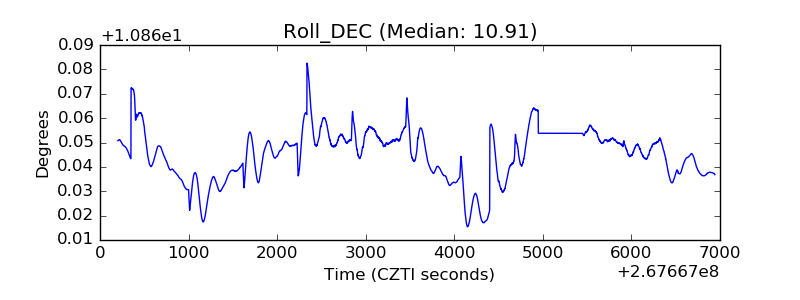 |
| _Roll_RA | 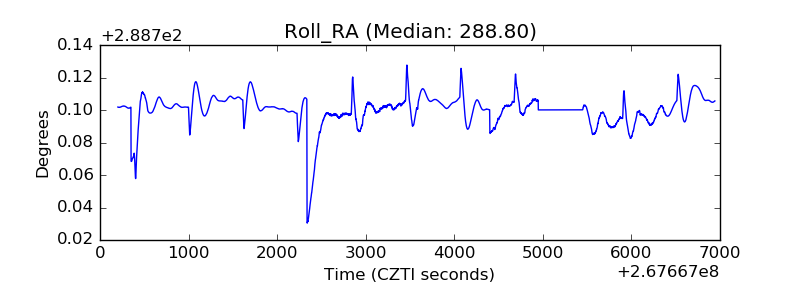 |
| Veto Counter | 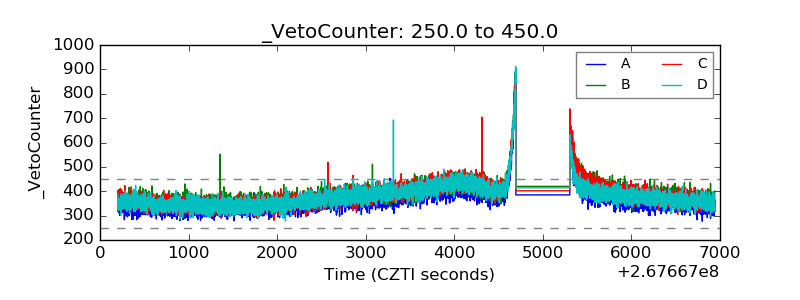 |