| Param | Original file | Final file |
|---|---|---|
| Filename | modeM0/AS1G08_028T01_9000002190_14830cztM0_level2.evt | modeM0/AS1G08_028T01_9000002190_14830cztM0_level2_quad_clean.evt |
| Size (bytes) | 506,122,560 | 107,524,800 |
| Size | 482.7 MB | 102.5 MB |
| Events in quadrant A | 3,740,300 | 696,374 |
| Events in quadrant B | 3,835,977 | 694,416 |
| Events in quadrant C | 3,783,212 | 677,914 |
| Events in quadrant D | 3,459,211 | 665,942 |
| Mode SS | |||
|---|---|---|---|
| Quadrant | BADHDUFLAG | Total packets | Discarded packets |
| A | 0 | 154 | 0 |
| B | 0 | 154 | 0 |
| C | 0 | 154 | 0 |
| D | 0 | 154 | 0 |
| Mode M9 | |||
|---|---|---|---|
| Quadrant | BADHDUFLAG | Total packets | Discarded packets |
| A | 0 | 14 | 0 |
| B | 0 | 14 | 0 |
| C | 0 | 14 | 0 |
| D | 0 | 14 | 0 |
| Mode M0 | |||
|---|---|---|---|
| Quadrant | BADHDUFLAG | Total packets | Discarded packets |
| A | 0 | 15636 | 3 |
| B | 0 | 16112 | 2 |
| C | 0 | 15676 | 2 |
| D | 0 | 15524 | 2 |
| Quadrant | Total seconds | Saturated seconds | Saturation percentage |
|---|---|---|---|
| A | 7499 | 67 | 0.893452% |
| B | 7499 | 130 | 1.733564% |
| C | 7499 | 51 | 0.680091% |
| D | 7499 | 59 | 0.786772% |
Noise dominated data is calculated using 1-second bins in cleaned event files. If a bin has >2000 counts, and if more than 50% of those come from <1% of pixels, then it is considered to be noise-dominated and hence unusable.
| Quadrant | # 1 sec bins | Bins with >0 counts | Bins with >2000 counts | High rate bins dominated by noise | Noise dominated (total time) | Noise dominated (detector-on time) | Marked lightcurve |
|---|---|---|---|---|---|---|---|
| A | 8895 | 7502 | 0 | 0 | 0.00% | 0.00% | 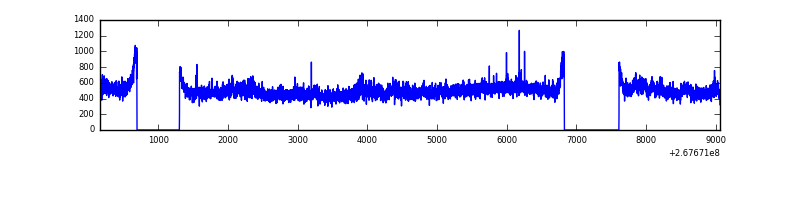 |
| B | 8895 | 7502 | 15 | 15 | 0.17% | 0.20% | 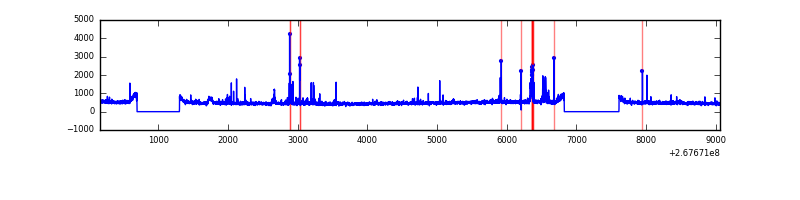 |
| C | 8895 | 7502 | 0 | 0 | 0.00% | 0.00% | 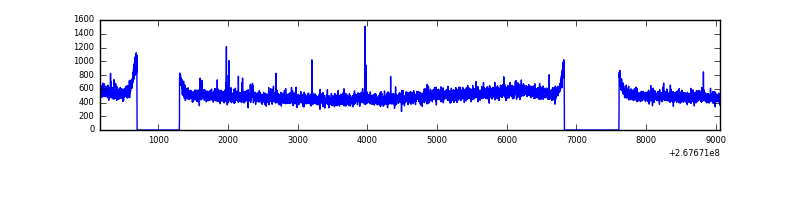 |
| D | 8895 | 7502 | 10 | 10 | 0.11% | 0.13% | 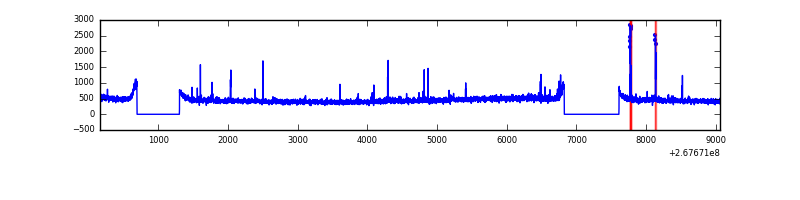 |
Top three noisy pixels from each quadrant. If the there are fewer than three noisy pixels in the level2.evt file, extra rows are filled as -1
| Pixel properties | Quadrant properties | ||||||
|---|---|---|---|---|---|---|---|
| Quadrant | DetID | PixID | Counts | Sigma | Mean | Median | Sigma |
| A | 12 | 189 | 204288 | 1088.64 | 916 | 895 | 186.8 |
| A | 0 | 226 | 7968 | 37.86 | 916 | 895 | 186.8 |
| A | 12 | 194 | 6678 | 30.95 | 916 | 895 | 186.8 |
| B | 3 | 64 | 179907 | 1008.8 | 911 | 889 | 177.5 |
| B | 0 | 219 | 35918 | 197.4 | 911 | 889 | 177.5 |
| B | 12 | 111 | 21583 | 116.62 | 911 | 889 | 177.5 |
| C | 3 | 233 | 317481 | 1541.89 | 884 | 890 | 205.3 |
| C | 6 | 96 | 14311 | 65.36 | 884 | 890 | 205.3 |
| C | 13 | 61 | 6273 | 26.22 | 884 | 890 | 205.3 |
| D | 13 | 249 | 36935 | 167.38 | 887 | 859 | 215.5 |
| D | 7 | 254 | 34394 | 155.59 | 887 | 859 | 215.5 |
| D | 2 | 234 | 27406 | 123.17 | 887 | 859 | 215.5 |
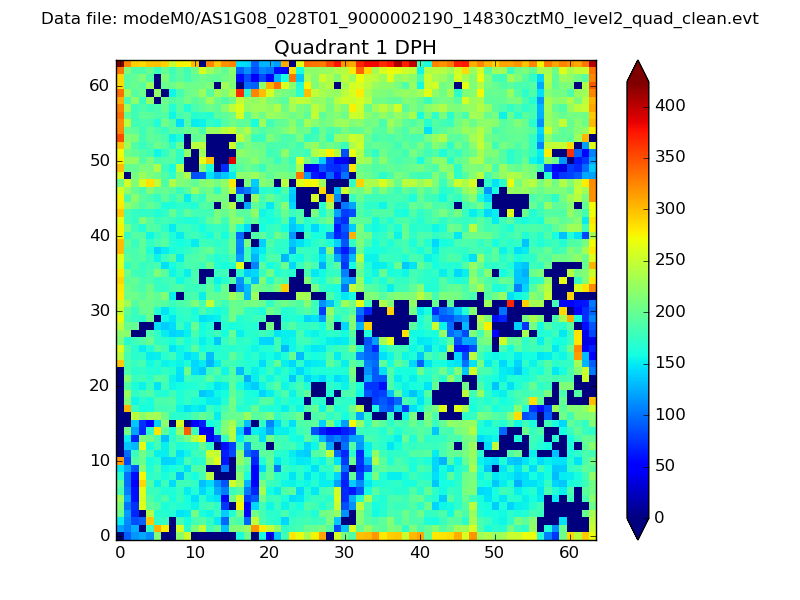
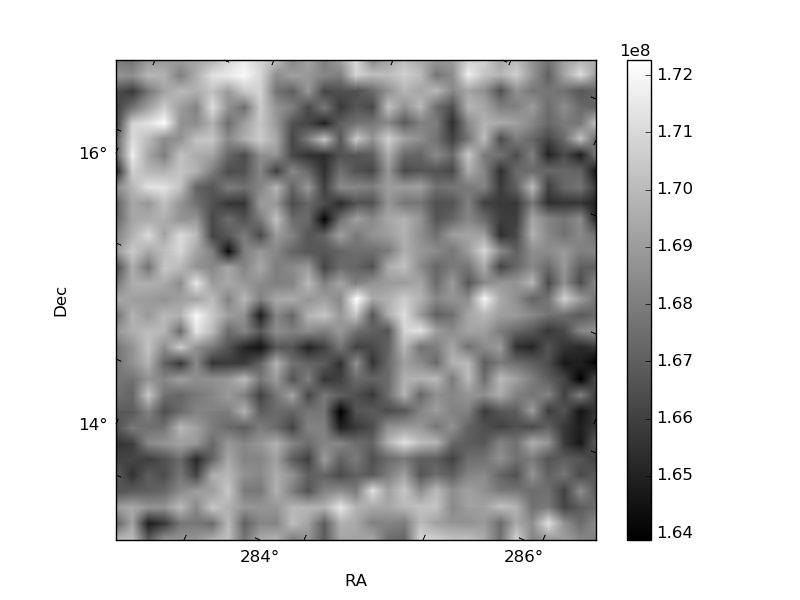
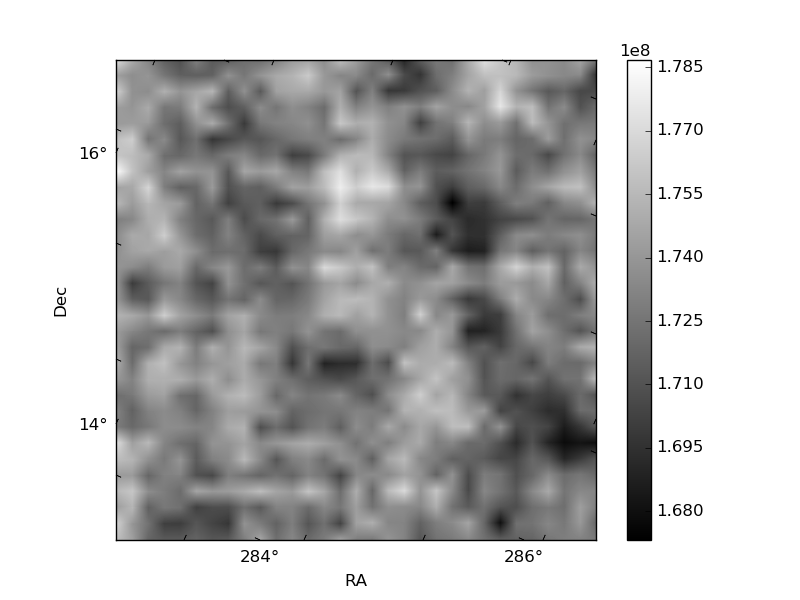
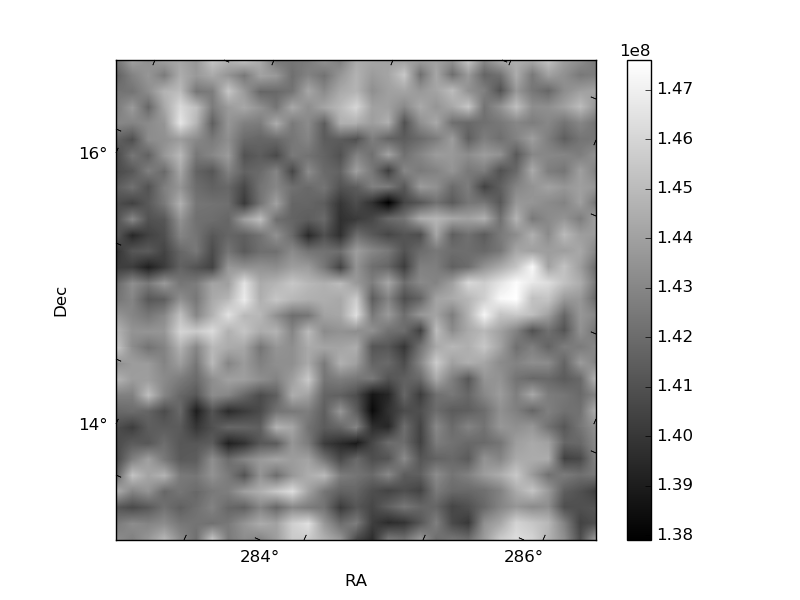
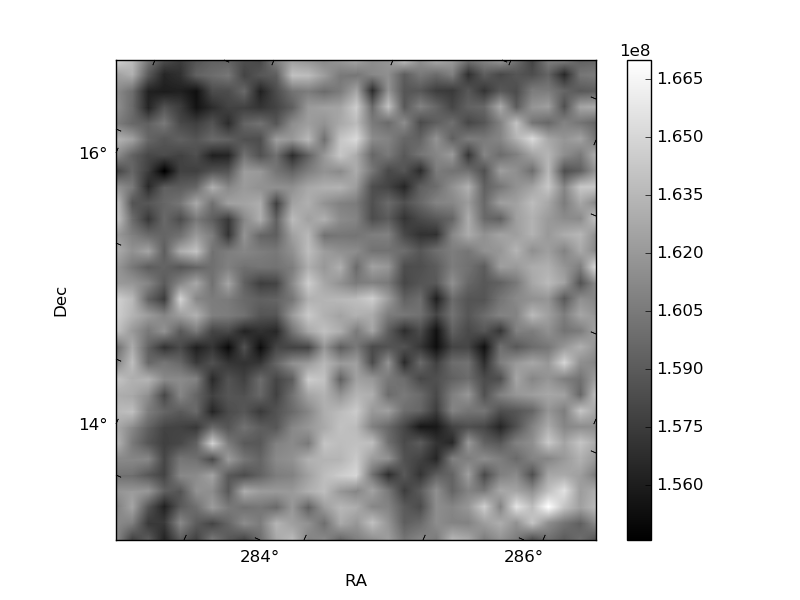
Histogram calculated using DETX and DETY for each event in the final _common_clean file
| Quadrant A |  |
 |
Quadrant B |
|---|---|---|---|
| Quadrant D | 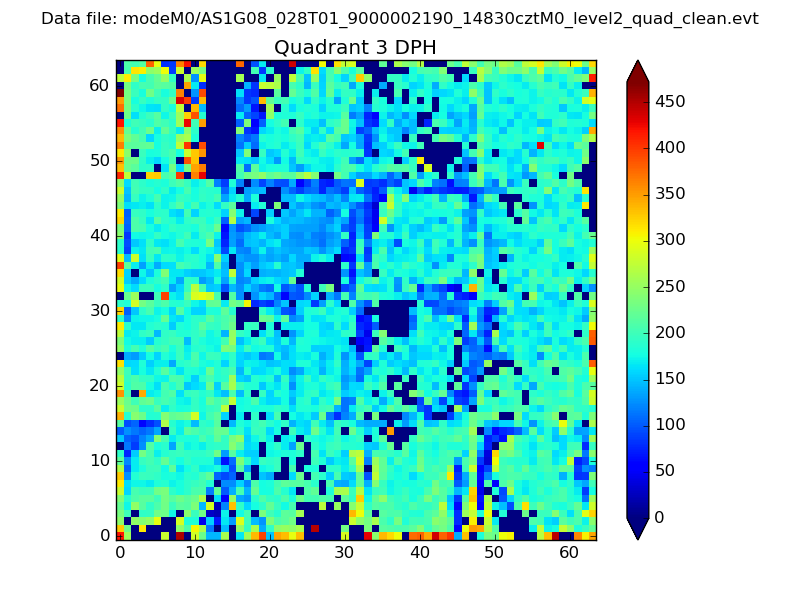 |
 |
Quadrant C |
| Plot type | Count rate plots | Images |
|---|---|---|
| Comparison with Poisson distribution Blue bars denote a histogram of data divided into 1 sec bins. Red curve is a Poisson curve with rate = median count rate of data. |
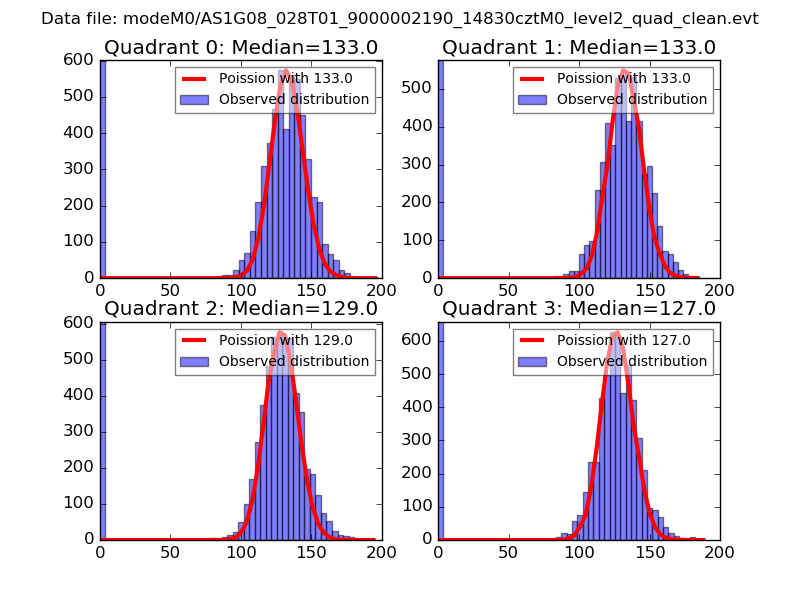 |
 |
| Quadrant-wise count rates Data is divided into 100 sec bins |
 |
|
| Module-wise count rates for Quadrant A Data is divided into 100 sec bins |
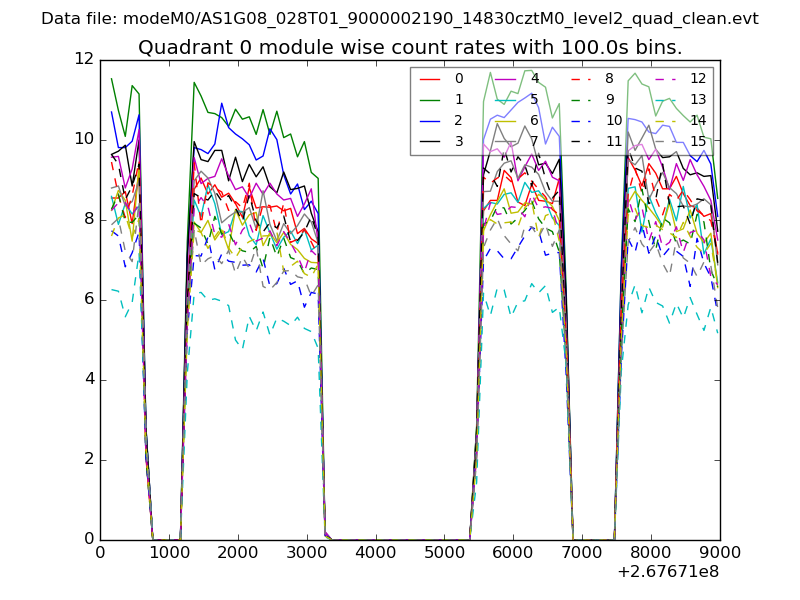 |
 |
| Module-wise count rates for Quadrant B Data is divided into 100 sec bins |
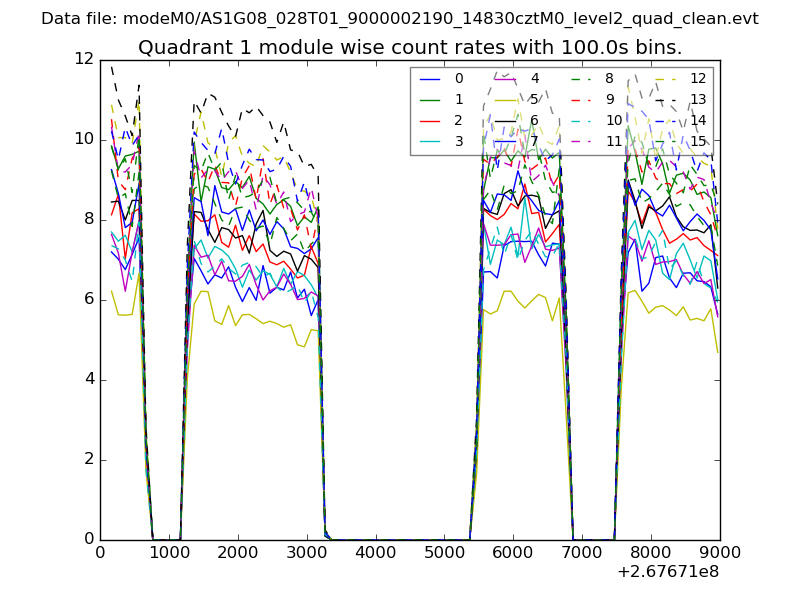 |
 |
| Module-wise count rates for Quadrant C Data is divided into 100 sec bins |
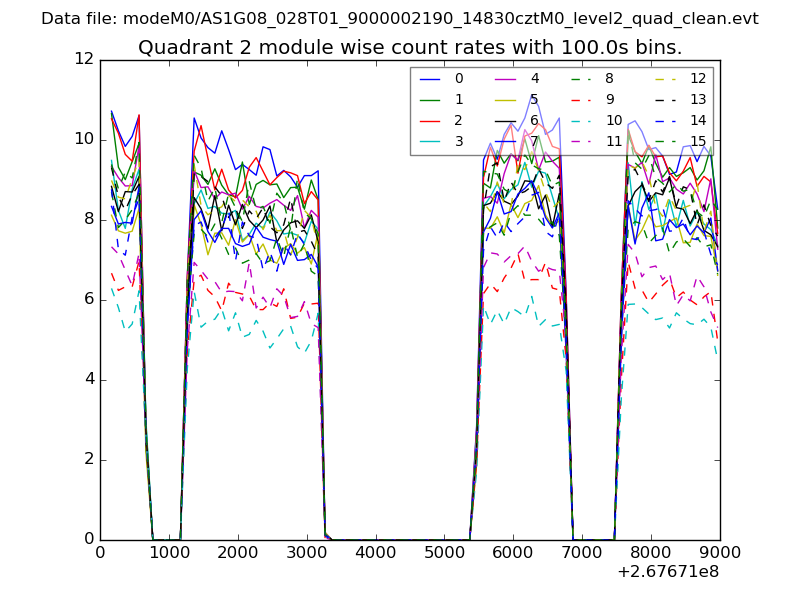 |
 |
| Module-wise count rates for Quadrant D Data is divided into 100 sec bins |
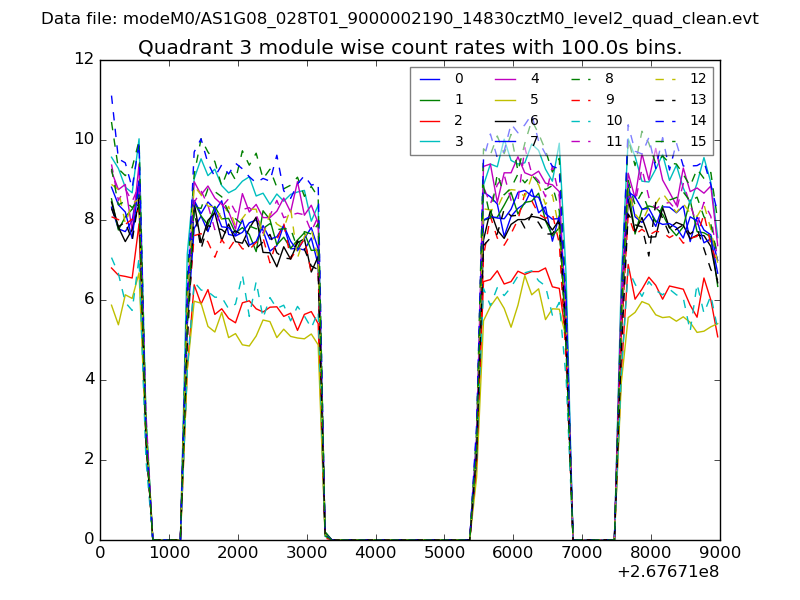 |
 |
| Parameter | Plot |
|---|---|
| CZT HV Monitor | 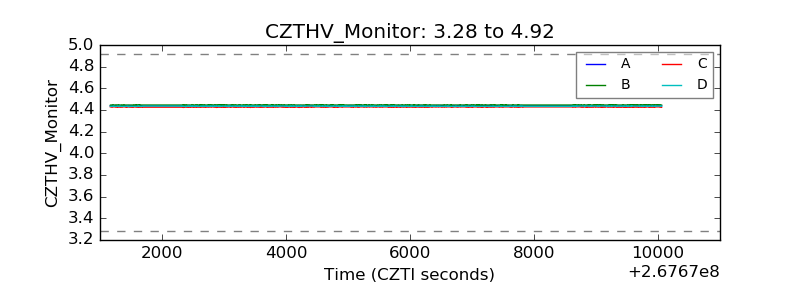 |
| D_VDD | 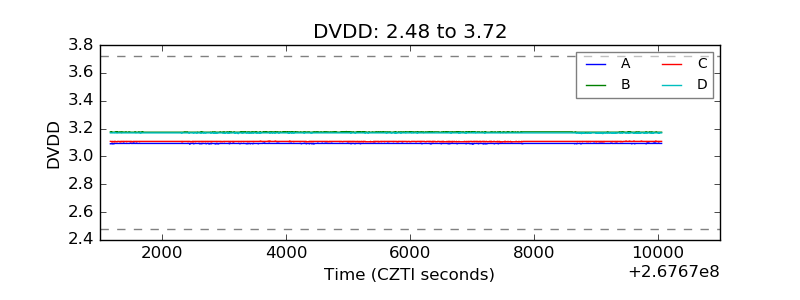 |
| Temperature 1 | 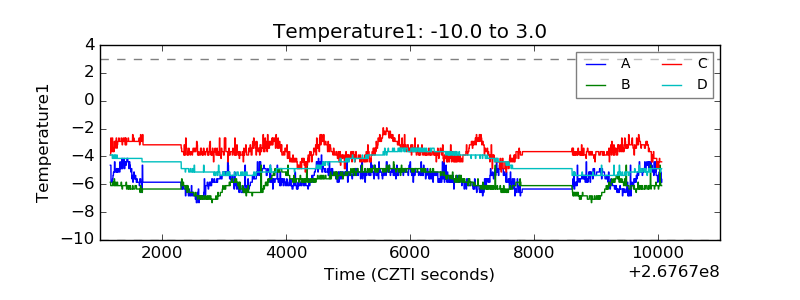 |
| Veto HV Monitor | 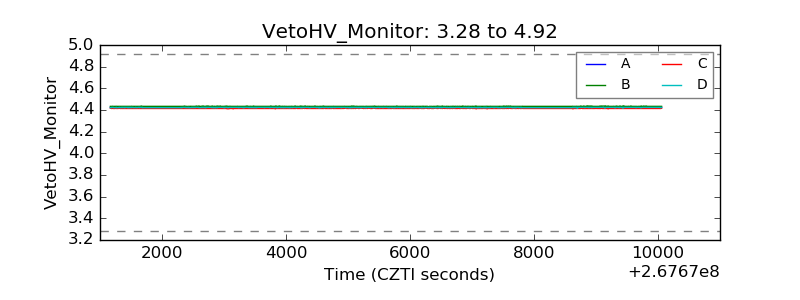 |
| Veto LLD | 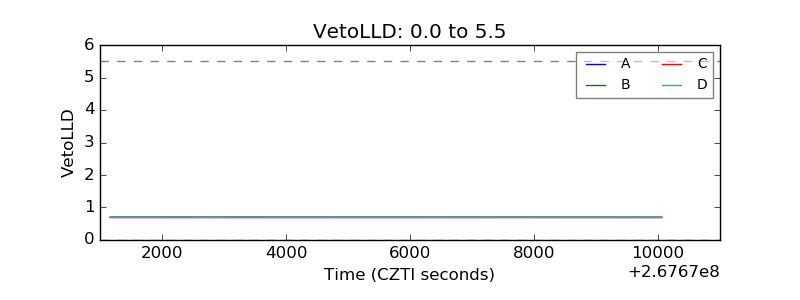 |
| Alpha Counter | 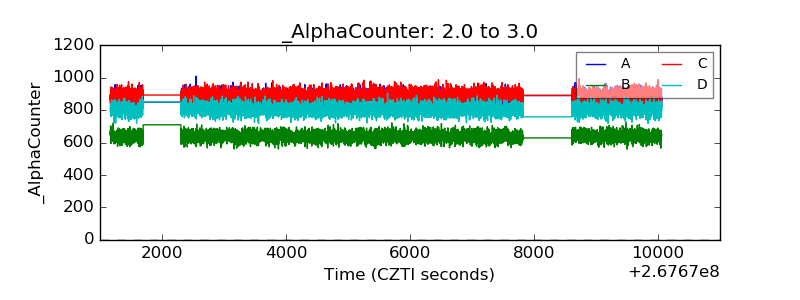 |
| _CPM_Rate | 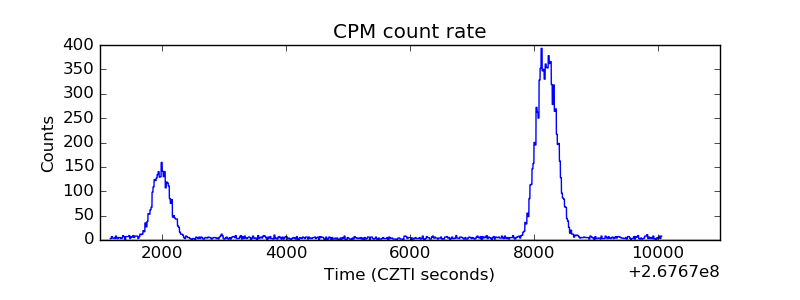 |
| CZT Counter | 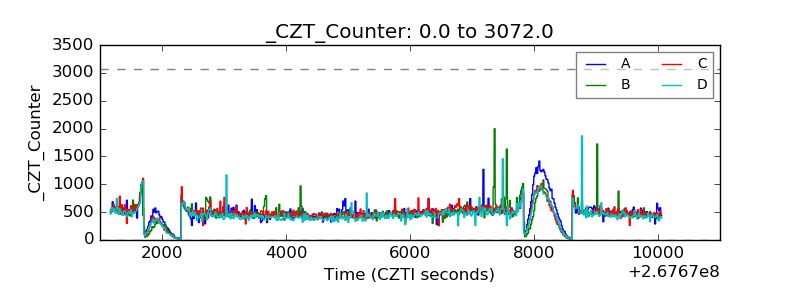 |
| +2.5 Volts monitor |  |
| +5 Volts monitor | 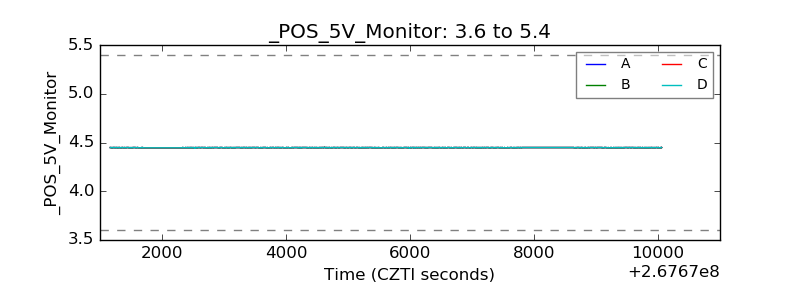 |
| _ROLL_ROT | 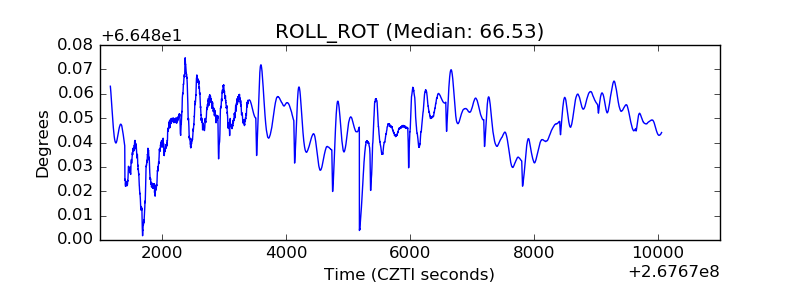 |
| _Roll_DEC | 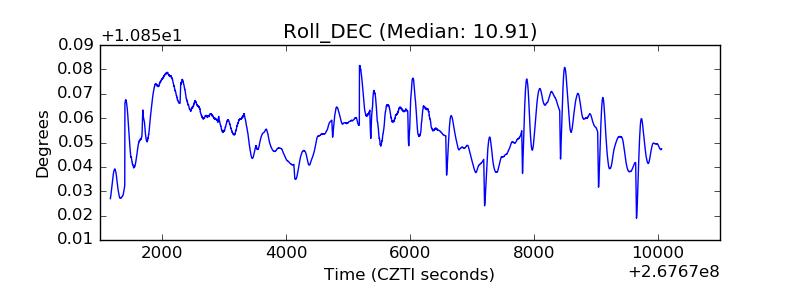 |
| _Roll_RA | 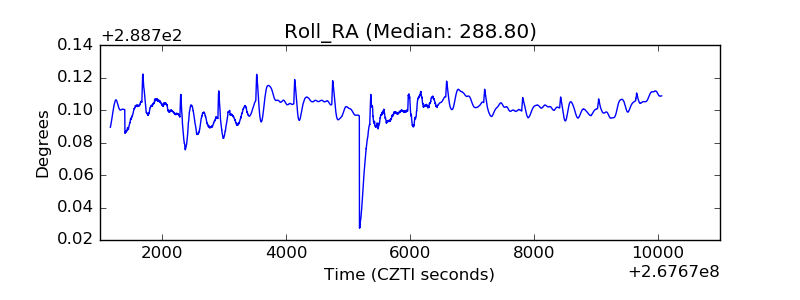 |
| Veto Counter | 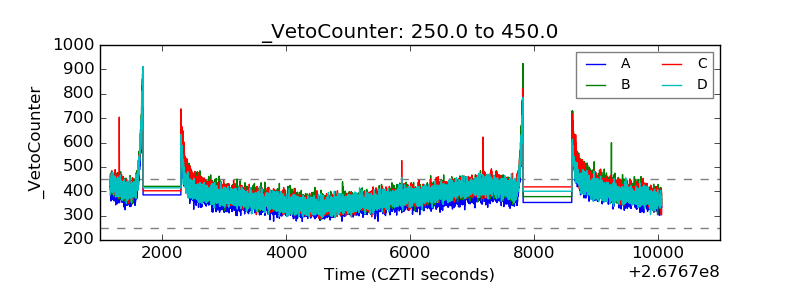 |