| Param | Original file | Final file |
|---|---|---|
| Filename | modeM0/AS1G08_028T01_9000002190_14834cztM0_level2.evt | modeM0/AS1G08_028T01_9000002190_14834cztM0_level2_quad_clean.evt |
| Size (bytes) | 218,093,760 | 26,035,200 |
| Size | 208.0 MB | 24.8 MB |
| Events in quadrant A | 1,614,188 | 144,175 |
| Events in quadrant B | 1,649,024 | 145,558 |
| Events in quadrant C | 1,616,227 | 137,376 |
| Events in quadrant D | 1,506,424 | 133,435 |
| Mode SS | |||
|---|---|---|---|
| Quadrant | BADHDUFLAG | Total packets | Discarded packets |
| A | 0 | 64 | 0 |
| B | 0 | 64 | 0 |
| C | 0 | 64 | 0 |
| D | 0 | 64 | 0 |
| Mode M0 | |||
|---|---|---|---|
| Quadrant | BADHDUFLAG | Total packets | Discarded packets |
| A | 0 | 6643 | 0 |
| B | 0 | 6768 | 0 |
| C | 0 | 6632 | 0 |
| D | 0 | 6548 | 0 |
| Quadrant | Total seconds | Saturated seconds | Saturation percentage |
|---|---|---|---|
| A | 3194 | 3 | 0.093926% |
| B | 3194 | 11 | 0.344396% |
| C | 3194 | 0 | 0.000000% |
| D | 3194 | 5 | 0.156544% |
Noise dominated data is calculated using 1-second bins in cleaned event files. If a bin has >2000 counts, and if more than 50% of those come from <1% of pixels, then it is considered to be noise-dominated and hence unusable.
| Quadrant | # 1 sec bins | Bins with >0 counts | Bins with >2000 counts | High rate bins dominated by noise | Noise dominated (total time) | Noise dominated (detector-on time) | Marked lightcurve |
|---|---|---|---|---|---|---|---|
| A | 3195 | 3195 | 0 | 0 | 0.00% | 0.00% | 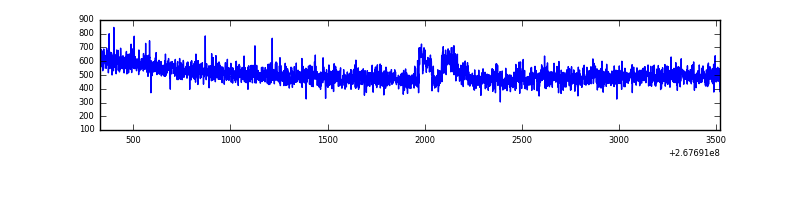 |
| B | 3195 | 3195 | 3 | 3 | 0.09% | 0.09% | 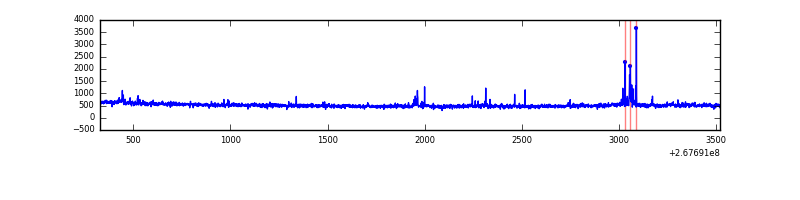 |
| C | 3195 | 3195 | 0 | 0 | 0.00% | 0.00% | 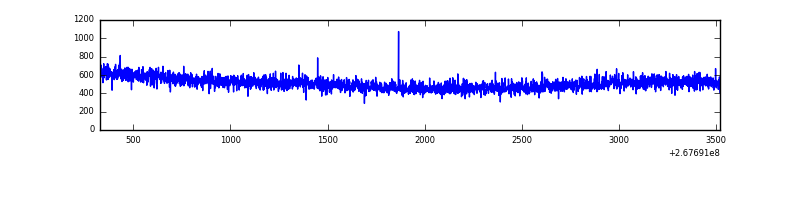 |
| D | 3195 | 3195 | 4 | 4 | 0.13% | 0.13% | 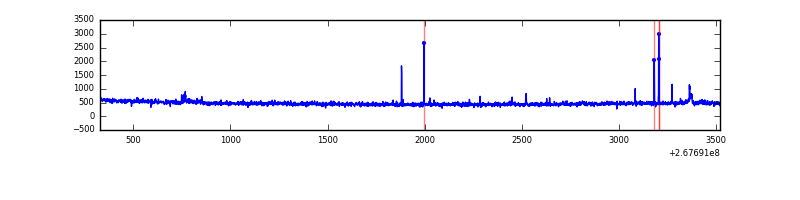 |
Top three noisy pixels from each quadrant. If the there are fewer than three noisy pixels in the level2.evt file, extra rows are filled as -1
| Pixel properties | Quadrant properties | ||||||
|---|---|---|---|---|---|---|---|
| Quadrant | DetID | PixID | Counts | Sigma | Mean | Median | Sigma |
| A | 12 | 189 | 37990 | 451.49 | 410 | 403 | 83.3 |
| A | 0 | 226 | 3513 | 37.36 | 410 | 403 | 83.3 |
| A | 12 | 194 | 2909 | 30.1 | 410 | 403 | 83.3 |
| B | 4 | 173 | 25678 | 322.88 | 405 | 397 | 78.3 |
| B | 0 | 189 | 18860 | 235.81 | 405 | 397 | 78.3 |
| B | 0 | 219 | 13699 | 169.89 | 405 | 397 | 78.3 |
| C | 3 | 233 | 120067 | 1339.1 | 383 | 387 | 89.4 |
| C | 13 | 61 | 2652 | 25.34 | 383 | 387 | 89.4 |
| C | 14 | 234 | 1657 | 14.21 | 383 | 387 | 89.4 |
| D | 7 | 254 | 16606 | 172.52 | 387 | 378 | 94.1 |
| D | 13 | 249 | 16419 | 170.53 | 387 | 378 | 94.1 |
| D | 2 | 234 | 10529 | 107.91 | 387 | 378 | 94.1 |
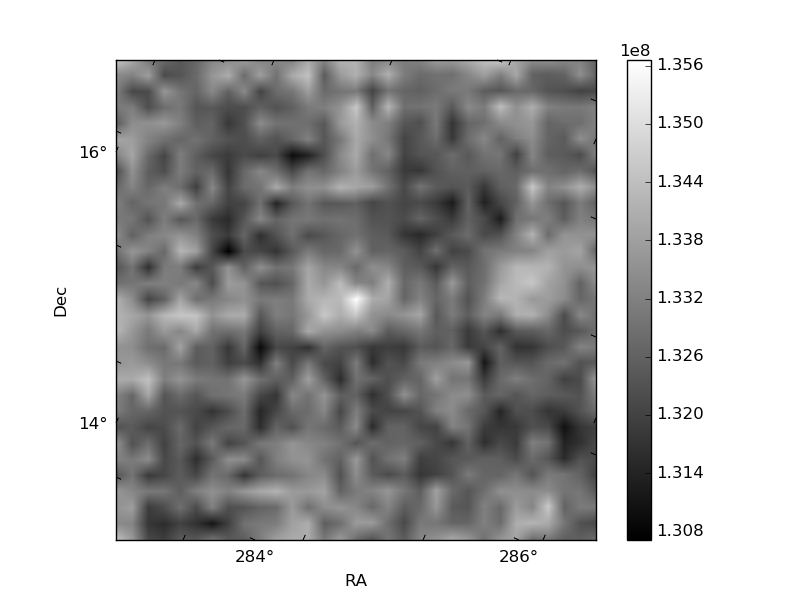
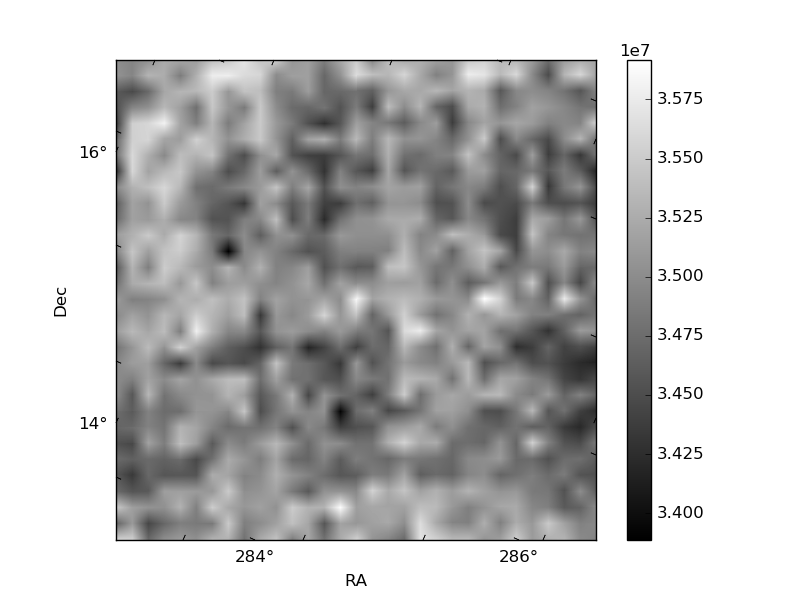
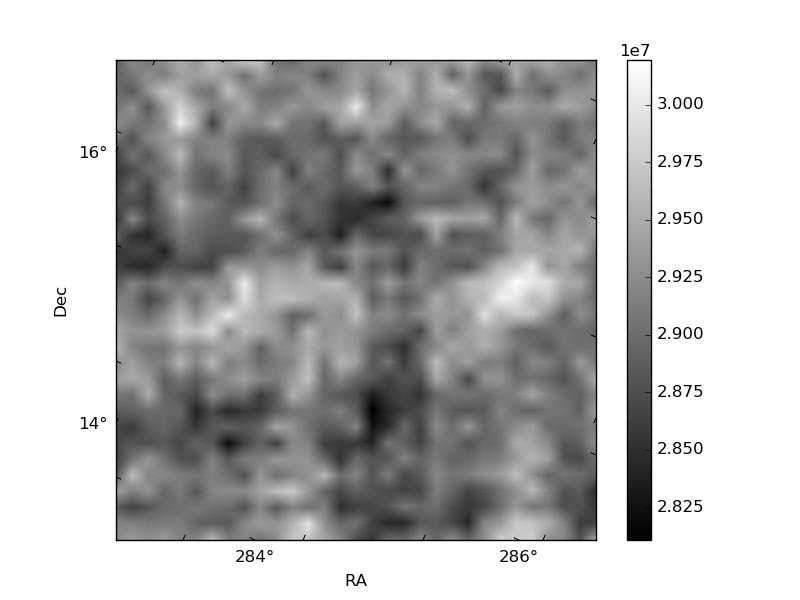
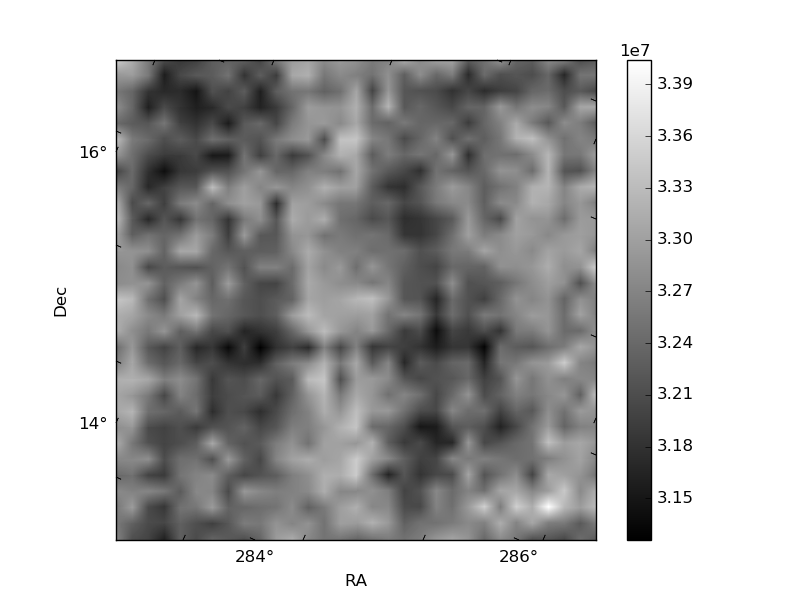
Histogram calculated using DETX and DETY for each event in the final _common_clean file
| Quadrant A | 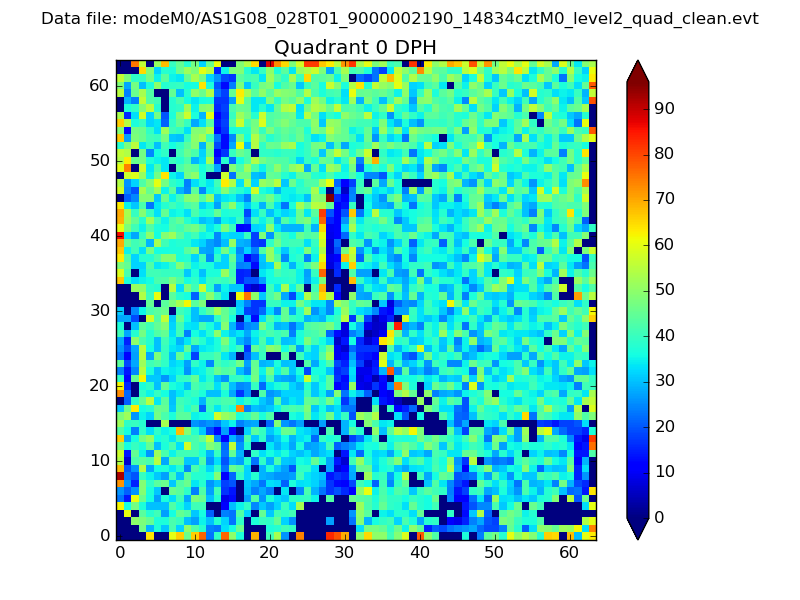 |
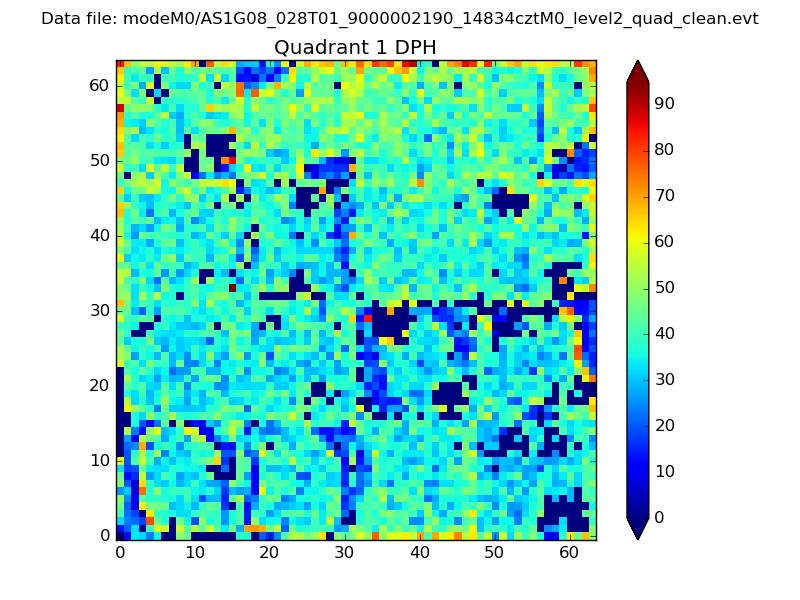 |
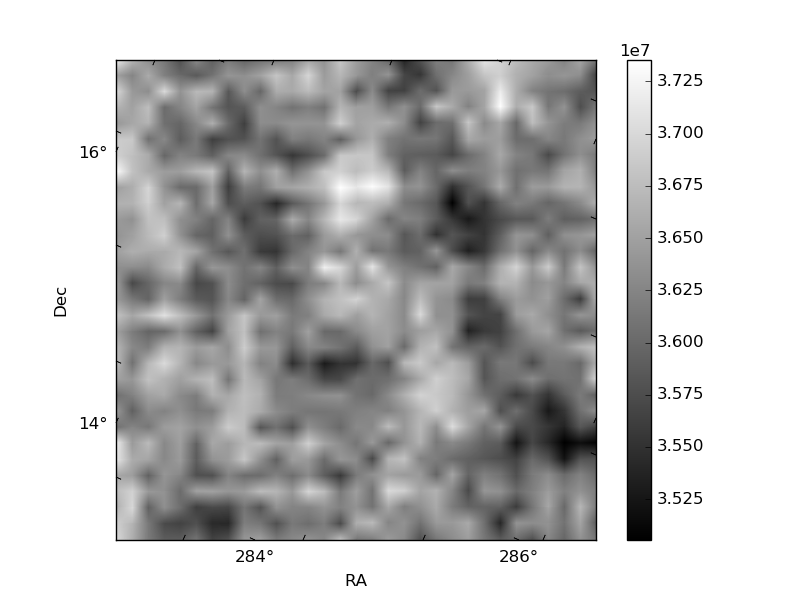
Quadrant B |
|---|---|---|---|
| Quadrant D | 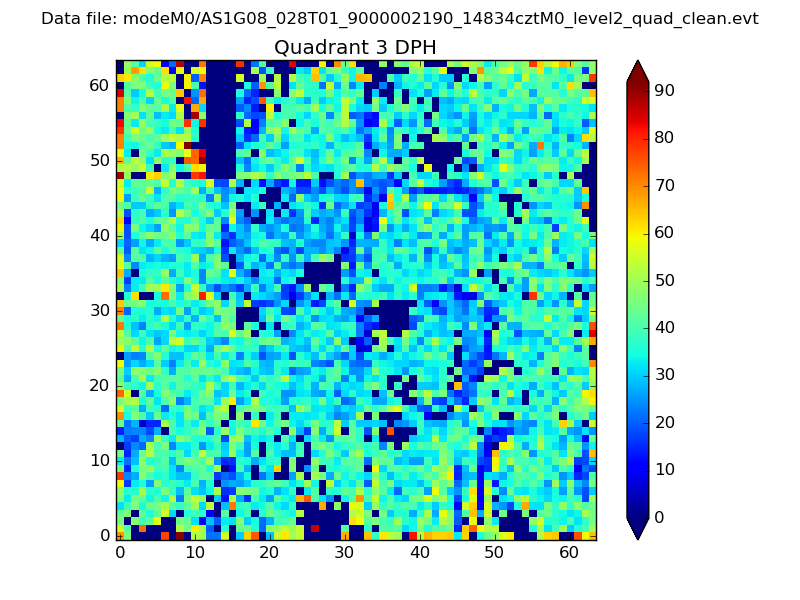 |
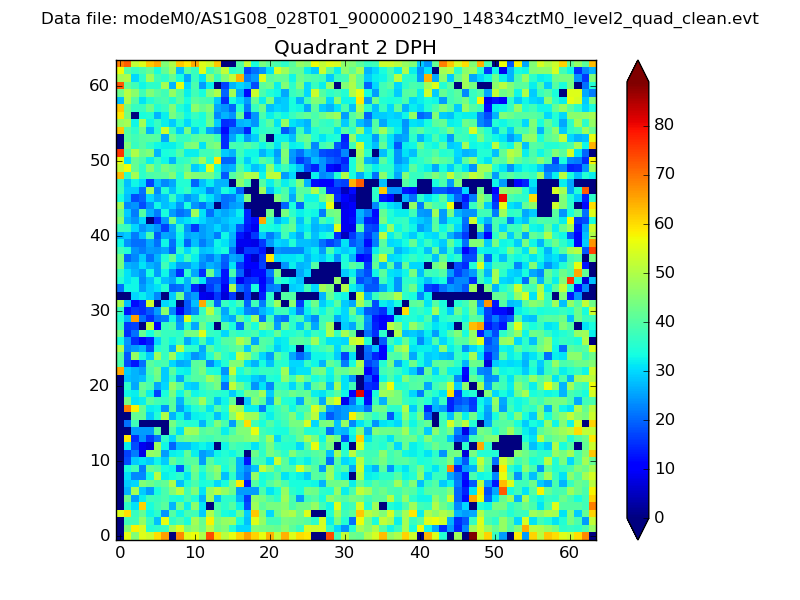 |
Quadrant C |
| Plot type | Count rate plots | Images |
|---|---|---|
| Comparison with Poisson distribution Blue bars denote a histogram of data divided into 1 sec bins. Red curve is a Poisson curve with rate = median count rate of data. |
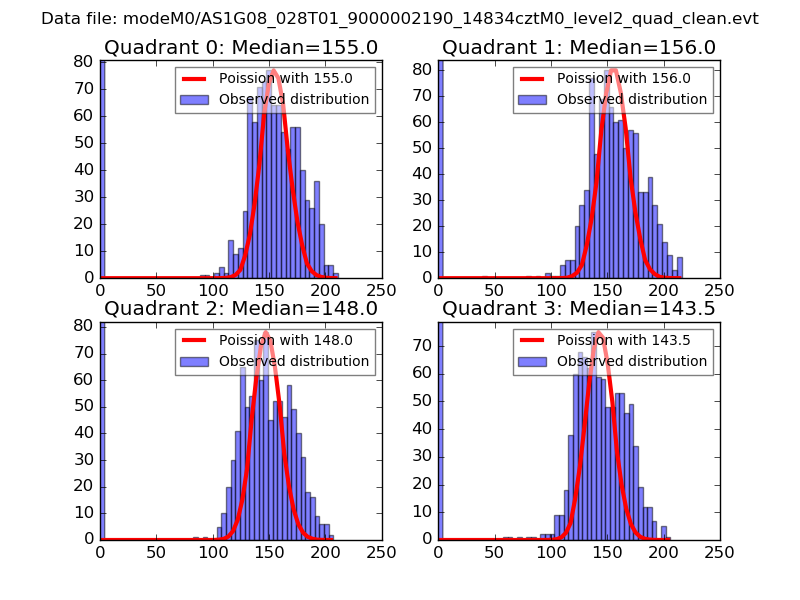 |
 |
| Quadrant-wise count rates Data is divided into 100 sec bins |
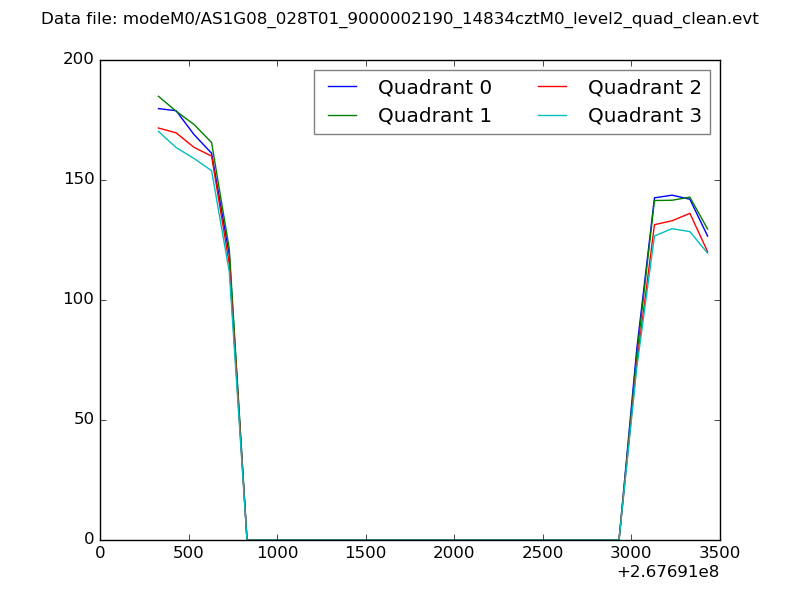 |
|
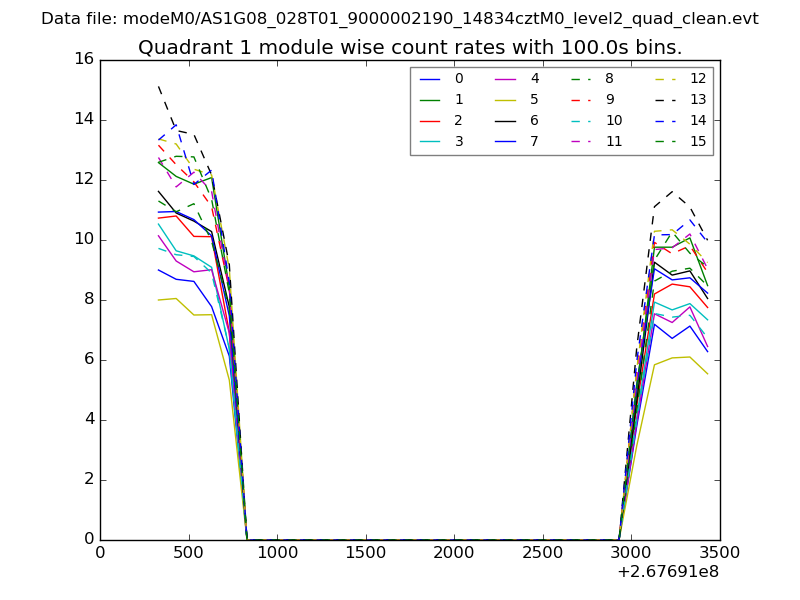
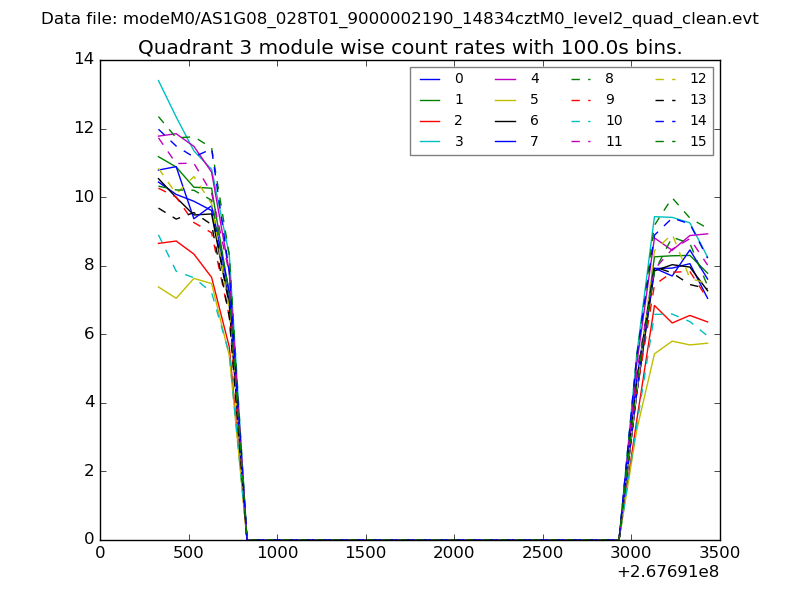
| Module-wise count rates for Quadrant A Data is divided into 100 sec bins |
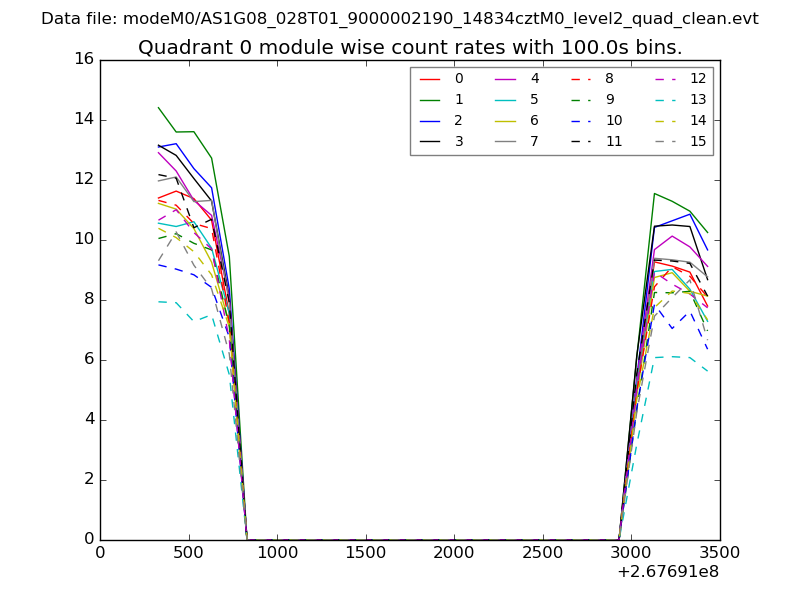 |
 |
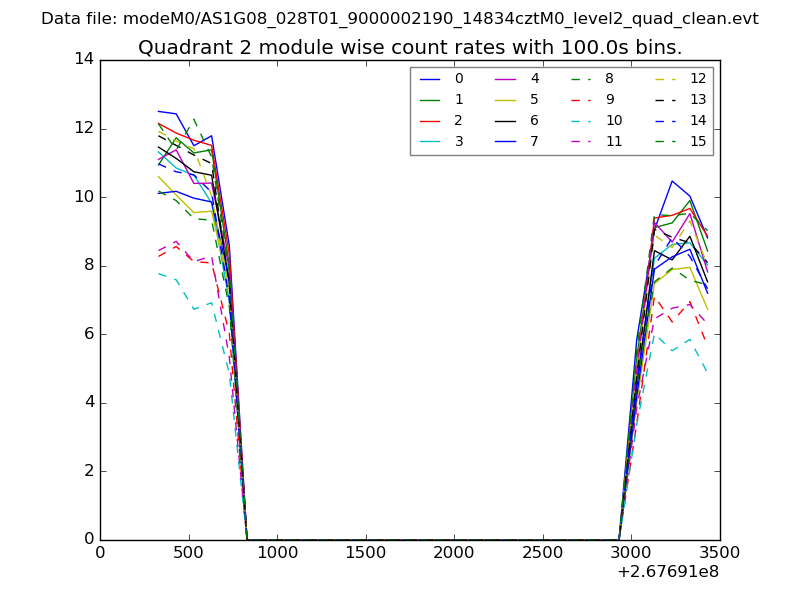
| Module-wise count rates for Quadrant B Data is divided into 100 sec bins |
 |
 |
| Module-wise count rates for Quadrant C Data is divided into 100 sec bins |
 |
 |
| Module-wise count rates for Quadrant D Data is divided into 100 sec bins |
 |
 |
| Parameter | Plot |
|---|---|
| CZT HV Monitor | 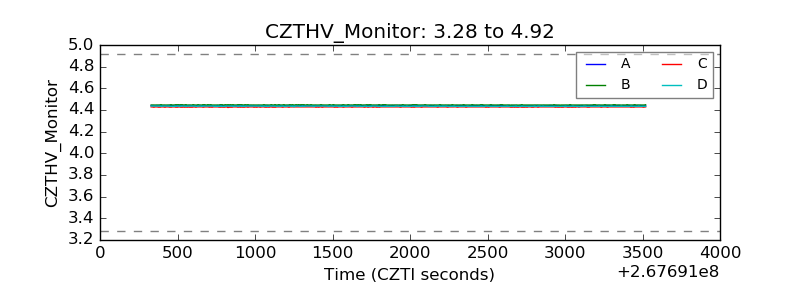 |
| D_VDD | 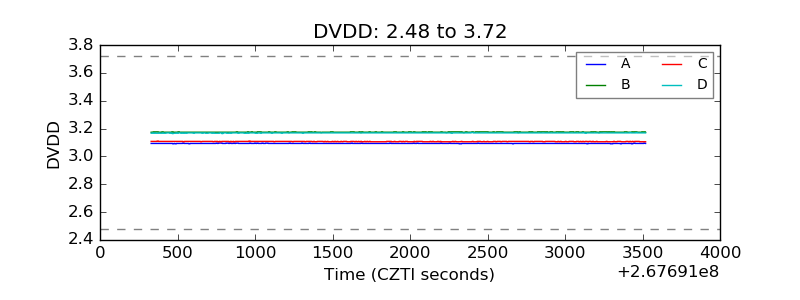 |
| Temperature 1 | 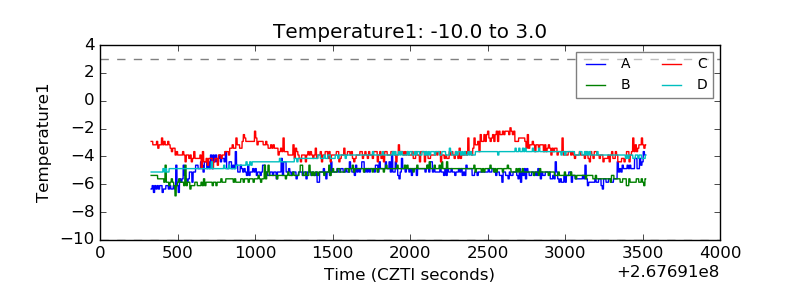 |
| Veto HV Monitor |  |
| Veto LLD | 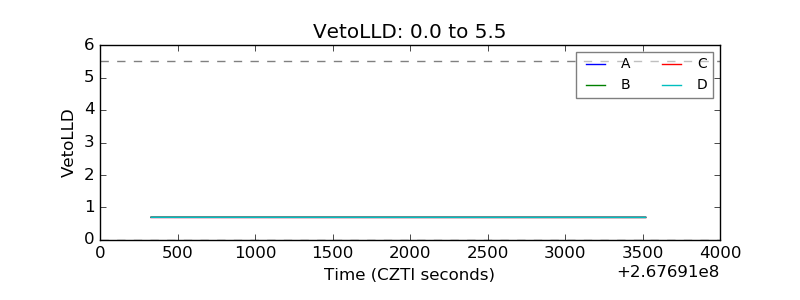 |
| Alpha Counter |  |
| _CPM_Rate |  |
| CZT Counter | 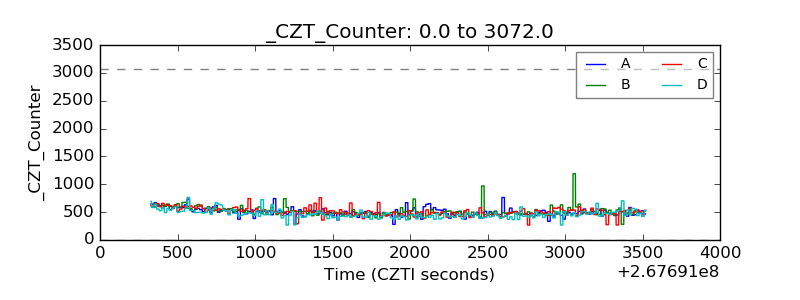 |
| +2.5 Volts monitor |  |
| +5 Volts monitor |  |
| _ROLL_ROT | 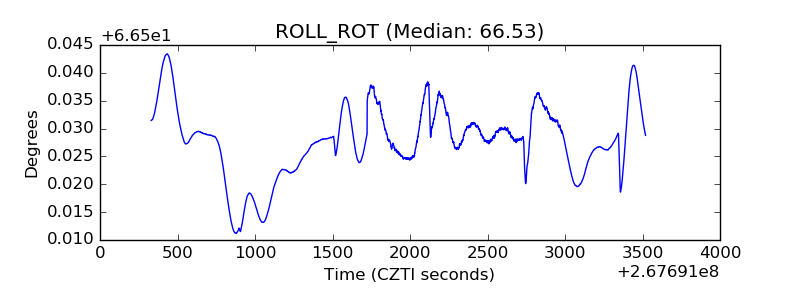 |
| _Roll_DEC | 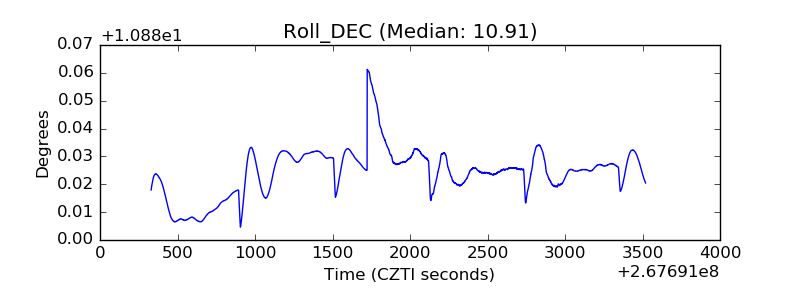 |
| _Roll_RA | 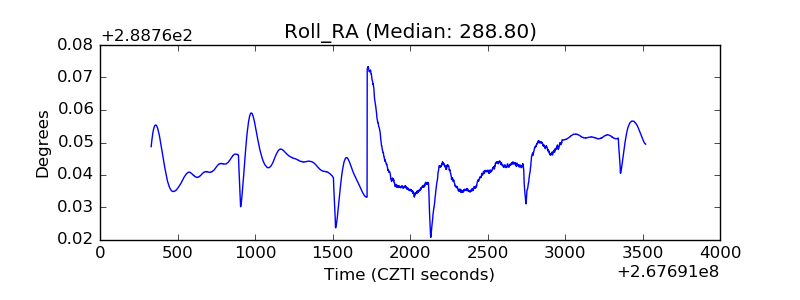 |
| Veto Counter | 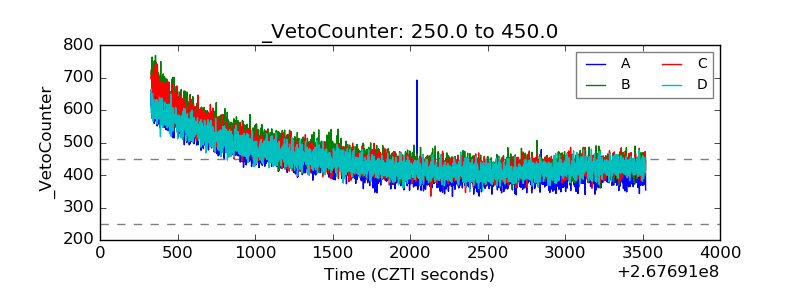 |