| Param | Original file | Final file |
|---|---|---|
| Filename | modeM0/AS1A04_218T01_9000002194_14852cztM0_level2.evt | modeM0/AS1A04_218T01_9000002194_14852cztM0_level2_quad_clean.evt |
| Size (bytes) | 503,697,600 | 115,940,160 |
| Size | 480.4 MB | 110.6 MB |
| Events in quadrant A | 3,609,978 | 778,761 |
| Events in quadrant B | 3,917,936 | 764,092 |
| Events in quadrant C | 3,780,740 | 749,818 |
| Events in quadrant D | 3,483,850 | 744,710 |
| Mode SS | |||
|---|---|---|---|
| Quadrant | BADHDUFLAG | Total packets | Discarded packets |
| A | 0 | 138 | 0 |
| B | 0 | 138 | 0 |
| C | 0 | 138 | 0 |
| D | 0 | 138 | 0 |
| Mode M0 | |||
|---|---|---|---|
| Quadrant | BADHDUFLAG | Total packets | Discarded packets |
| A | 0 | 14852 | 3 |
| B | 0 | 16059 | 2 |
| C | 0 | 15319 | 2 |
| D | 0 | 14801 | 2 |
| Mode M9 | |||
|---|---|---|---|
| Quadrant | BADHDUFLAG | Total packets | Discarded packets |
| A | 0 | 16 | 0 |
| B | 0 | 16 | 0 |
| C | 0 | 16 | 0 |
| D | 0 | 17 | 0 |
| Quadrant | Total seconds | Saturated seconds | Saturation percentage |
|---|---|---|---|
| A | 6803 | 181 | 2.660591% |
| B | 6803 | 205 | 3.013376% |
| C | 6803 | 139 | 2.043216% |
| D | 6803 | 180 | 2.645892% |
Noise dominated data is calculated using 1-second bins in cleaned event files. If a bin has >2000 counts, and if more than 50% of those come from <1% of pixels, then it is considered to be noise-dominated and hence unusable.
| Quadrant | # 1 sec bins | Bins with >0 counts | Bins with >2000 counts | High rate bins dominated by noise | Noise dominated (total time) | Noise dominated (detector-on time) | Marked lightcurve |
|---|---|---|---|---|---|---|---|
| A | 7949 | 6805 | 1 | 1 | 0.01% | 0.01% | 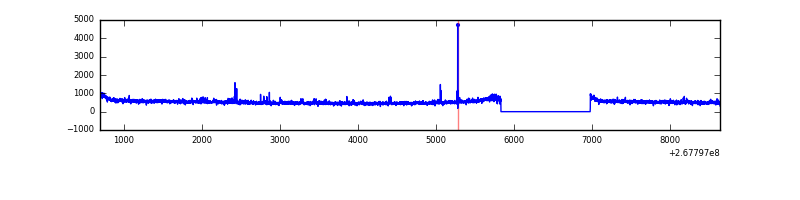 |
| B | 7949 | 6805 | 28 | 28 | 0.35% | 0.41% | 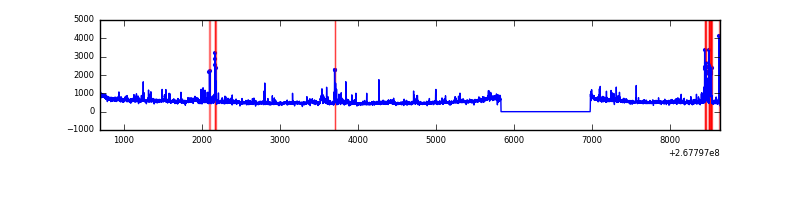 |
| C | 7949 | 6805 | 3 | 3 | 0.04% | 0.04% | 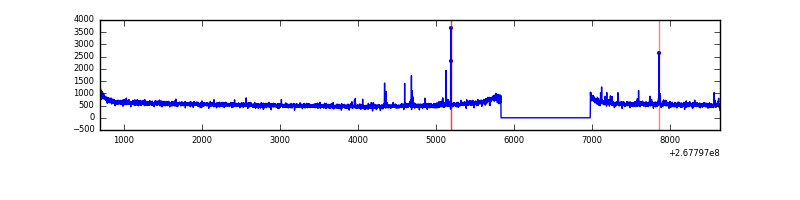 |
| D | 7949 | 6805 | 33 | 33 | 0.42% | 0.48% | 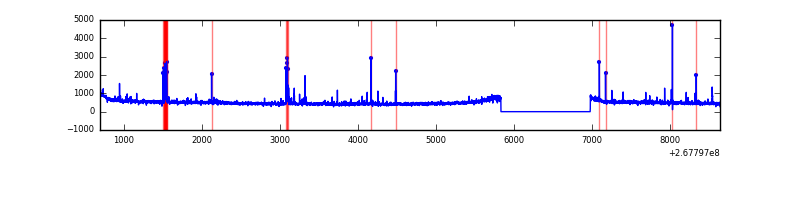 |
Top three noisy pixels from each quadrant. If the there are fewer than three noisy pixels in the level2.evt file, extra rows are filled as -1
| Pixel properties | Quadrant properties | ||||||
|---|---|---|---|---|---|---|---|
| Quadrant | DetID | PixID | Counts | Sigma | Mean | Median | Sigma |
| A | 12 | 189 | 86372 | 469.43 | 903 | 885 | 182.1 |
| A | 9 | 143 | 31258 | 166.78 | 903 | 885 | 182.1 |
| A | 15 | 239 | 9256 | 45.96 | 903 | 885 | 182.1 |
| B | 3 | 64 | 166077 | 998.19 | 881 | 860 | 165.5 |
| B | 0 | 219 | 68549 | 408.96 | 881 | 860 | 165.5 |
| B | 0 | 229 | 62809 | 374.28 | 881 | 860 | 165.5 |
| C | 3 | 233 | 374470 | 1913.44 | 855 | 860 | 195.3 |
| C | 6 | 96 | 65133 | 329.17 | 855 | 860 | 195.3 |
| C | 13 | 61 | 6261 | 27.66 | 855 | 860 | 195.3 |
| D | 7 | 254 | 79008 | 374.79 | 870 | 847 | 208.5 |
| D | 7 | 38 | 58461 | 276.27 | 870 | 847 | 208.5 |
| D | 2 | 120 | 27539 | 127.99 | 870 | 847 | 208.5 |
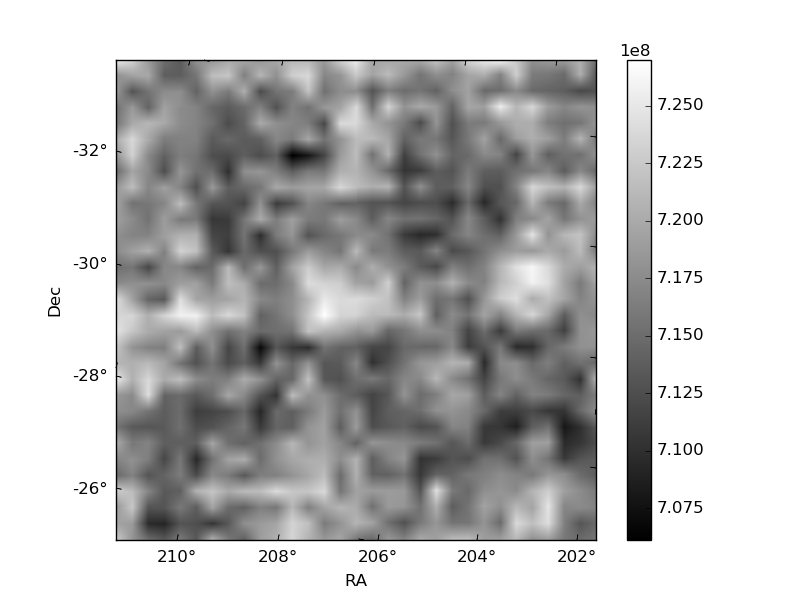
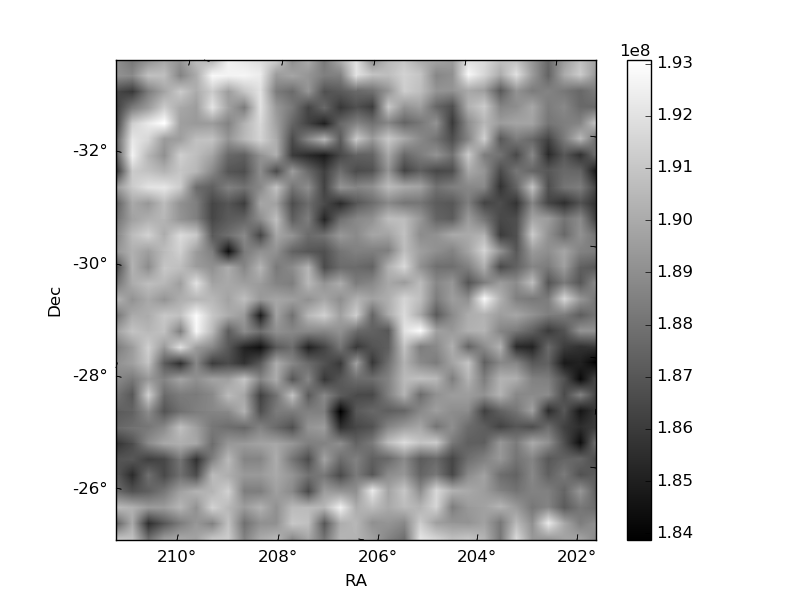
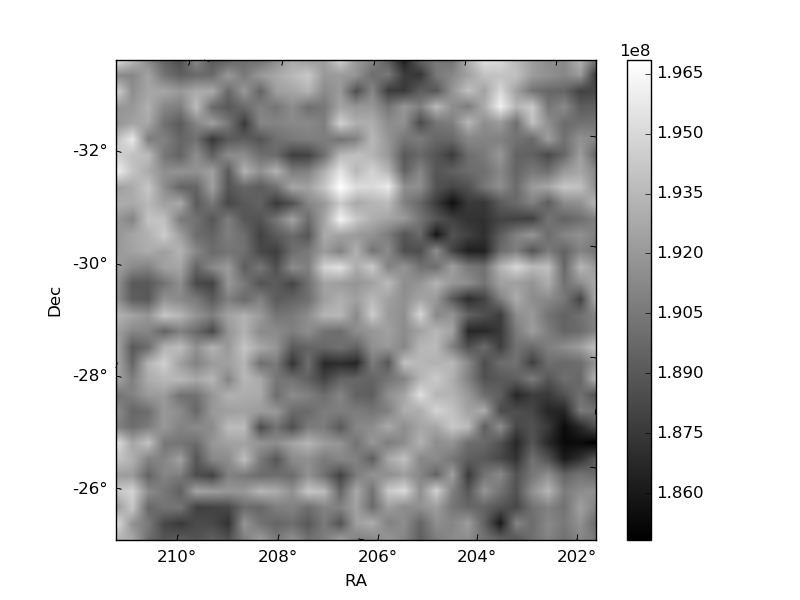
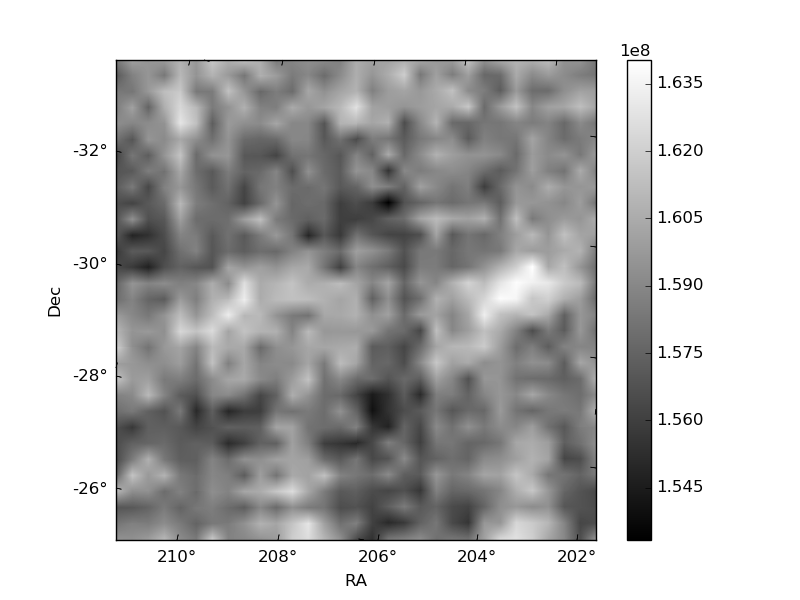
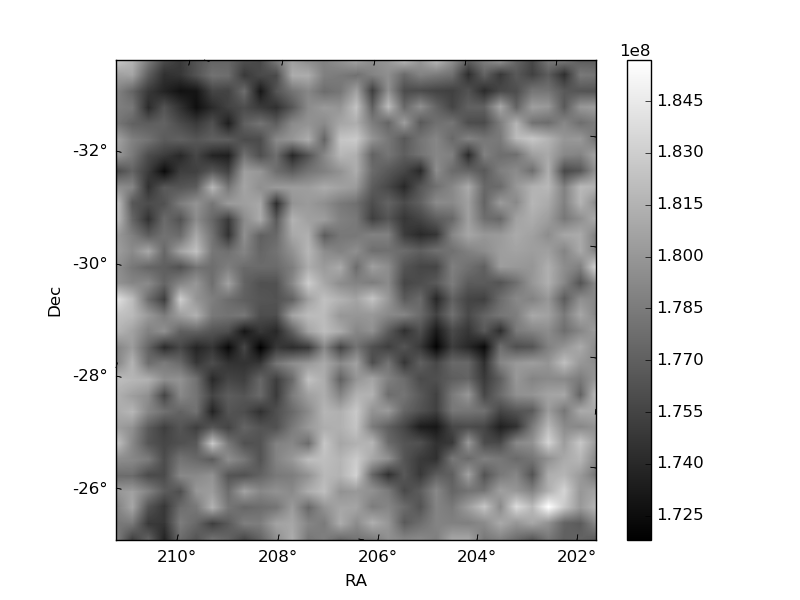
Histogram calculated using DETX and DETY for each event in the final _common_clean file
| Quadrant A | 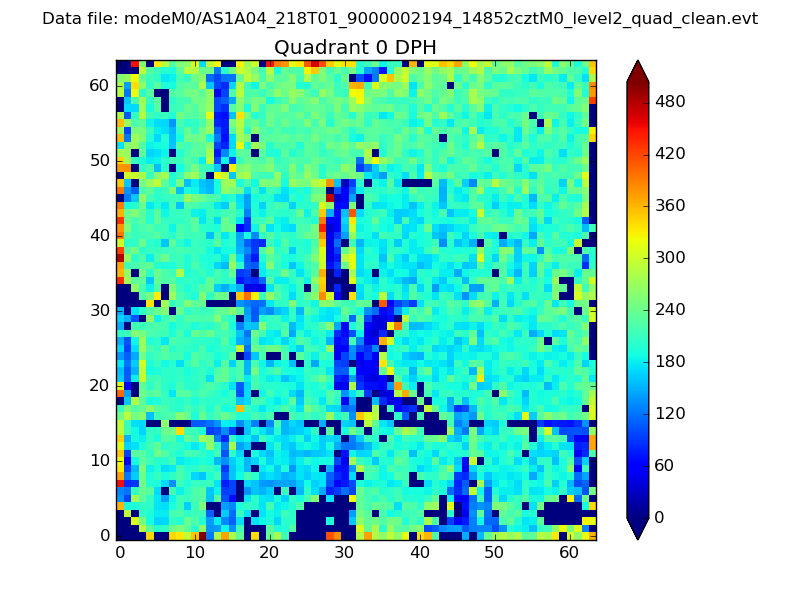 |
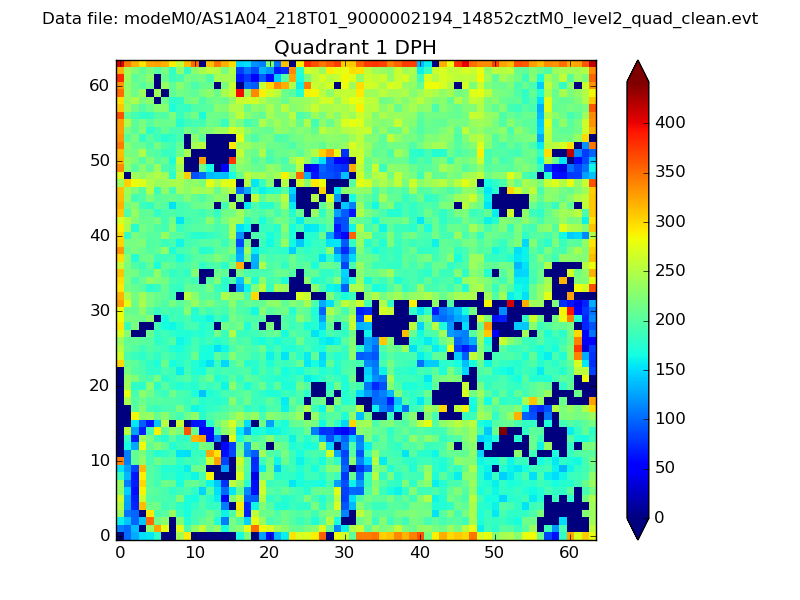 |
Quadrant B |
|---|---|---|---|
| Quadrant D | 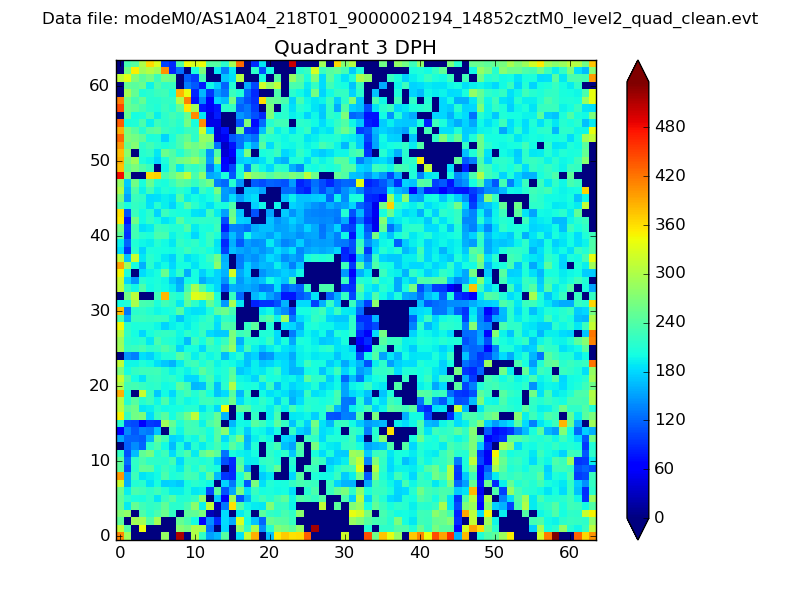 |
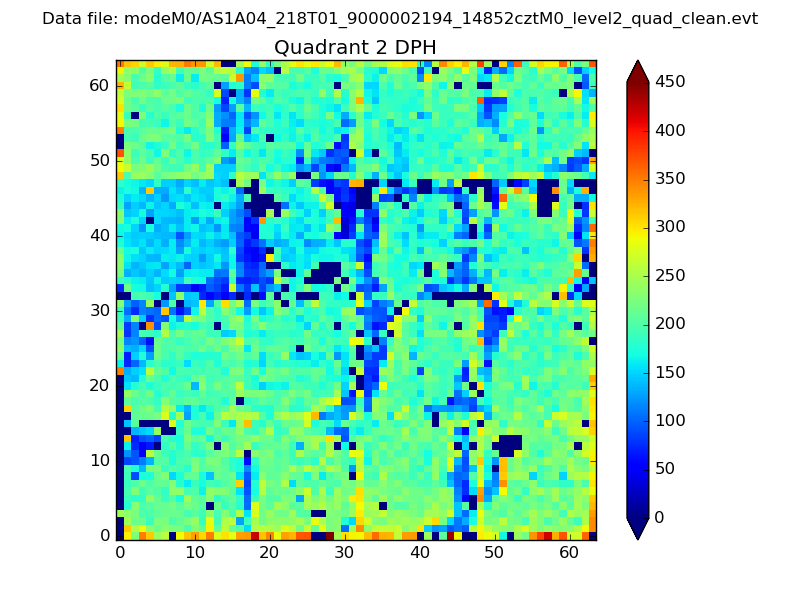 |
Quadrant C |
| Plot type | Count rate plots | Images |
|---|---|---|
| Comparison with Poisson distribution Blue bars denote a histogram of data divided into 1 sec bins. Red curve is a Poisson curve with rate = median count rate of data. |
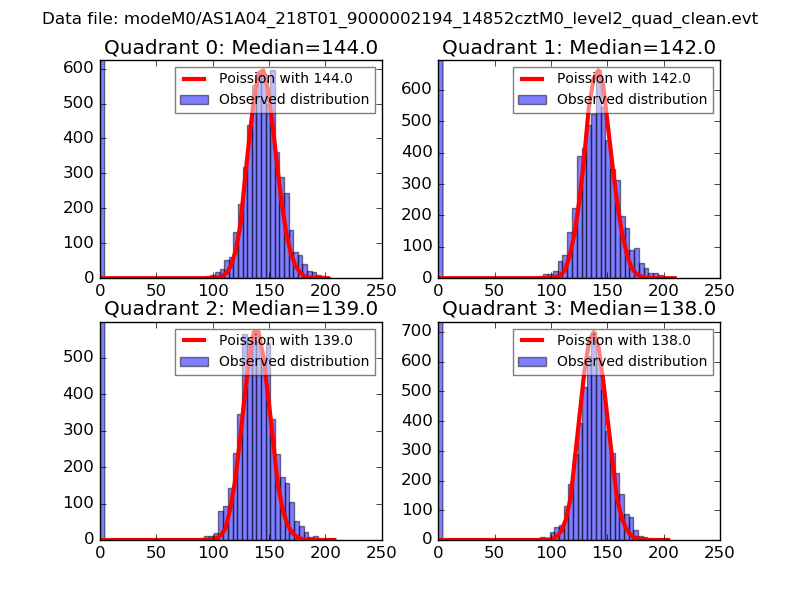 |
 |
| Quadrant-wise count rates Data is divided into 100 sec bins |
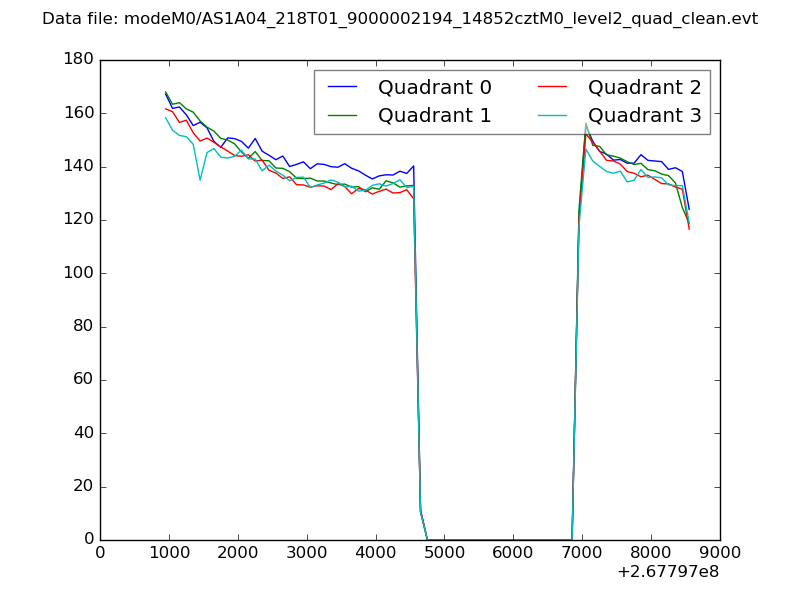 |
|
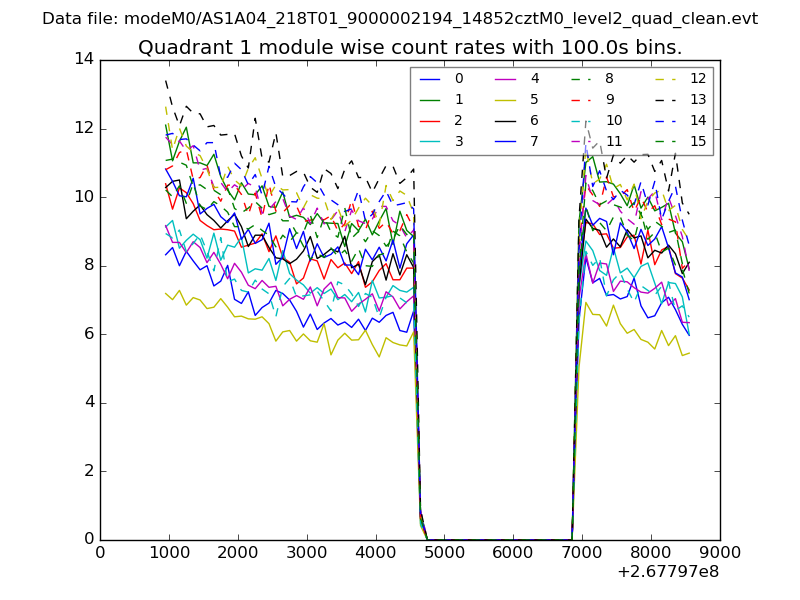
| Module-wise count rates for Quadrant A Data is divided into 100 sec bins |
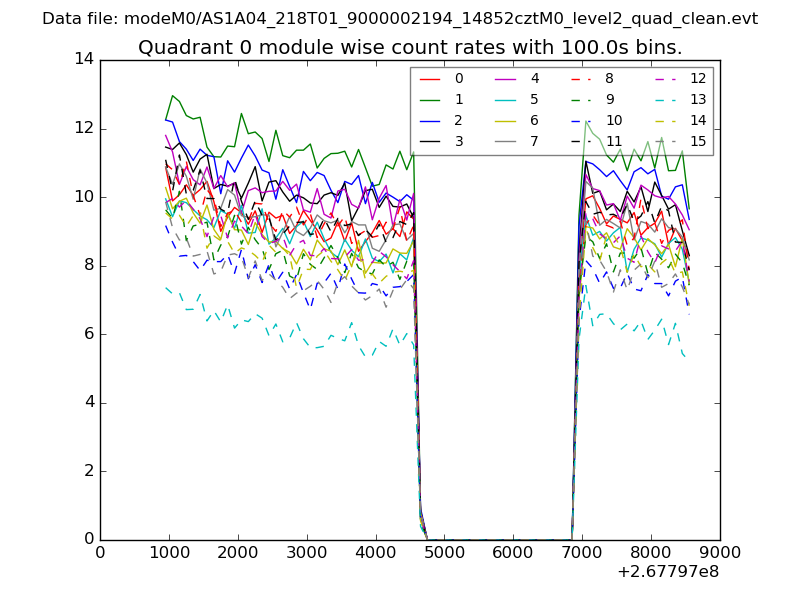 |
 |
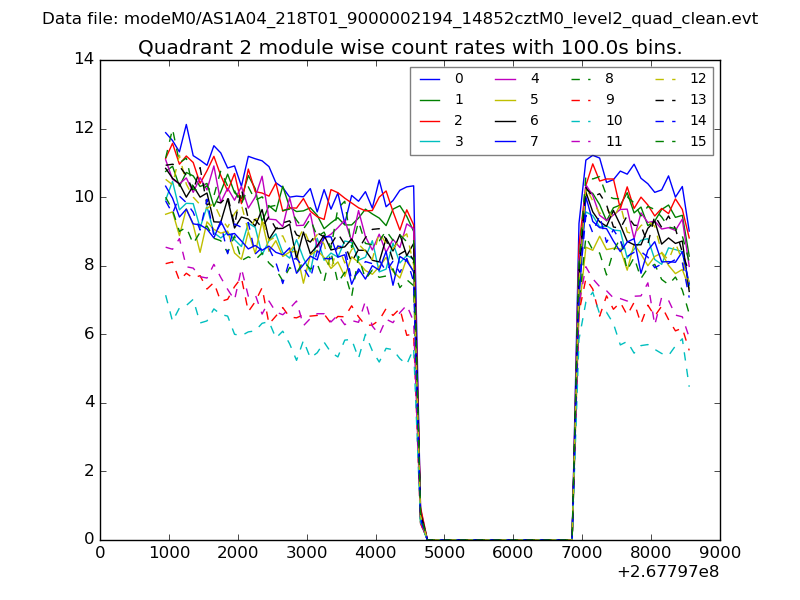
| Module-wise count rates for Quadrant B Data is divided into 100 sec bins |
 |
 |
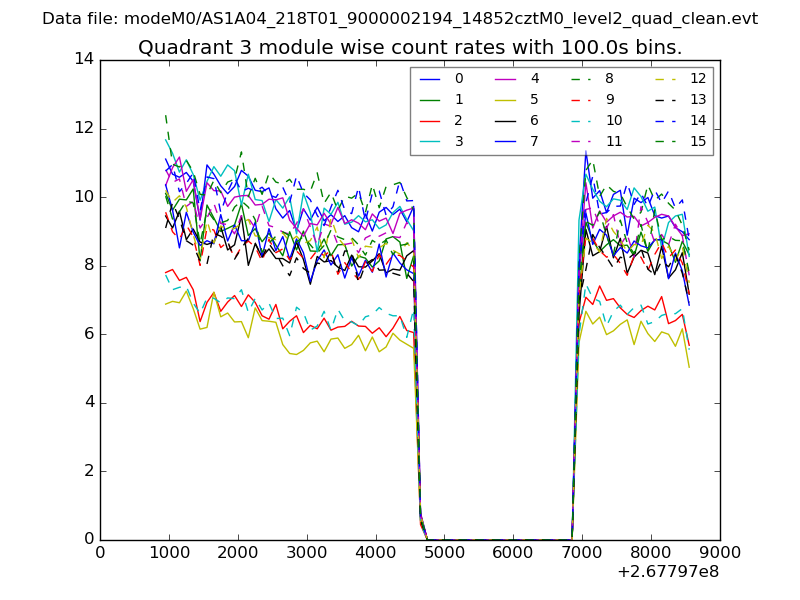
| Module-wise count rates for Quadrant C Data is divided into 100 sec bins |
 |
 |
| Module-wise count rates for Quadrant D Data is divided into 100 sec bins |
 |
 |
| Parameter | Plot |
|---|---|
| CZT HV Monitor | 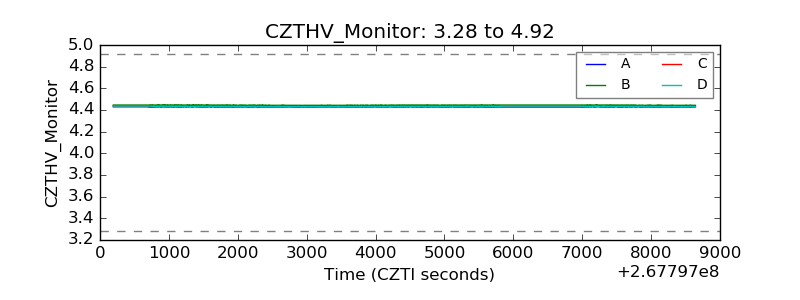 |
| D_VDD | 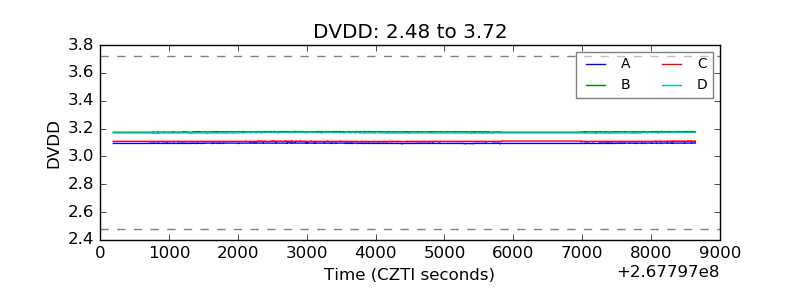 |
| Temperature 1 | 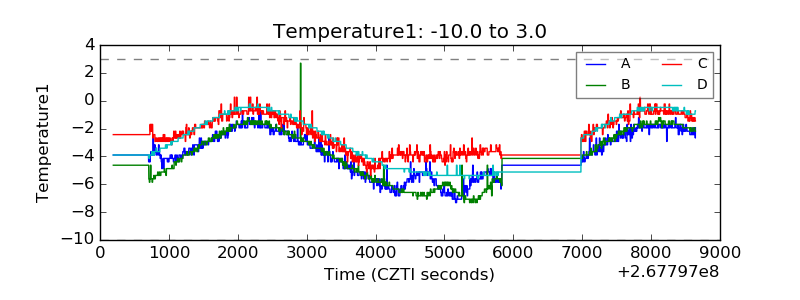 |
| Veto HV Monitor | 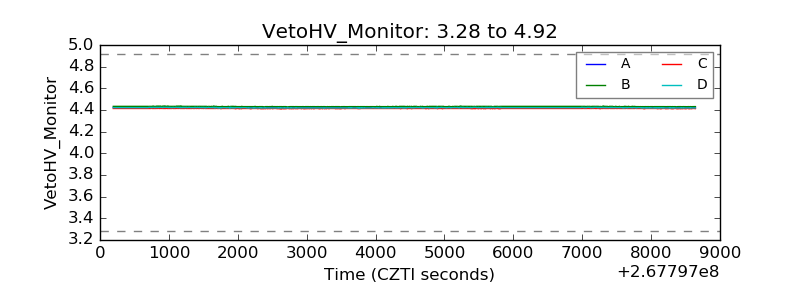 |
| Veto LLD | 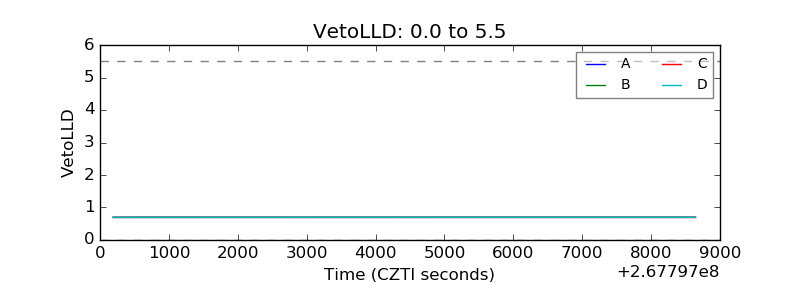 |
| Alpha Counter | 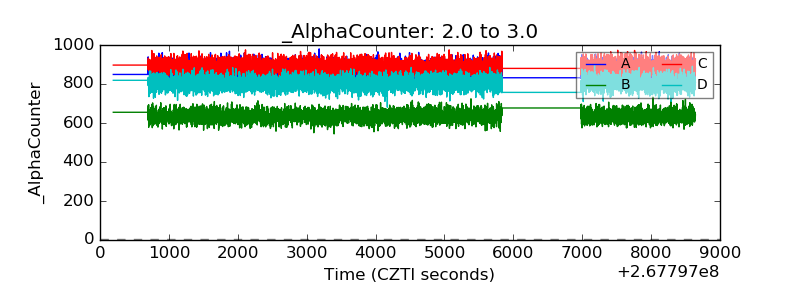 |
| _CPM_Rate | 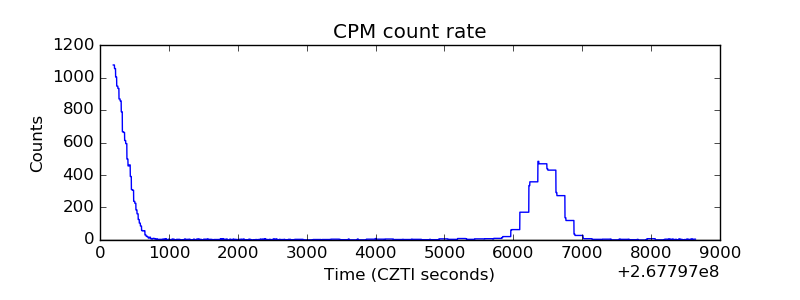 |
| CZT Counter | 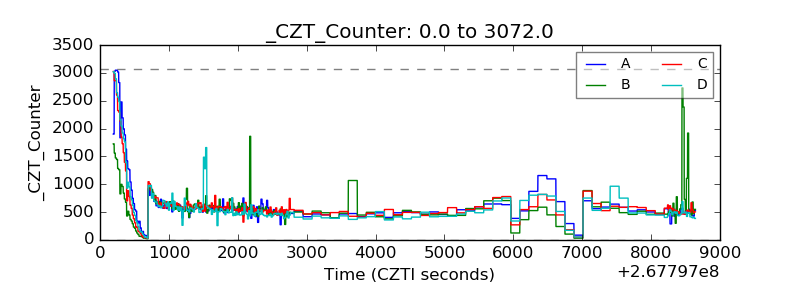 |
| +2.5 Volts monitor |  |
| +5 Volts monitor | 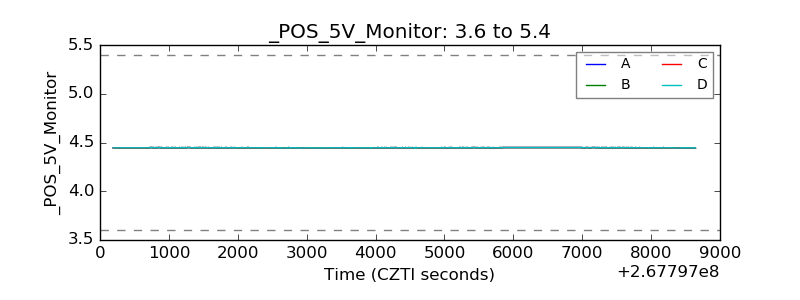 |
| _ROLL_ROT | 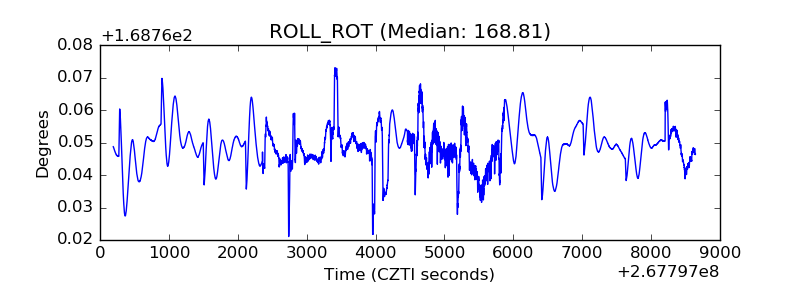 |
| _Roll_DEC | 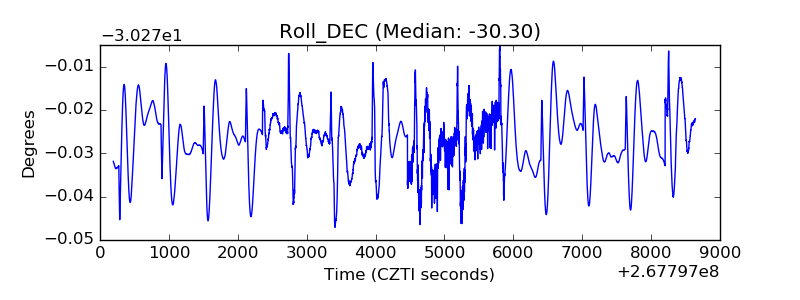 |
| _Roll_RA | 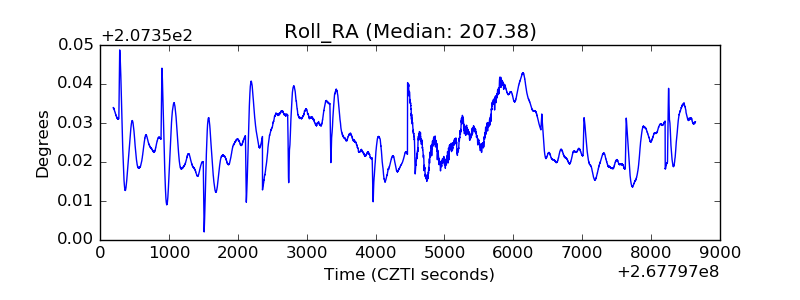 |
| Veto Counter | 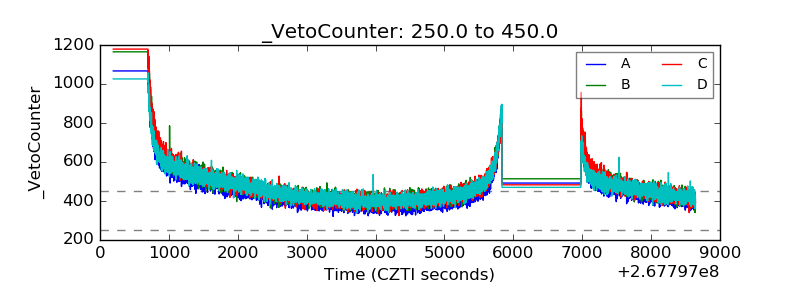 |